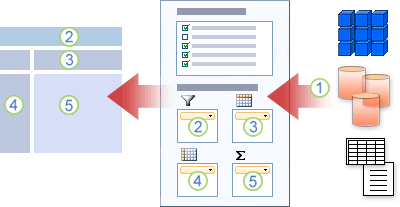
 Pivot tables are like the Swiss army knife of data analysis in Excel. They allow you to arrange data by simply dragging and dropping the data fields around at will, making them a very user-friendly and powerful tool to summarize and highlight the desired information.
In Overview of Pivot Tables (Microsoft) you can find a complete overview of pivot tables with references to instructions of how to create pivot tables and pivot data. Some of the features that make pivot tables very useful are:
- Slice & Dice Pivots: You can move fields anywhere in pivot tables and Excel instantly changes the report layout and calculations.
- Drill down pivot tables: You can drill-down and get details by just double clicking on a value.
- Change Summary from Total: You can change summaries from Total to Count, Average or something else very easily. Just use Value Field settings.
More advanced pivot table features are:
- Calculated Fields in Pivots: make custom calculations in Pivot Reports by adding calculated fields.
- Slicers: visual filters, which can be used to create interactive reports.
- Grouping: by date or customized intervals.
To handle datasets that wouldn’t fit in a single spreadsheet or table, Excel provides Power Pivot, a free add-in that allows to retrieve data from multiple sources and set up relationships between them.
Pivot tables can be seen as a simplification of OLAP cubes.