UML (Unified Modeling Language) is the most common notation used for software design. It is a standard way to visualize a system’s elements such as actors, activities, and system components. Therefore, it is very useful to communicate your application design to programmers, project manager, users and stakeholders.
UML diagrams can be grouped in two big categories according to system view they provide:
- Static view: show the system structure, its components and relationships. Examples: component diagram, class diagrams, entity-relationship diagrams*.
- Dynamic view: shows how the system works and the processes performed. Examples: use cases, activity diagrams and sequence diagrams.
Use cases
This diagram is used at the beginning of the development process to define the application requirements and scope. It shows the system functions and their links to actors. It responds the question ‘what does the system do?’ (without addressing how it does it).
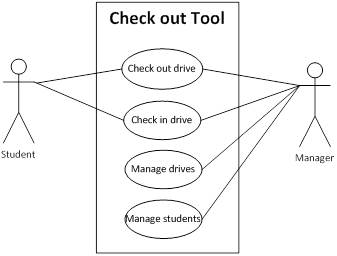
A use case diagram has the following components:
- Actor: a role within the business environment
- Use case: an operation performed in the system to produce a meaningful result for a user
- Relationship: an association between an actor and a use case
- System: the application boundary
Activity Diagrams
Shows the order in which actions are performed in a business activity either human or computer actors. An activity is more general concept than an action, it is a behavior that can be reused in many places, whilst actions are used only at determined points within an activity.

An activity diagram has the following components:
- Actions: a single step within an activity such as an arithmetic computation, a call to an operation or manipulation of object contents. Actions can have attached constraints.
- Control flow: the sequence of action execution, represented by arrows between actions.
- Start and final nodes: show the start and end of control flow.
It may also have the following type of nodes:
- Decision and merge: checks conditions that allow the flow to continue.
- Fork and join: indicate the start / end of concurrent threads of control. the join synchronizes two inflows and produces a single outflow. The outflow from a join cannot execute until all inflows have been received.
Activity diagrams can also have partitions or swim lanes that separate actions based on the actors that perform them.
Component Diagrams
A component diagram shows the parts of a design for a software system. It is useful to understand how the significant elements of a software system fit together, especially in the early stages of development.

Component diagrams have the following components:
- Components: autonomous, encapsulated units, usually a piece of software or group of classes. Their dependencies are designed such that they can be treated as independently as possible.
- Connectors: ‘wire’ components together based on interface compatibility.
Component diagrams have more elements, but these two provide a good starting point for your application design. Its utility isn’t in understanding low-level implementation details, but in performing an initial level of decomposition. On the Decision Support Systems section you can see the typical components of an OR application. Some of the benefits of using component diagrams are:
- Helps the development team to understand an existing design and create a new one.
- Helps improve the separation between the components, making the design easier to change when requirements change.
- Its independent of the language or platform the application uses.
Sequence diagrams
Sequence diagrams show how different components interact during the functioning of a system. Use them for the most frequent or important functions to explain the existing components and the messages that trigger their interactions.
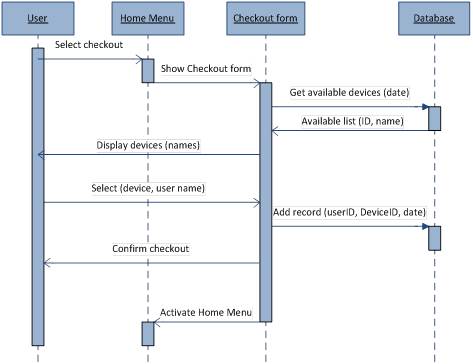
A sequence diagram has the following components:
- Lifelines: dashed lines that represent the lifeline of a component or actor.
- Interactions: messages between components represented by arrows.
- Activations: execution occurrences represented by narrow rectangles
A good programming practice is to separate interactions between the interface and the other application components (model, database). This is done by creating an entity controller, an independent component that controls the connections between the interface and other components. In an OR application you can have a controller for the model and another for the database. The main advantage of having controllers is that, if there are changes in the business requirements, they help to localize modifications without disrupting the tool design. (See robustness analysis for more details.)
State Charts
A statechart shows the life of an object in terms of the states the object can take and the events that modify them. They are useful when objects have a small number of important states or events with important conditions.

A state diagram has the following components:
- State: a set of attribute values that describe an object condition at a specific moment in time. Initial and final states show the start and end the flow of states.
- Transition: a change of state caused by an event. Some events my not change the state, causing a self transition.
References
- http://www.sparxsystems.com/resources/uml2_tutorial/
- http://warren.chinalle.com/2008/01/10/uml-2-diagrams/
- http://www.sparxsystems.com/resources/uml2_tutorial/uml2_sequencediagram.html
- http://www.agilemodeling.com/artifacts/robustnessDiagram.htm
- http://www.tracemodeler.com/articles/a_quick_introduction_to_uml_sequence_diagrams/