E-Portfolio | Daniel Minney

Proportional Symbol Maps

Posted by in Cartography

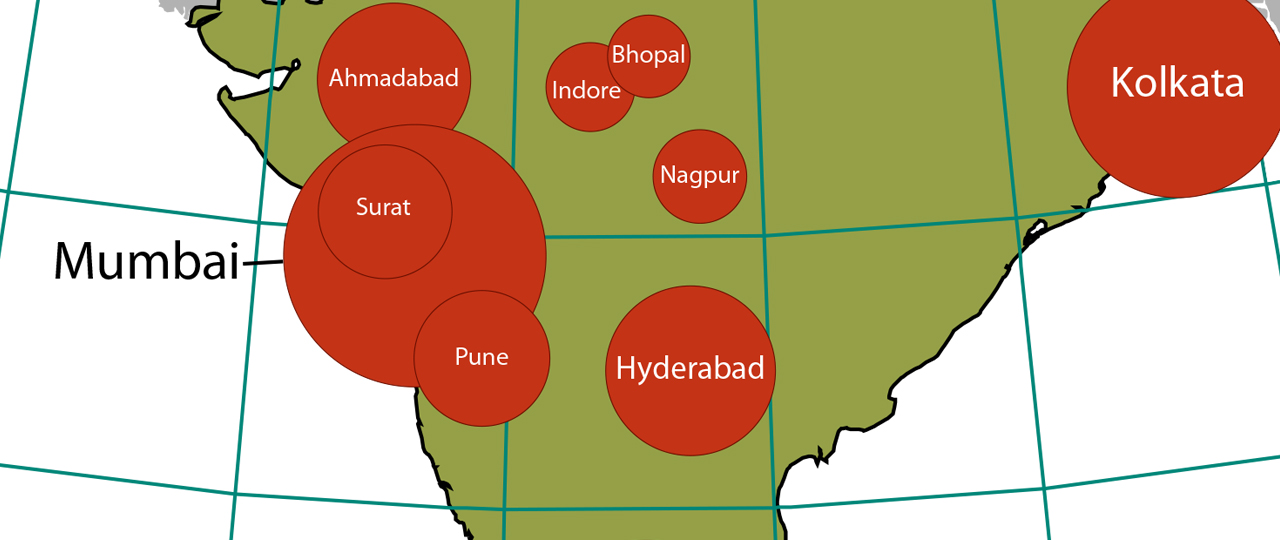
Using Absolute Scaling Using Perceptual Scaling Summary Absolute scaling for proportional symbol maps allows for an accurate representation of the area difference between cities. However, when viewed on a map, humans commonly underestimate area differences for symbols when using absolute scaling. In the map of Indian cities with a population greater than 2 million, the absolute scaling, although scaled to true values, makes it look like the middle-sized cities are a lot closer in population size to the largest cities such as Delhi, Mumbai, and Kolkata. This problem is largely…read more

Lettering

Posted by in Cartography

Accomplishments Gained an understanding of type families, styles, and sizes for design, and placement of labels on a colour map of British Columbia. Created using Adobe Illustrator.

Final Project – An Assessment of Translink’s 10-Year Vision

Posted by in Geographic Information Systems

Summary The goal of this project was to analyze whether Translink’s 10-year Vision to improve public transportation across Metro Vancouver assesses the current lack of rapid transit in the region. The project focused on ‘Phase Two’ of the 10-year Vision, which includes the implementation of the Broadway Corridor Subway and Surrey & Langley Light Rail. The project used data publicly available from various sources, and primarily utilized data about the mode of transportation used by residents from the 2011 NHS. Existing rapid transit routes were used alongside the proposed routes…read more

Environmental Assessment for a Proposed Ski Resort

Posted by in Geographic Information Systems

Summary The two maps above have been created as a tool to help visualize the area around Brohm Ridge which has been proposed as a site for the construction of a potential ski-resort. Various key components have been considered for environmental assessment of the proposed area. The following are the key components: Rivers; Roads; Areas under 600m; Fishery habitats; Old growth management areas; Ungulate winter range; Park Boundaries; and Red listed ecosystems. Various steps have been taken to analyze the data. The first was parsing the data, done by creating…read more

Quantitative Data Classification and Housing Affordability in Vancouver, BC

Posted by in Geographic Information Systems

Summary The four maps use different classifications to display median dwelling cost in Vancouver, BC. As a journalist a natural breaks map would be good at displaying how expensive Metro Vancouver without distorting the breaks. A real estate agent may want to use a map showing manual breaks as it presents the information as easy to understand with clear breaks. Different classification methods can be used to visually trick people into thinking areas are cheaper than they appear. For example, if you were to use an equal interval map, it…read more

Identifying Tsunami Risk in Vancouver, BC

Posted by in Geographic Information Systems

Summary 15.49% of the City of Vancouver’s total area would be affected by the potential threat of a tsunami. – Method used: used the attribute table to find the total area of Vancouver. For the potential affected area, obtain the sum from the attribute table and divide by the total area of Vancouver. For Vancouver’s health facilities, the following are in danger: FALSE CREEK RESIDENCE BROADWAY PENTECOSTAL LODGE COAST WEST COMMUNITY HOME YALETOWN HOUSE SOCIETY VILLA CATHAY CARE HOME For Vancouver’s educational facilities, the following are in danger: ST ANTHONY…read more

Spam prevention powered by Akismet