The first model uses control variables from the climate and the environment, including: temperature, precipitation, soil moisture content, vapour pressure, potential evapotranspiration (PET) and elevation. Through the results, winter vapour pressure, average summer and winter temperatures, and PET are the largest factors to tick populations (see Table 1A). On the other hand, summer soil water content, maximum summer temperature, soil type, and average summer precipitation had little contribution to this model.
Table 1A: Model I Variable Contribution
| Variable | Output Name | Percent Contribution (%) | Permutation Importance (%) |
| Winter Vapour Pressure (kPa) | vpr_winter | 28.1 | 5.2 |
| Average Summer Temperature (C⁰) | avg_summer_temp | 17.8 | 13.4 |
| Average Winter Temperature (C⁰) | avg_winter_temp | 16.5 | 6.1 |
| Potential Evapotranspiration (PET) | pet | 14.3 | 24.4 |
| Winter Soil Water Content | swc_winter | 12.2 | 24.1 |
| Minimum Winter Temperature (C⁰) | min_winter_temp | 4.9 | 15.2 |
| Summer Vapour Pressure | vpr_summer | 2.4 | 1.9 |
| Digital Elevation Model | dem | 1.8 | 4.8 |
| Summer Precipitation | summerprecip | 1 | 2.5 |
| Soil Type | soils | .7 | 1.9 |
| Maximum Summer Temperature (C⁰) | max_summer_temp | .2 | .1 |
| Summer Soil Water Content | swc_summmer | 0 | .5 |
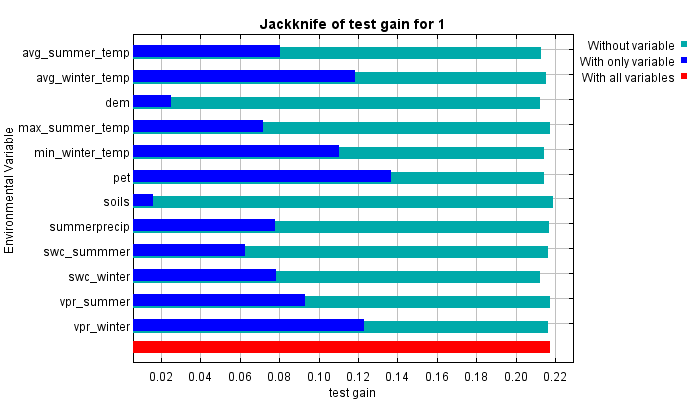
As stand alone variables, the same pattern exists along the high and low contributors, as indicated by the dark blue bars (see Figure 1A). The jackknife results, confirm the tabular data by showing that the variable with the highest gain is PET, followed by winter vapour pressure and average winter temperature.
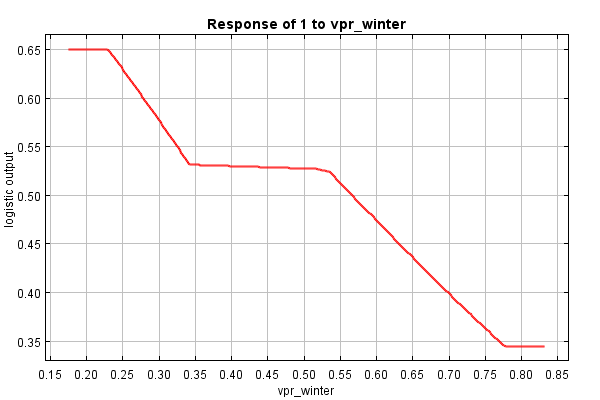
With the given results, it would be beneficial to look more in depth at each of the variables that were identified as contributing the largest factors to tick populations. Winter vapour pressure ranges between 0.17 kPa to 0.84 kPa but for a prediction accuracy of 65 percent, vapour pressure falls between 0.17 kPa to 0.23 kPa. After this point, it ceases to remain a viable predictor of suitable tick climate. This suggest that climates past this point make for poor tick habitats.
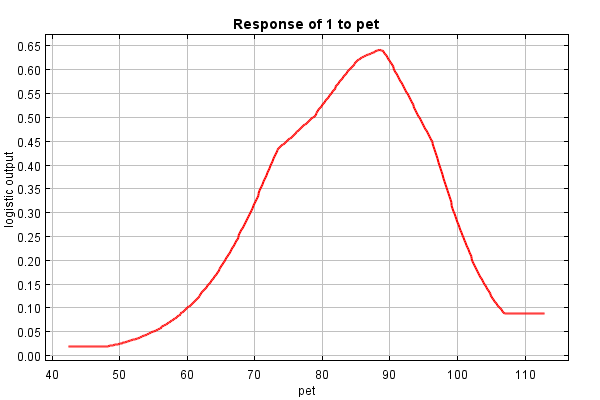
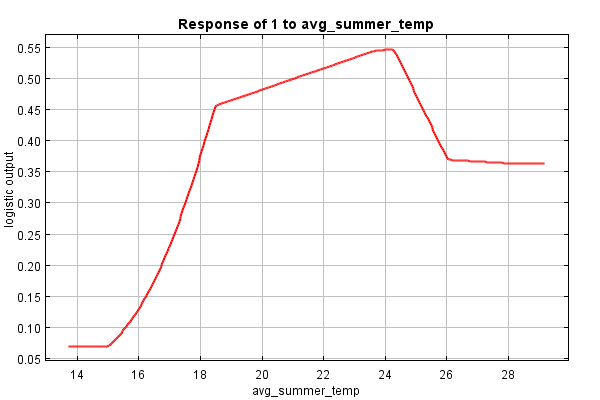
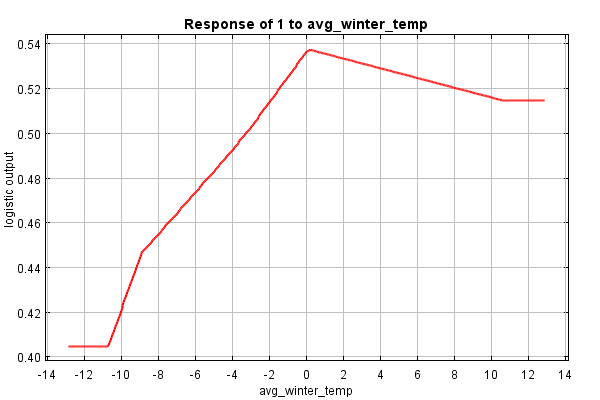
Potential Evapotranspiration produces the highest logistic output between values of approximately 85 and 95 on the index (see Figure 1C). PET scores lower than this suggest areas too dry to allow optimal tick performance, while areas with higher PET scores suggest areas are too wet. Pennsylvania, Maryland, and New Jersey are areas predicted to contain ticks based on their PET index scores. Other variables have similar patterns: once Average Summer Temperatures reach approximately 24 degrees Celsius, their predictive power drops off, while Average Winter Temperatures reach their optimal predictive spot at zero degrees (see Figure 1D and 1E).
The low contribution of Summer Precipitation, Minimum Winter Temperature, and Summer Vapour Pressure is interesting: ticks require temperature and humidity to remain above a critical threshold to maintain high probability that larvae survive to adulthood (Cheng et al., 2017). The contribution of the precipitation variable could be too correlated with another variable, such as vapour or PET, and their contribution negated as a result (the other variable is used instead).
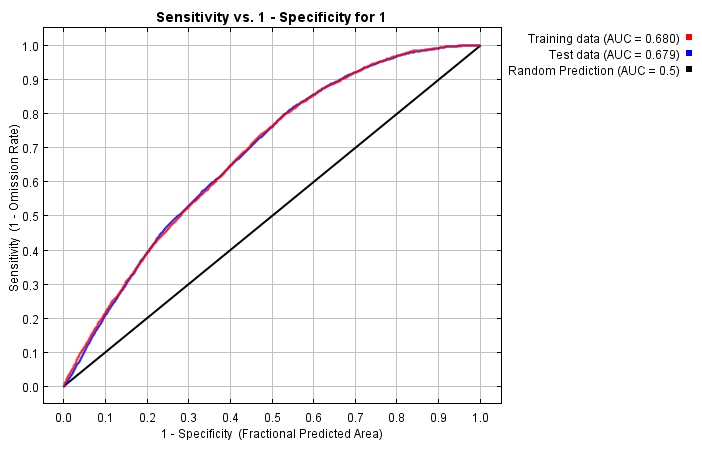
From the results, it can be noted that the model is quite inaccurate. The area under the curve (AUC) output yielded 0.679, as seen in the Figure 1F, showing that the prediction accuracy of the model is only at approximately 68 percent.
Given the variables used in this model, tick populations are most likely found in the areas displayed in red on the map (see Figure 1G). Note that the areas, which are ideal habitats for tick populations, are quite widespread in the study area.
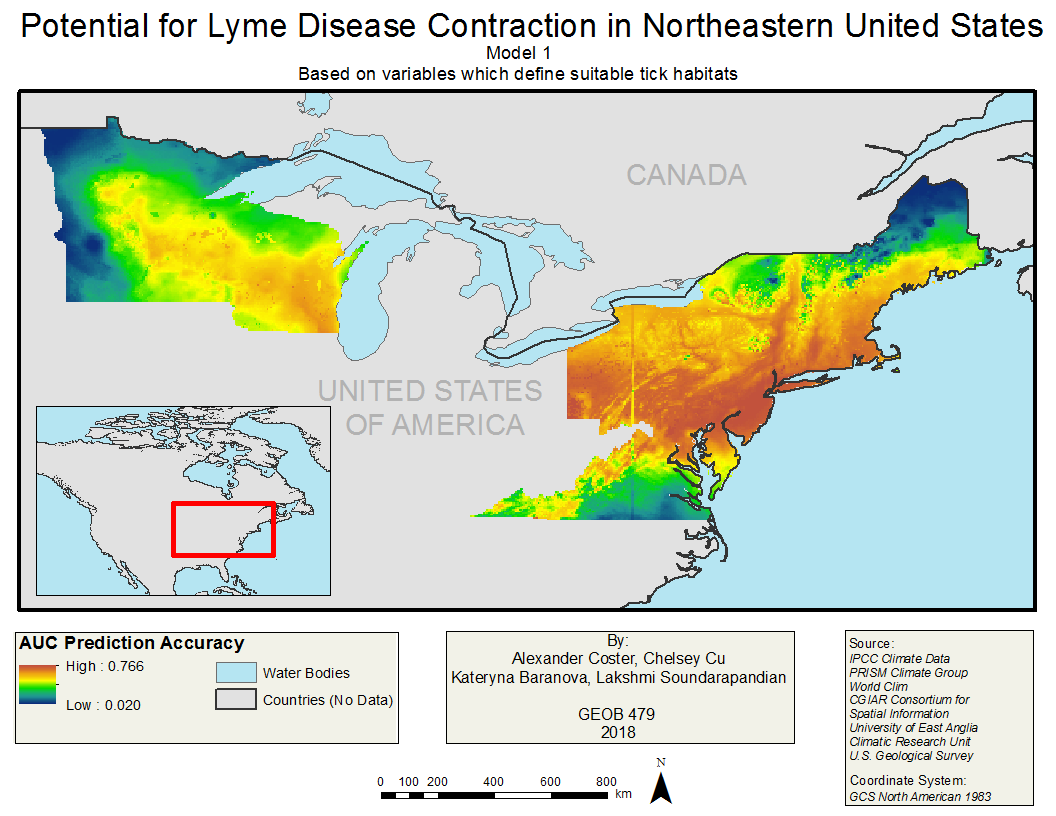
Overall, this model served to give initial insight on the selected climatic variables and effects in tandem with each other and in isolation, however, it did not help to identify areas that are optimal tick habitats.
Next section: Model 2