
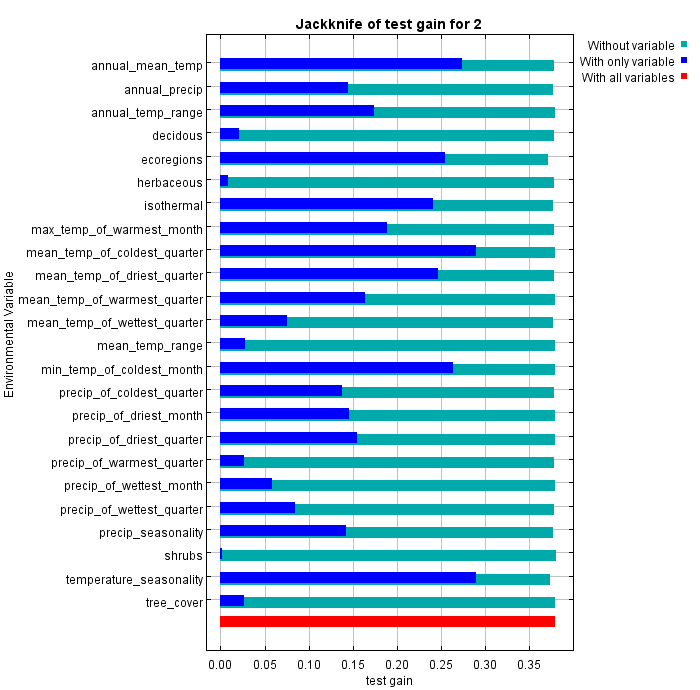
Model 2 incorporates vegetation variables along with climate and the environmental variables. These include: temperature, precipitation, isothermality, ecological regions, and vegetation cover. Those that were removed from Model 1 were: soil moisture content, soil type, potential evapotranspiration and elevation. Through the results, mean temperature of coldest quarter (winter), and annual mean temperature are the largest factors to tick populations (see Table 2A). On the other hand, precipitation of the wettest month and precipitation of the warmest quarter (summer) had little contribution to this model.
Table 2A: Model 2 Variable Contribution
| Variable | Output Name | Percent Contribution (%) | Permutation Importance (%) |
| Mean Temperature of Coldest Quarter (C⁰) | mean_temp_of_coldest_quarter | 53.1 | 4.7 |
| Annual Mean Temperature (C⁰) | annual_mean_temp | 10.5 | 27.2 |
| Isothermality (C⁰) | isothermal | 9.7 | 0.3 |
| Ecological Regions | ecoregions | 7.7 | 18.4 |
| Precipitation of Coldest Quarter (mL) | precip_of_coldest_quarter | 4.1 | 8.1 |
| Maximum Temperature of Warmest Month (C⁰) | max_temp_of_warmest_month | 3.9 | 3.6 |
| Seasonal Temperature (C⁰) | temperature_seasonality | 2.6 | 12.1 |
| Precipitation of Warmest Quarter (mL) | precip_of_warmest_quarter | 2.3 | 5 |
| Mean Temperature of Warmest Quarter (C⁰) | mean_temp_of_warmest_quarter | 2 | 1.2 |
| Seasonal Precipitation (mL) | precip_seasonality | 0.9 | 13.1 |
| Precipitation of Driest Month (mL) | precip_of_driest_month | 0.9 | .1 |
| Minimum Temperature of the Coldest Month (C⁰) | min_temp_of_coldest_month | 0.7 | 0 |
| Mean Temperature of Wettest Quarter (C⁰) | mean_temp_of_wettest_quarter | 0.6 | 0.6 |
| Precipitation of Driest Quarter (mL) | precip_of_driest_quarter | 0.5 | 1.4 |
| Annual Precipitation (mL) | annual_precip | 0.1 | 1.8 |
| Herbaceous Plant Cover | herbaceous | 0.1 | 0.3 |
| Mean Temperature Range (C⁰) | mean_temp_range | 0 | 1.2 |
| Shrubs | shrub | 0 | 0.2 |
| Deciduous Tree Cover | deciduous | 0 | 0.2 |
| Annual Temperature Range (C⁰) | annual_temp_range | 0 | 0.5 |
| Tree Cover | tree_cover | 0 | 0.1 |
| Mean Temperature of Driest Quarter (C⁰) | mean_temp_of_driest_quarter | 0 | 0.1 |
| Precipitation of Warmest Quarter (mL) | precip_of_warmest_quarter | 0 | 0 |
| Precipitation of Wettest Month (mL) | precip_of_wettest_month | 0 | 0 |
The high contribution of mean temperature of coldest quarter and annual mean temperature comes as no surprise: the effects of temperature and humidity on the rates of interstitial development, and thus on the duration of the life cycle, are well documented (see Figure 2A). Like Model 1, climate, especially those pertaining to cold temperatures are the most dominant variables. This is most likely a result of poor survival rates of larvae given temperatures past a certain threshold (Ozenderal, 2015).
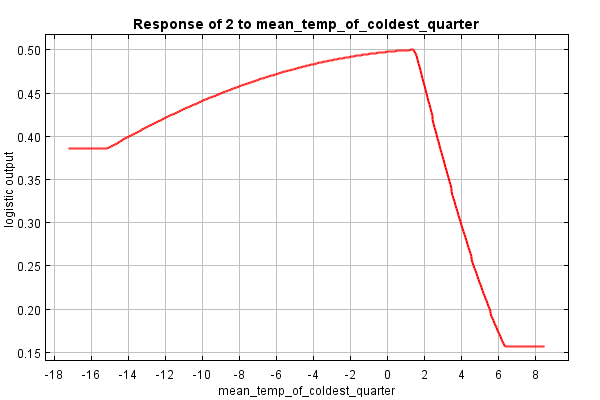
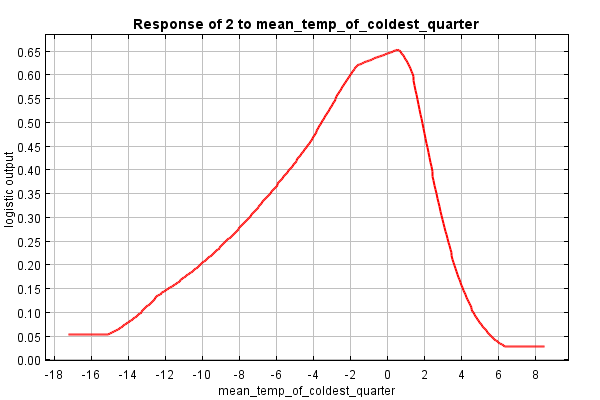
As previously confirmed, mean temperature of the coldest quarter, in other words, mean winter temperature, signifies a threshold that represents tick survival rates, and by association, Lyme disease dispersal capacity. The curve in the graph on Figure 2B shows the marginal effect of changing exactly one variable. This can be compared to the graph in Figure 2C which reflect the dependencies induced by correlations between the selected variable and other variables. For both graphs of this variable, it is notable that the upper threshold sits at around 1 degree Celsius. However, independently, this variable shows that even dropping to temperatures below -16 degrees Celsius only effects the output accuracy by 0.38. In contrast, Figure 2C shows that dropping below -2 degrees Celsius drastically reduces the likelihood of tick populations surviving in such habitats.
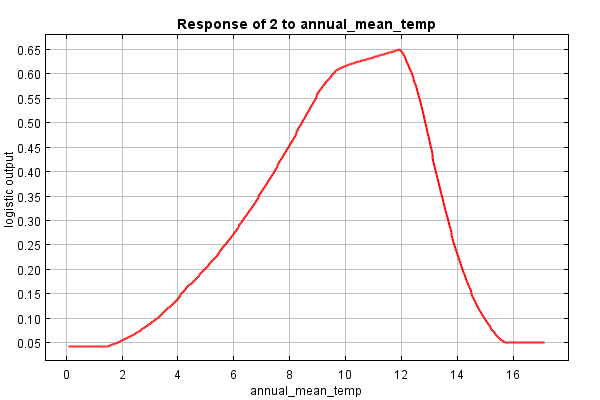
The annual mean temperature produces the highest logistic output between values of approximately 9.5 and 12.5 degrees Celsius (see Figure 2D). Temperatures lower than this suggest that areas are on a yearly average too cold for tick survival. On the other side of this spectrum, temperatures that are higher than this quickly become too hot and arid for ideal habitats as well.
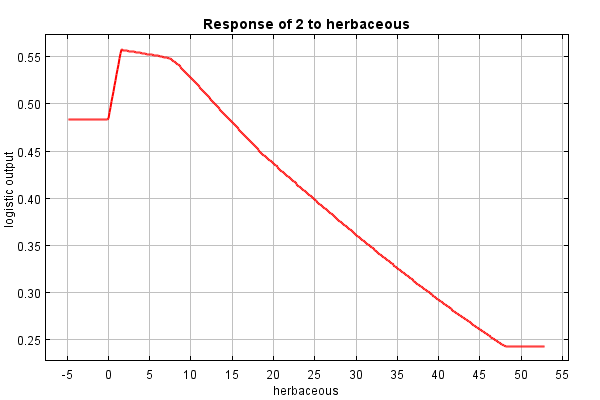
Interestingly, while this model adds vegetation, this variable seems to have little effect on the overall areas where tick populations settle. Herbaceous plant cover seems to be the most influential vegetation, and it still only contributes 0.1 percent to the overall model results (see Table 2A). Figure 2E indicates that ideally herbaceous vegetation should range between 1.5 to 7.5 for a logistic output of about 0.55. This indicates that anything below the lower threshold might be too sparse for ticks to survive in, while anything too high would provide too much vegetation for ticks to maneuver. This could be because humans and other host species tend not to traverse into areas of dense vegetation.
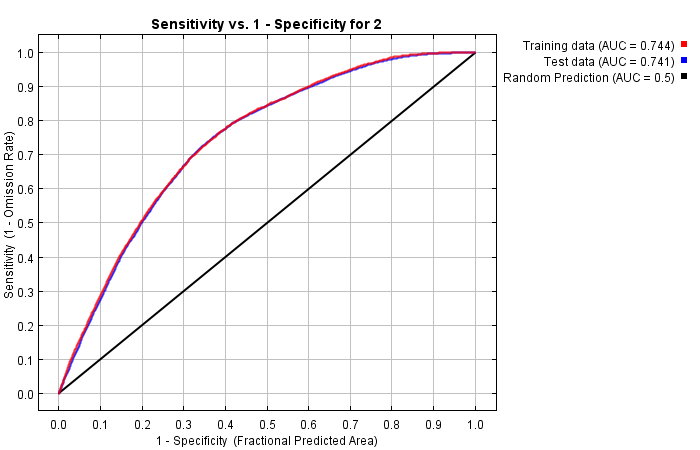
With this new classes, it can be noted that the model is quite inaccurate. AUC output yielded 0.741, as seen in the Figure 2F, showing that the prediction accuracy of the model is only at approximately 74 percent. While this is a vast improvement from Model 1, ideally, 80 percent accuracy or higher would be best for habitat predictions.
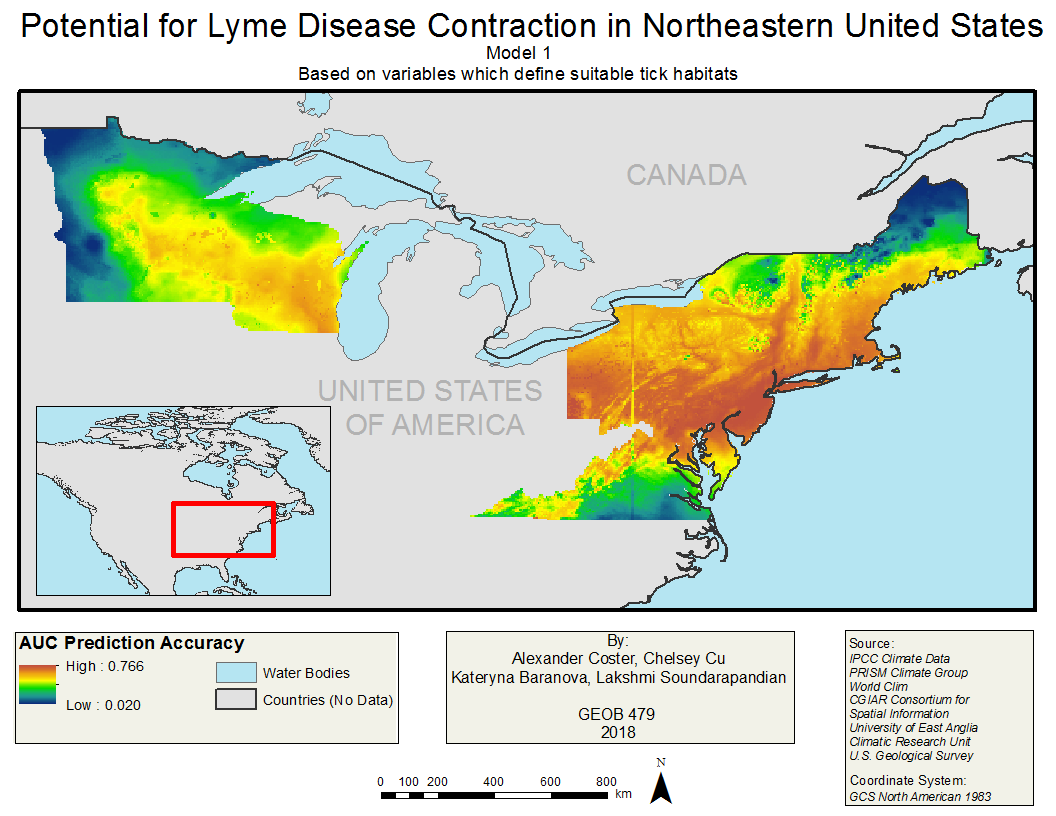
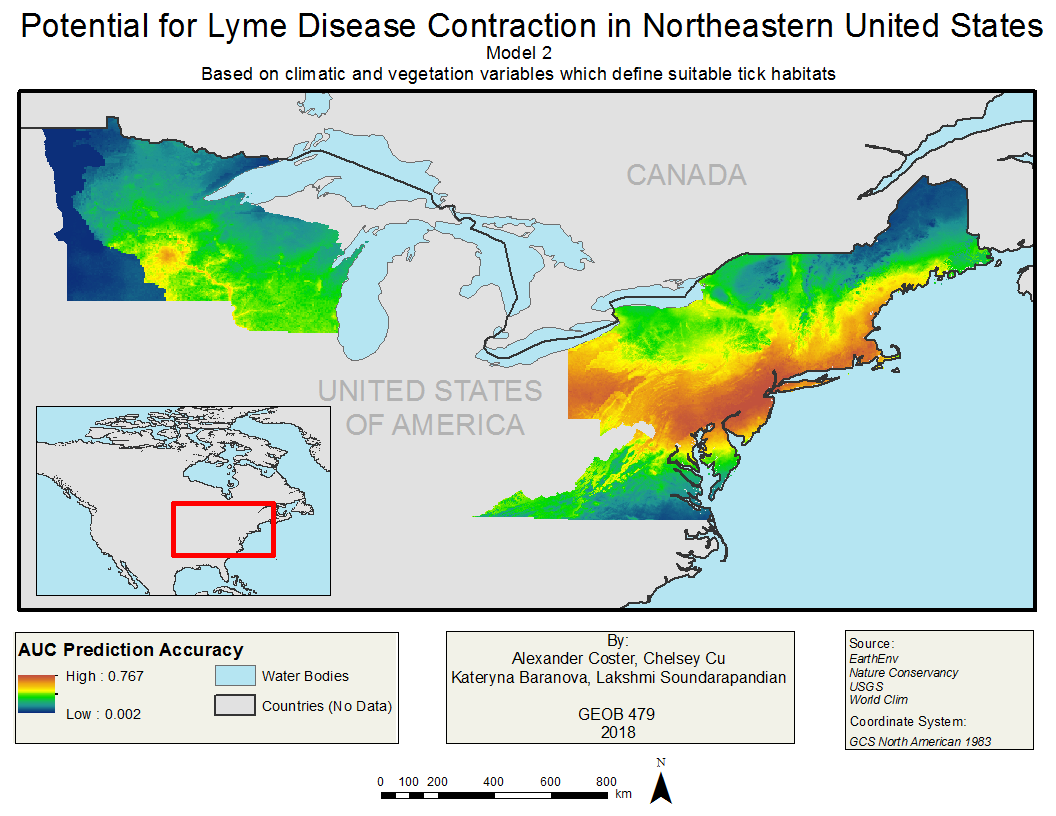
Given the information provided in this model, tick populations are most likely found in Pennsylvania, New York, Connecticut, Massachusetts, Rhode Island, and Delaware, which are displayed as red regions (see Figure 2G). There is noteably less red areas in Model 2 than there were in the map shown in Model 1 (see Figure 1G).
Overall, with added vegetation, climate still remains a dominant variable in tick habitats. This model serves to strengthen previous findings and act as a basis for Model 3.
Next section: Model 3