
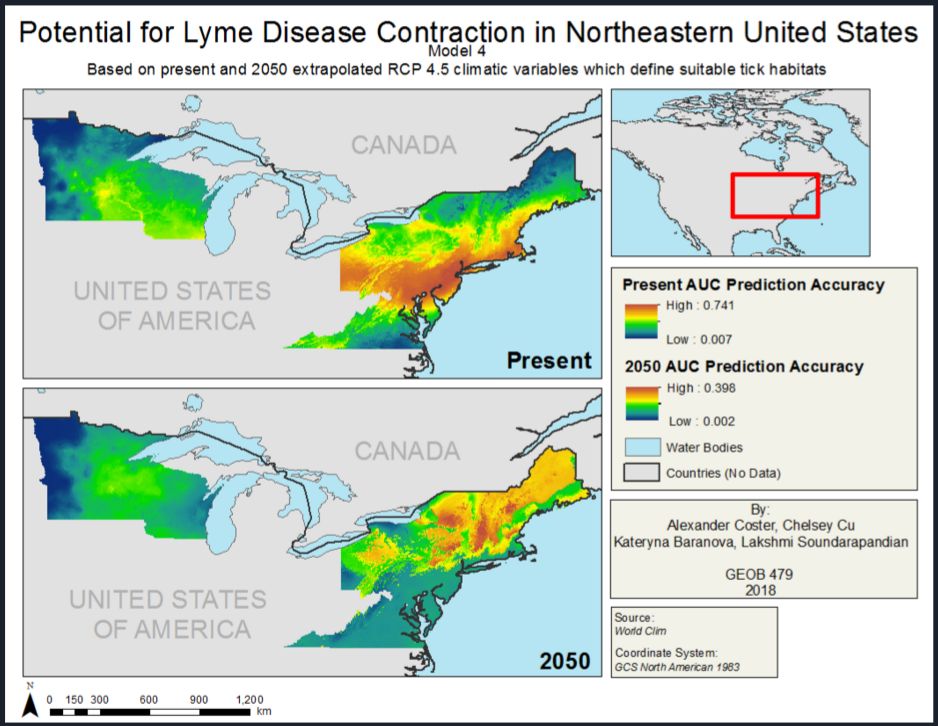
Part of our analysis focused on analyzing predicted shifts in areas suitable for significant tick distribution under changing climate conditions. We projected one model trained on a set of climatic variables for the present to an identical set of environmental layers adjusted to future climate conditions. The Extrapolation model used World-Clim climate control variables used in models 2 & 3, which focused on minimum and maximum temperatures, precipitation, temperature ranges, and seasonality. For this model, only climatic variables were used: extrapolating changes in vegetation, landcover, and deer populations would be almost completely arbitrary, adding greater bias to our model. The Model trained on the environmental variables corresponding to current climate conditions, and then projected onto the ASCII grids of 2050 climate conditions. AUC prediction accuracy moves steadily northward from Virginia, southern Wisconsin and Pennsylvania into New Hampshire, Maine and Vermont (Map 4A).
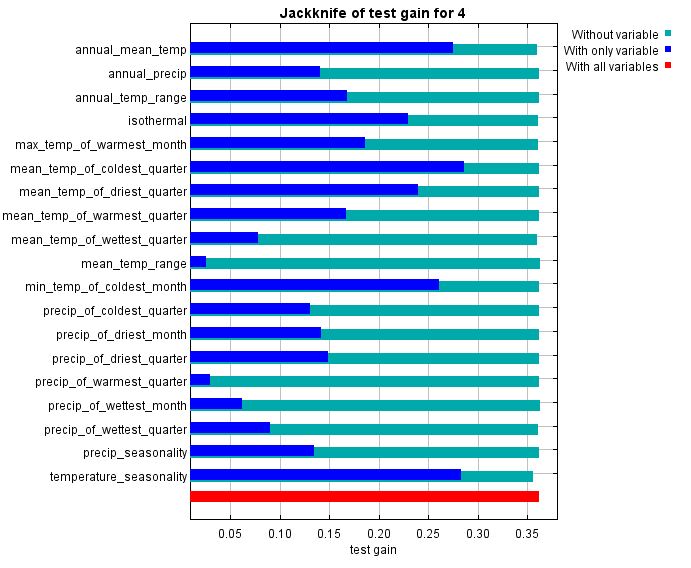
Mean temperature of the coldest quarter, annual mean temperature, temperature seasonality, and max temperature of the warmest month contributed the most to predictions of black-legged tick occurrence. On the other hand, annual precipitation, precipitation of the warmest quarter, and the mean diurnal range contributed the least to the model.
Table 4A: Model 4 Variable Contribution (2050 Projections)
| Variable | Output Name | Percent Contribution (%) | Permutation Importance (%) |
| Mean Temperature of Coldest Quarter | mean_temp_of_coldest_quarter | 48.4 | 2.8 |
| Annual Mean Temperature | annual_mean_temp | 11.4 | 4.7 |
| Temperature Seasonality (standard deviation *100) | temperature_seasonality | 9.6 | 22 |
| Max Temperature of Warmest Month | max_temp_of_warmest_month | 8.2 | 33.2 |
| Isothermality (Mean Diurnal Range / Temperature Annual Range) (*100) | isothermal | 5.2 | 1.7 |
| Precipitation of Driest Month | precip_of_driest_month | 3.4 | 0.1 |
| Precipitation of Wettest Quarter | precip_of_wettest_quarter | 3 | 3.6 |
| Precipitation Seasonality (Coefficient of Variation) | precip_seasonality | 2.2 | 1.9 |
| Precipitation of Driest Quarter | precip_of_driest_quarter | 2 | 5.5 |
| Mean Temperature of Warmest Quarter | mean_temp_of_warmest_quarter | 1.5 | 0.1 |
| Precipitation of Coldest Quarter | precip_of_coldest_quarter | 1 | 15.9 |
| Mean Temperature of Wettest Quarter | mean_temp_of_wettest_quarter | 0.9 | 1 |
| Mean Temperature of Driest Quarter | mean_temp_of_driest_quarter | 0.9 | 5.5 |
| Precipitation of Wettest Month | precip_of_wettest_month | 0.9 | 0 |
| Temperature Annual Range (Max Temperature of Warmest Month – Minimum Temperature of Coldest Month) | annual_temp_range | 0.4 | 0 |
| Min Temperature of Coldest Month | min_temp_of_coldest_month | 0.4 | 0 |
| Mean Diurnal Range (Mean of monthly (max temp – min temp)) | mean_temp_range | 0.3 | 0.8 |
| Precipitation of Warmest Quarter | precip_of_warmest_quarter | 0.2 | 1.1 |
| Annual Precipitation | annual_precip | 0.2 | 0 |
As stand alone variables, annual mean temperature, mean temperature of the coldest quarter, minimum temperature of the coldest month, and temperature seasonality contributed the most. This is indicated by the dark blue bars in the Jackknife of Test gain (Figure 4A). These variables have the most useful information when the simulation is run with each of them alone.
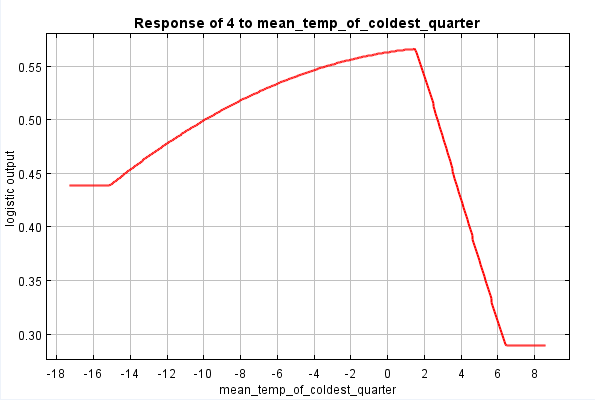
A more in-depth investigation of the variables is done with the response curves, which records the logistic output of a variable based on the value of its response. For example, the response curve of the best performing variable, mean temperature of the coldest quarter, shows the range of values where the variable predicts best, which is between -4 and 2 degrees Celsius (Figure 4B).
Overall, Model 4 performs somewhat satisfactorily in its accuracy of predictions: the AUC status of test data yielded .736 (Figure 4C). This is in line with the AUC accuracy of Model 3.
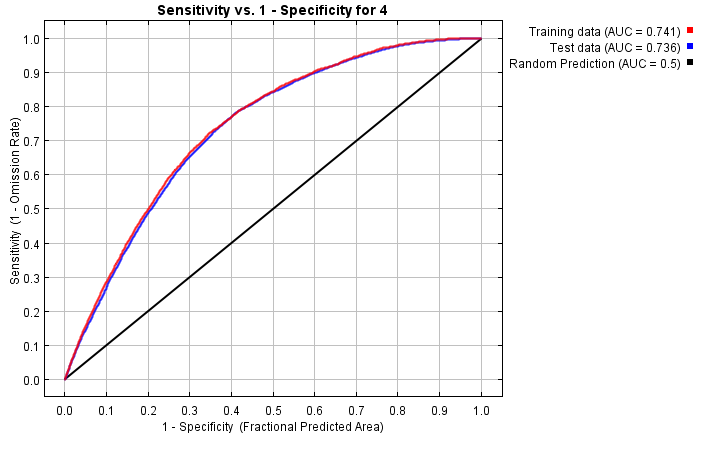
Figure 4D, which is an image of the clamping output, shows where the prediction is most affected by variables being outside their training range, while projecting the present environmental variables onto the 2050 variables. Warmer colours show areas where the treatment of variable values outside their training ranges are likely to have a large effect on predicted suitability (Phillips, 2017). 2050 variables outside their training ranges in western Minnesota, Rhode Island, Connecticut, New Jersey, Maryland, Delaware and Virginia are unlikely to have a large effect on predicted suitability. Variables outside their training areas in Maine, New Hampshire, Vermont, Wisconsin and Massachusetts are more likely to have an effect.
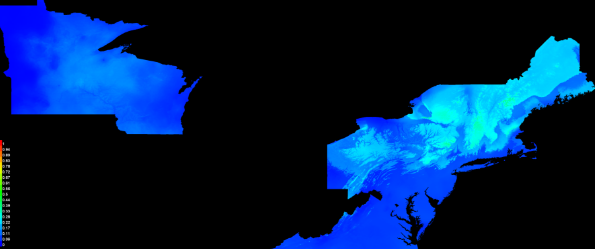
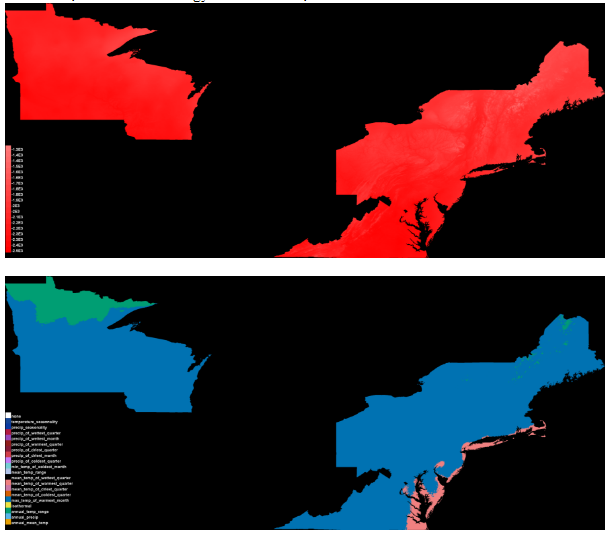
Figure 4E compares the environmental similarity of variables from 2050 to variables from present conditions used for training the model. In the first picture, areas in deep red have one or more environmental variables outside the range present in the training data, so predictions should be treated with caution. Areas in Maine, Vermont, New Hampshire and New York have 2050 environmental variables within range of present variables, so their predictions are to be more trusted.
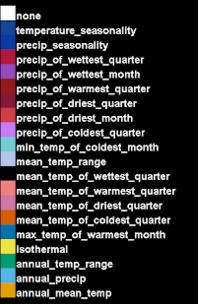
The second image shows the most dissimilar variable across area. Temperature seasonality, annual temperature range, and mean temperature of the warmest quarter are the variables which are most dissimilar.
Overall, Model 4 performed satisfactorily, although predictions projeced to 2050 in a significant proportion of the study area should be treated with caution. The model also indicates that there will be somewhat drastic changes in some of the best performing variables, suggesting that areas suitable for tick habitats are likely to shift.
Next section: Limitations