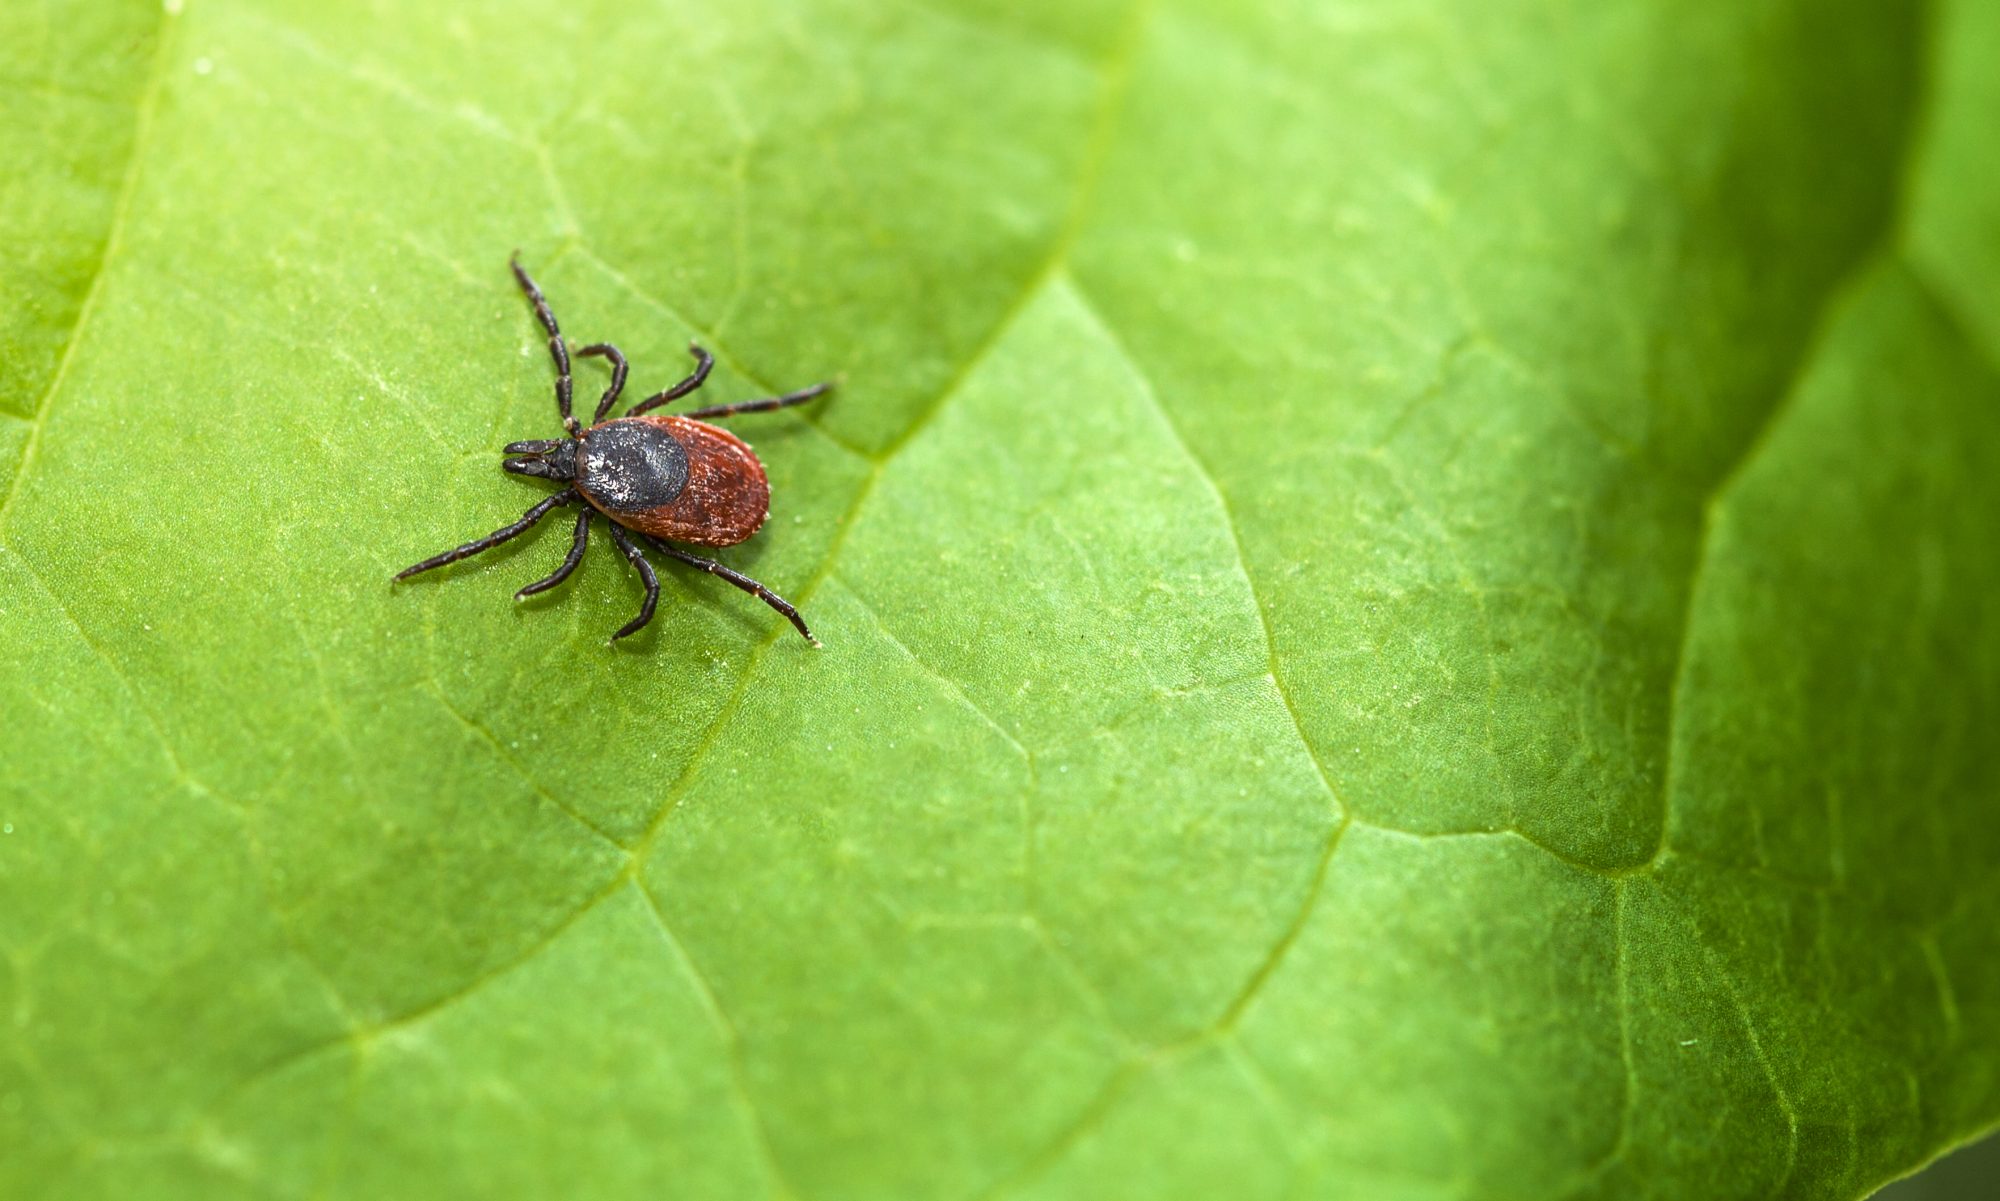
Our final output predicting suitable habitat zones for present tick populations, and therefore areas of greater risk potential of contracting lyme disease, evolved through three progressive stages, each represented by a model. Each model improved output by including additional data, excluding data found to have little contribution, and our decision to involve other fields of predictive data. Our prediction of areas with greater potential for ticks is extrapolated to 2050 in our model incorporating future climate predictions.
Model efficiency was ranked by its area under the curve (AUC) output, which represents the probability that a random presence point will be ranked above a randomly chosen background site (Phillips et al, 2006). Variable contribution was assessed using Jackknife tests, and response curves display the logistic output as a function of changes in the variable’s value.
Next section: Model 1
