Model 3 explores how incorporating a host variable along side the previous variables would change the results. The new variable is deer populations; as ticks has limited mobility, they rely on larger hosts to disperse upon a wider area. Along with proving a food source, deer populations act as transportation for ticks. In this analysis, the previous variables of climate and vegetation from Model 2 are mostly kept the same to ensure consistency. Through the results, mean temperature of coldest quarter continues to be the dominant factor in suitable tick habitat areas (see Table 3A). Host populations fall in the middle in terms of the variable’s overall contribution to the model, while vegetation seems to play a very small role in this model.
Table 3A: Model 3 Variable Contribution
| Variable | Output Name | Percent Contribution (%) | Permutation Importance (%) |
| Mean Temperature of Coldest Quarter (C⁰) | mean_temp_of_coldest_quarter | 52.8 | 10.8 |
| Ecological Regions | ecoregions | 12.2 | 19.4 |
| Isothermality (C⁰) | isothermal | 9.2 | 1.8 |
| Seasonal Temperature (C⁰) | temperature_seasonality | 5 | 6.3 |
| Annual Mean Temperature (C⁰) | annual_mean_temp | 5 | 13.5 |
| Precipitation of Coldest Quarter (mL) | precip_of_coldest_quarter | 4.5 | 10.5 |
| Precipitation of Wettest Quarter (mL) | precip_of_wettest_quarter | 2.8 | 5.2 |
| Deer Population Density | deer_density | 2.5 | 5 |
| Precipitation of Driest Quarter (mL) | precip_of_driest_quarter | 1.6 | 2 |
| Maximum Temperature of Warmest Month (C⁰) | max_temp_of_warmest_month | 1.5 | 3.3 |
| Minimum Temperature of the Coldest Month (C⁰) | min_temp_of_coldest_month | 1.1 | 4.7 |
| Mean Temperature of Wettest Quarter (C⁰) | mean_temp_of_wettest_quarter | 0.9 | 0.6 |
| Seasonal Precipitation (mL) | precip_seasonality | 0.4 | 12.5 |
| Mean Temperature Range (C⁰) | mean_temp_range | 0.1 | 1.6 |
| Deciduous Tree Cover | deciduous | 0.1 | 0.6 |
| Annual Precipitation (mL) | annual_precip | 0.1 | 1.6 |
| Annual Temperature Range (C⁰) | annual_temp_range | 0 | 0 |
| Tree Cover | tree_cover | 0 | 0.2 |
| Herbaceous Plant Cover | herbaceous | 0 | 0.1 |
| Precipitation of Warmest Quarter (mL) | precip_of_warmest_quarter | 0 | 0.2 |
| Mean Temperature of Driest Quarter (C⁰) | mean_temp_of_driest_quarter | 0 | 0 |
| Mean Temperature of Warmest Quarter (C⁰) | mean_temp_of_warmest_quarter | 0 | 0.2 |
| Shrubs | shrub | 0 | 0 |
| Precipitation of Driest Month (mL) | precip_of_driest_month | 0 | 0 |
| Precipitation of Wettest Month (mL) | precip_of_wettest_month | 0 | 0 |
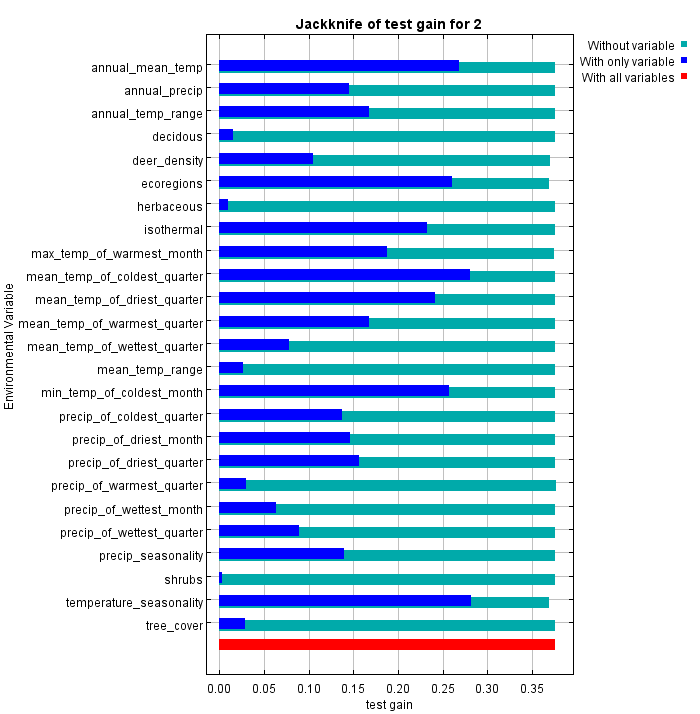
While Table 3A shows the percent each variable contributes when working with other correlated variables, the jackknife results show how the variables fares on its own (see Figure 3A). Like Model 2 and unlike Model 1, the jackknife output agrees with the tabular results. This is probably due to the higher accuracy rates in Models 2 and 3 as compared to Model 1.
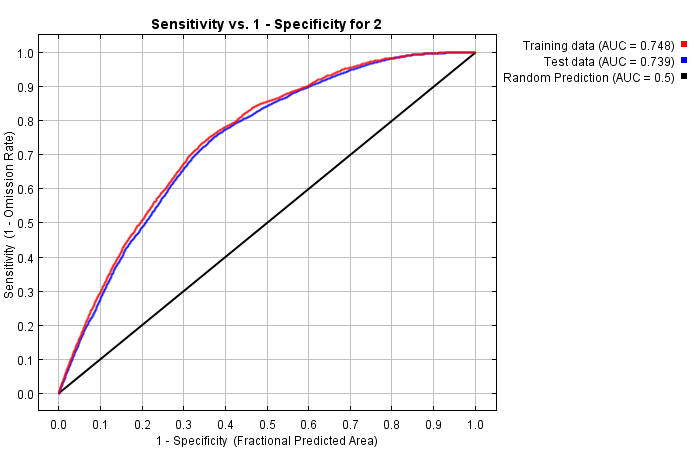
Model 3, similar to Model 2, has a accuracy of 0.739 (or 74 percent), as determined by the area under the curve (see Figure 3B). It shows that while host populations are a variable in tick populations habitats, it does not seem to be a large factor. It neither improves the accuracy of the model, nor is a top contributing variable.
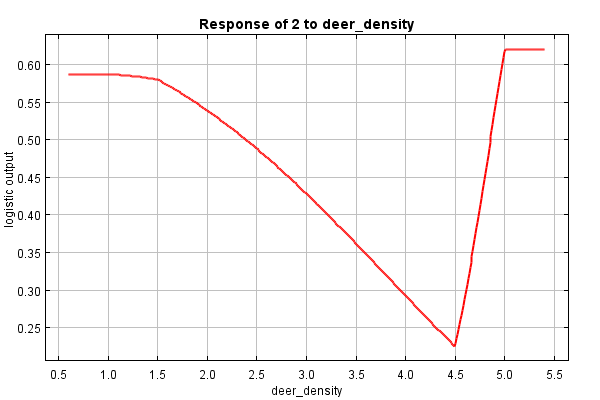
Peak deer density results in a logistic output of 0.62. Which is twelve percent lower than the accuracy yielded from the overall model. Based on the given information, tick populations do best in environments with values of 1.5 or lower in deer density or 4.58 and higher (see Figure 3C). The former value threshold could be due to the disturbance that the deer cause in tick habitats, while the latter value could be because deer provide a readily available supply of sustenance. However, it is unusual that any number between the upper and lower threshold would cause a decrease in tick habitability.
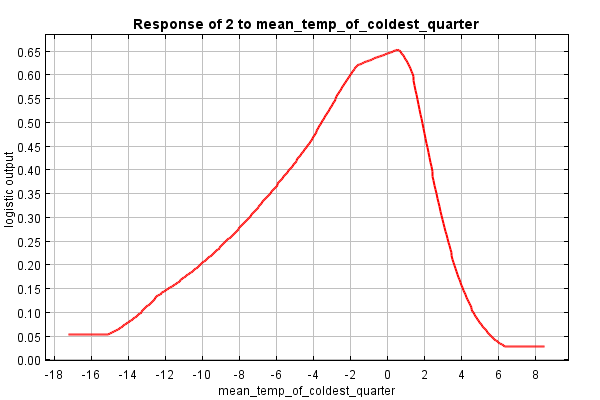
Unlike the lower contribution of deer density, the mean temperature of the coldest quarter continues be a key variable in predicting tick habitat locations. Figure 3D shows that temperatures between 2 to -2 degrees Celsius are ideal for ticks, producing an accuracy of up to 65 percent. The output graph shown below is actually identical to the one produced in Model 2 (see Figure 2C). This consistency emphasizes the accuracy of the results in terms of this particular variable.
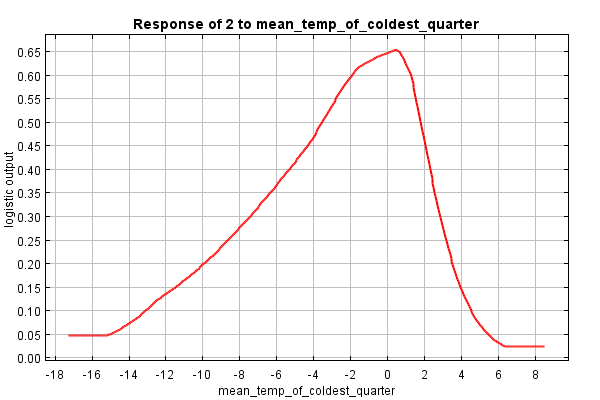
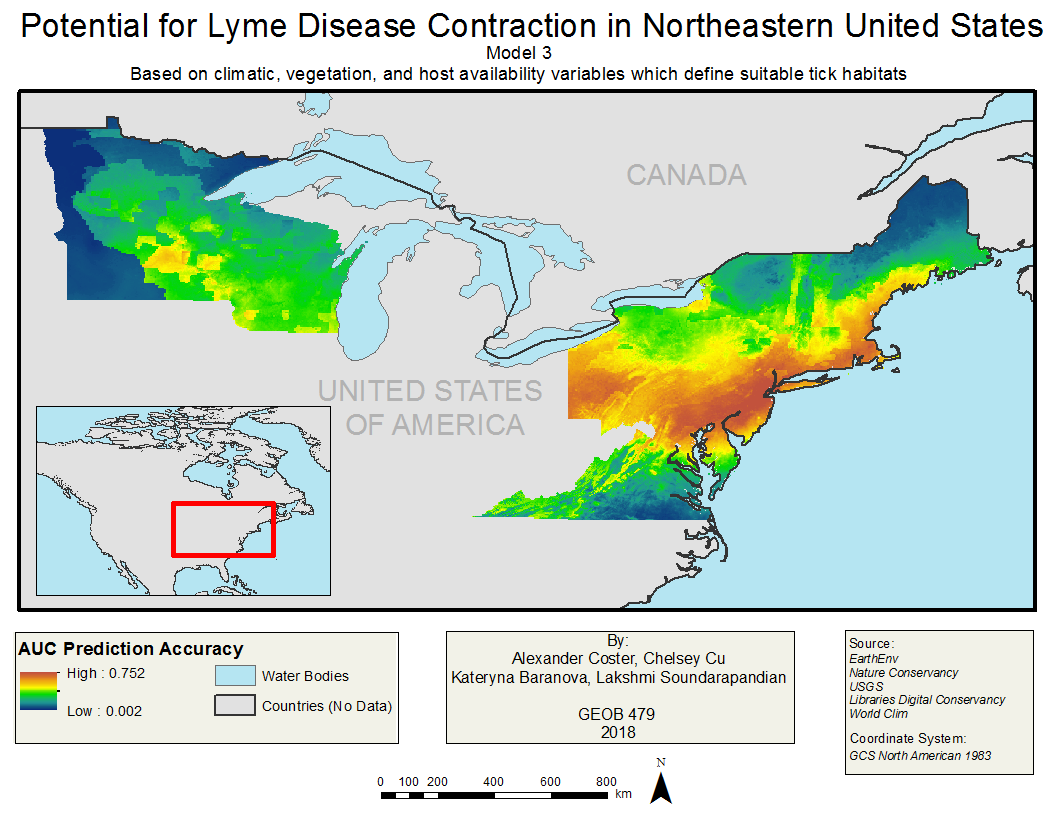
Figure 3E shows the output map made from Model 3. The results are very similar to that of Model 2 (see Figure 2G). This further confirms that the presence of deer populations has little effect on tick habitats. Tick populations remain dominant along the northeastern coast of the United states and seem to move inland in a horizontal line. This is probably due to the similar climate that is common at that latitude.
Through the three models, it has been confirmed that climate, and more specifically temperature, plays a large role in identifying the areas that are suitable for tick populations. With this in mind, climatic variables from the present can be used to extrapolate how global climate changes will affect Lyme disease.
Next section: Model 4