The goal of this analysis was to find locations in Metro Vancouver where it would be suitable to plan and build NOTVs. Using data on trailhead locations, land-use, transit routes, and urban containment boundaries, I performed a multi-criteria evaluation using the Suitability Modeler tool in ArcGIS Pro. With a mix of factors and constraints, I found 3 areas where NOTVs could be implemented.
Finding the Edge
Since a NOTV must be situated near the edge of the region, the first step was to define where exactly the “edge” lies. This spatial problem is more complex than it seems, especially in a place like Metro Vancouver, where geographical features like rivers, mountains, and flood plains divide the urban area into several discontinuous pieces. Metro Vancouver has an Urban Containment Boundary, which sets a limit to how far the city can expand. However, this boundary consists of separate polygons with space in between. Thus, if it was used unmodified in the analysis, there would be spots in the centre of the region that would qualify as the edge. To overcome this, I filled in these gaps to create one continuous polygon using the ‘Aggregate Polygons’ tool. The resulting polygon represents the urban area of Metro Vancouver. I then transformed this polygon into a polyline and created a 2km buffer.

Click here for a full-sized map.

Click here for a full-sized map.
This buffer is a proxy for the edge of the region. However, since the buffer was created using the modified urban containment boundary, I wanted to remove the parts that were interpolated during the aggregation process. To remove the interpolated areas from the buffer, I intersected it with the original Urban Containment Boundary, resulting in the light blue area seen below. This area acted as an inclusionary constraint in the suitability model.
 Click here for a full-sized map.
Gathering the Trailhead Data
After some searching, I could not find any publicly available shapefiles of trailheads near Metro Vancouver. Vancouver Trails provides the locations of trailheads on a map on their website, but not in an exportable format due to legal reasons. However, they do provide driving directions to each trailhead, which includes the respective coordinates. I manually imported these coordinates into a custom map on Google Maps. The result was 78 unique trailhead locations, as seen below. I then had to export this as a KML file, transform it into a shapefile, and project it into NAD83 in ArcGIS Pro.

Google Maps
Within Walking Distance of Trailheads
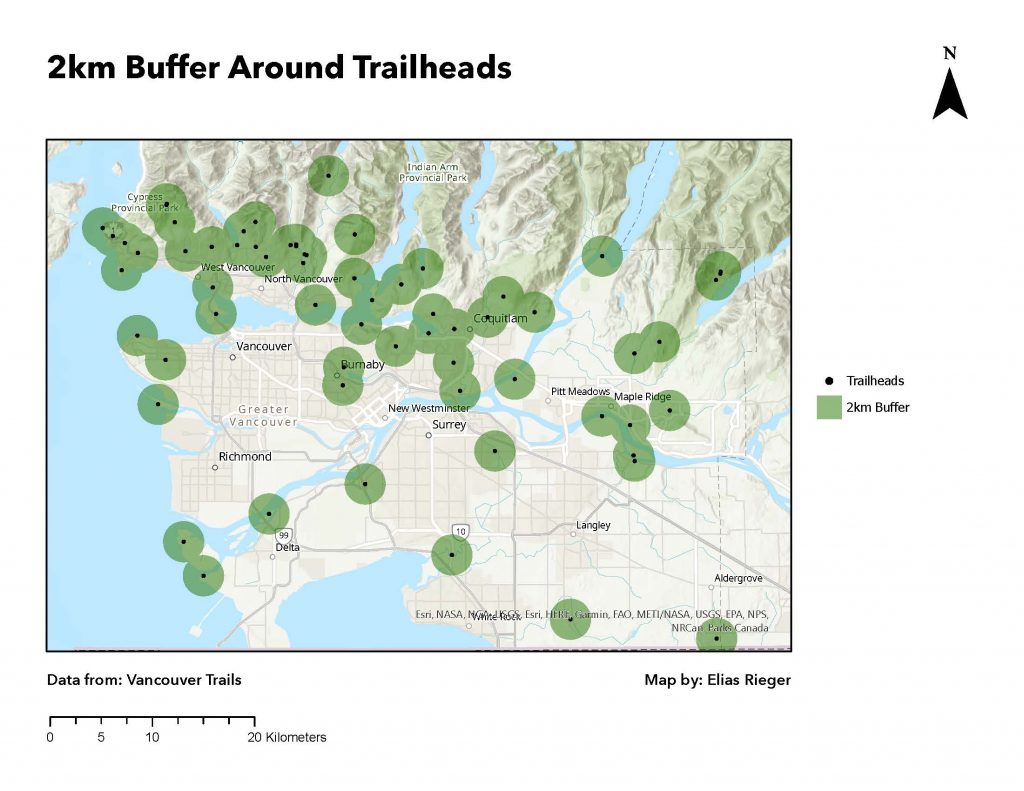
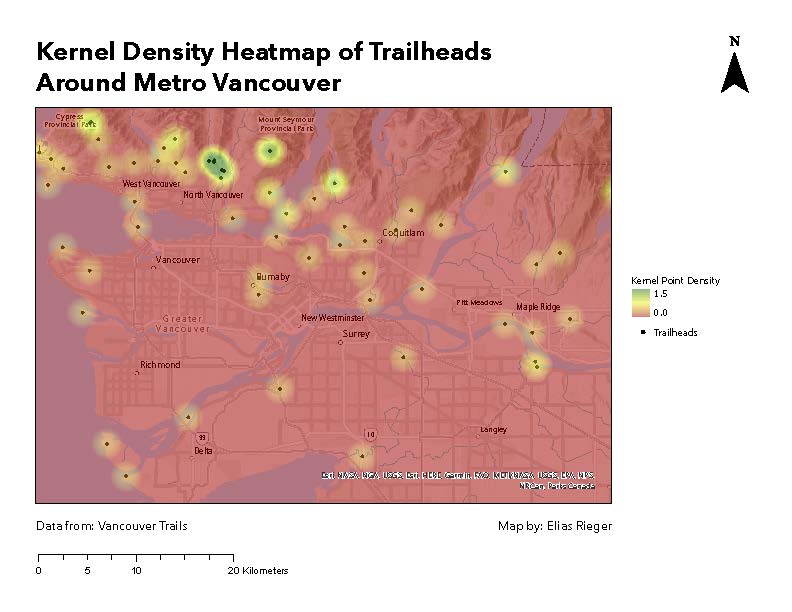
Another important characteristic of a NOTV is that the added density is within walking distance of a trailhead. To ensure this, I used a combination of a fuzzy factor and Boolean constraint. Since I was looking for areas that were about 4km2 in size (on average 2km x 2km), the edge of the NOTV could be about 2km away from a trailhead while still being adjacent. Taking this into consideration, I created a 2km buffer around the trailheads, which was used as an inclusionary constraint in the suitability model. I also used the ‘Kernel Point Density’ tool to create a raster heatmap of the trailheads, which acted as a factor in the suitability model. Thus, the 2km buffer acted as the maximum distance from the trailheads (Boolean), while the heatmap made sure that closer locations were preferred (fuzzy).

Click here for a full-sized map.

Click here for a full-sized map.
Land Use Considerations
When looking for areas to plan NOTVs, I felt it was important to take into account existing land use. Creating an NOTV would involve building new residential and commercial buildings, which cannot happen on just any type of land. Specifically, I wanted to exclude the following land uses from consideration: agricultural land, airports, cemeteries, hospitals, schools, and industrial areas. With Metro Vancouver’s standardized land use data for all municipalities within the region, I selected these attributes and created a new layer. The resulting shapefile indicated areas that are not suitable for building new mixed-use developments. This was taken into account as an exclusionary constraint and can be seen below in red. This figure provides an overview of both inclusive and exclusive constraints in the suitability analysis.

Click here for a full-sized map.
Distance to Rapid Transit
Typical Transit-Oriented Development (TOD) emphasizes the importance of having most of the density within 500m of “high capacity rapid transit stations”. A Nature-Oriented Transit Village differs slightly from this approach, with the primary focus being proximity to nature. Thus, while NOTVs wouldn’t necessarily need to be within walking distance of a rapid transit station, it is still crucial that NOTVs are accessible by frequent bus service at the very least. Additionally, it would be ideal if the buses that service the NOTVs connect to rapid transit lines.
I used data on the locations of rapid transit stops from TransLink to create a raster map with the ‘Euclidean Distance’ tool. While this doesn’t directly measure current transit access, it suffices as a measure of potential for transit access. The first assumption here is that the closer a location is to a rapid transit station, the easier it is to connect the two with a bus line. The second assumption is that, as areas are densified, the bus routes connecting those areas can be enhanced by adding more frequency and implementing transit priority measures. This is similar to what is happening with the new Fraserlands development in South Vancouver. While it did not have good transit access before, as the neighbourhood grew up to 15 000 residents, new transit service was introduced. With these assumptions considered, I used proximity to rapid transit stations as a factor in the suitability model.

Click here for a full-sized map.
After inputting the factors into the Suitability Modeler, I had to normalize them to a scale of 1 – 100. I used MS Small to transform distance to rapid transit, since smaller distances were preferred. On the other hand, larger density values were preferred with the trailheads heatmap, so I used MS Large. Before running the model, I weighed both of the factors at 50% and implemented the constraints as a mask in the ‘Environments’ tab.
