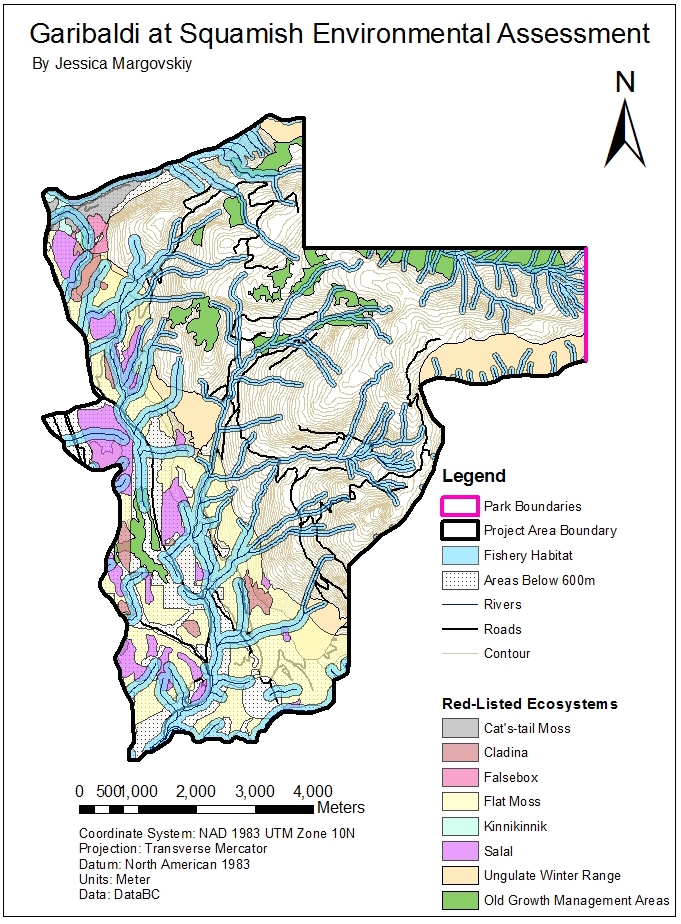
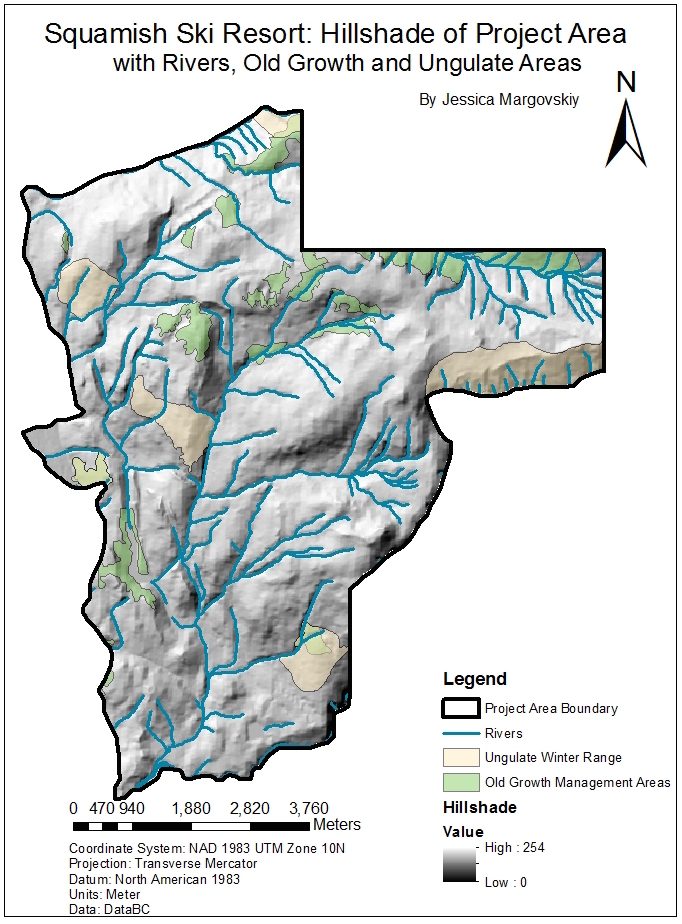
Accomplishment: In order to assess the effects of the development of a Squamish Ski Resort on various red-listed ecosystems and fishery habitats, I independently acquired spatial datasets online, parsed and filtered data and represented it in a way that was easily readable for the viewer. In order to only assess data within the boundaries of the project areas, I used the “Clip” feature on both vector and raster data.


Click to view the pdf versions of Garibaldi at Squamish Environmental Assessment, and Hillshade of Project Area.
Memo:
Dear Client,
I am a natural resource planner for the Garibaldi at Squamish project, a proposed year-round destination mountain resort located on Brohm Ridge. After intensive research, I have uncovered a list of high-order and low-order priorities that must be withheld before going through with this major development. I would like to guide you through my analysis process, using a series of steps that resulted in the maps seen here. I followed the basic steps to producing a GIS analysis as seen in Ben Fry’s visualization analysis:
Step 1) Acquire: I acquired government data from DataBC, which provided me with information on old growth management areas for forests, rivers, roads, elevation levels, habitats for ungulate species which I could then manipulate to showcase data relevant to the purpose of this project.
Step 2) Parse: I then provided some structure to my data by categorizing it, and by creating consistent file paths using the ArcGIS Geodatabase.
Step 3) Filter: Then, in order to only represent relevant data of interest, the Clip tool was used on the park boundary to remove any excess parts outside of the area of interest.
Step 4) Mine: I then used ArcGIS analysis tools such as Reclassify to determine the feasibility of building the ski report. By doing so, I was able to answer important questions for my analysis such as “will there be enough snow as calculated by elevation?” and “how much of the proposed resort area fall within red-listed species? Ungulate range areas?” etc.
Step 5) Represent: I added all of these layers to ArcMap in an appropriate manner.
Step 6) Refine: I tried to simplify the map as much as possible so that the focus would remain on the questions at hand to make it clearer and more visually engaging. By isolating areas below 600m in elevation, or using the buffer tool represented only the species relevant to the extent of fishery habitats. Additionally, symbology features such as applying transparency to layers, and ensuring hues that made sense to the viewer (for example, rivers being represented in the colour blue, or old growth habitats being green, etc.)
Step 7) Interact: Finally, I manipulated the data to control what features were visible by merging all relevant layers together, and applying all necessary map features such as a legend and scale bar to eliminate any discrepancies. The following two maps attached are the end result.
The total sum of the project area is approximately 54717275 m2, and of this, about 55.82% (30543222 m2) of the project area falls in the protected areas. Of this amount, 6.78% impacts old growth forest, 7.89% impacts ungulate habitat, 24.83% impacts red-listed ecosystems such as Falsebox, Salal, Cladina, Kinnikinnik and Flat Moss, and 30.55% impacting fish, which altogether affect 70% of the project area that falls on the sum of the protected areas. 31.8% of the area is below 600 m.
In my opinion, two of the greatest environmental concerns that this project faces are the effects of development will reduce endangered species that fall under these project boundaries, as well as fish bearing streams and riparian streams that will also become destroyed and are critical to the ecosystem. The economic value that this project will produce may produce life-threatening effects to BC’s natural ecosystem, and it is best for it to be left alone. Plus the fact that the amount of these effected ecosystems fall in 70% of the project area, makes a large majority of this project space vulnerable to this change.
If this project continues to operate, building away from the river buffer areas can mitigate these concerns, in order to prevent the contamination of the crucial fish species within these areas. Another potential approach would be to only build above the 600m elevation areas. Nontheless, I remain firm in my belief that it is better, in regards to the economy, the environment and even local politics, to develop elsewhere.
Thank you for taking my findings into consideration, and I look forward to hearing from you.
Jessica
When working on environmental projects, you sometimes become involved in proposals that you do not ethically believe in. Do you personally think the project should be allowed to continue? Does this differ from what you wrote in your memo?
Personally, I believe that this project should not be allowed to continue, and this coincides with my opinion that is laid out in the memo above. However, because I have access to tools such as ArcGIS, I can provide visual evidence, supported by real-world data to support my case and hopefully allow for planners to stay re-thinking their decisions, sparking a conversation and creating a means of mitigating ways to alleviate the environmental impacts of this project.