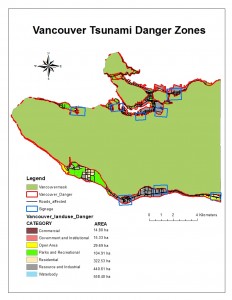
The City of Vancouver’s total area is 131020600.022758 m2, which can be found by opening the attribute table for Vancouver_landuse, then right clicking on Shape_Area, choosing Statistics and the value can be found under Sum.
The total area in danger in the City of Vancouver is 14862774.114046 m2 and is found using the same method, but instead opening the attribute table for Areas_affected.
Therefore the percentage of the City of Vancouver’s total area in danger will be: (14862774.114046 m2/131020600.022758 m2)*100% = 11.34%
Educational facilities within the City of Vancouver danger zone are:
- Emily Carr Institute of Art and Design (ECIAD)
- Henry Hudson Elementary
- False Creek Elementary
- St Anthony of Padua
- Ecole Rose Des Vents
- Health Care facilities within the City of Vancouver danger zone:
- False Creek Residence
- Villa Cathay Care Home
- Broadway Pentecostal Lodge
- Yaletown House Society
In order to determine the facilities affected first go to Selection -> Select By Location, choose Vancouver_health and Vancouver_education for target layers and Vancouver_landuse_Danger for source layer -> OK. Then right-click on Vancouver_health -> Data -> Export Data, choose export selected features -> OK and choose Yes to add the new layer. Then repeated the same for Vancouver_education. Deselect the original Vancouver_education and Vancouver_health for clarity, view the attribute table for each of the new layers, facilities affected will be listed under NAME.
![final project [Converted]](https://blogs.ubc.ca/katerynabaranovasgis/files/2016/04/final-project-Converted.jpg)