Visual Perception of Correlation
From Mario:
I’ll be discussing my work at the Visual Cognition Lab under Dr. Ron Rensink, where my team and I study the perception of correlation in visualizations. The purpose of this is two-fold. Using visualizations as a stimuli can help us understand how the visual system gets statistical information from scenes. Conversely, this understanding can lead to better visualizations by giving us rigorous ways to measure the effectiveness of a design.
For example, consider the pair of graphs below, each representing an identical set of age and height measurements for a group of individuals.
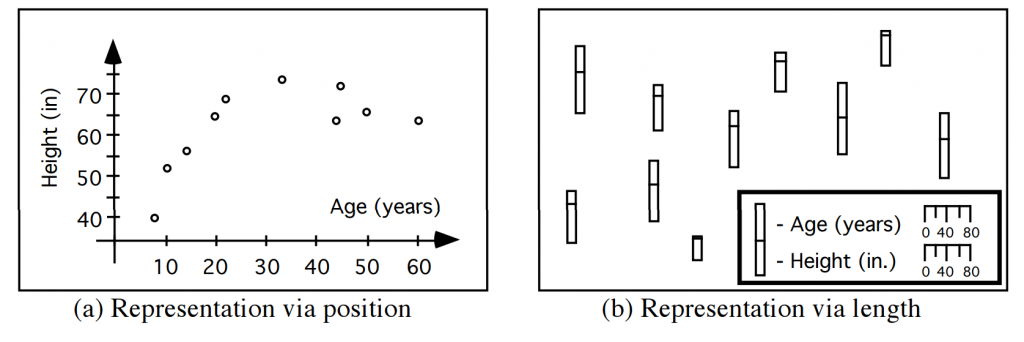
The graph on the left is clearly superior, revealing relationships that are invisible in the graph on the right. But we don’t really know why. As designers of visualizations, the best we can do right now is appeal to our intuition, to the “best practices” identified by our colleagues, or to the results of field studies.
While these methods may have worked well enough so far, they may not scale well as visualizations become increasingly complex and high-dimensional. In my presentation, I’ll show our research can eventually let us develop methods to judge visualizations from first principles.
Find out more about the research at the UBC Visual Cognition Lab.