by Simon Donner
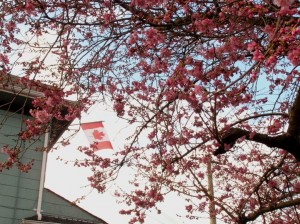
Cherry trees blossomed in Vancouver in early February during 2009-10 El Nino
Long-term forecasts say El Nino could be on the way.
This periodic climate warming of parts of the equatorial Pacific Ocean can affect weather around the world, often creating droughts and fires in Australia, Papua New Guinea and parts of Africa, heavy rains and flooding in California and parts of South America, and warmth across much of Canada and the northern U.S.
If you add it all together, forecasters often say El Nino years are unusually warm worldwide. The last strong El Nino event led to 1998 being the then-warmest year in recorded history.
Would the return of the mischievous brat of the climate system lead to a new global (surface) temperature record and an end to the “pause” in surface warming?
Not so fast. It could, yes. But not all El Nino events are created equal.
According to a recent study by my former student Sandra Banholzer and I, only “Eastern Pacific” El Nino events lead to global warmth. I’ll explain the difference.
Under normal or “neutral” conditions, winds blow from east to west across the equatorial Pacific. This causes the upwelling of cold water in the east that feeds the famous coastal fisheries of South America and the amazing marine life of the Galapagos.
Temperature anomalies, or departures from normal, with depth across the equatorial Pacific
Whenever these easterly winds slow down or stop, the warm water piling up in the western Pacific – and I mean literally piling up, as the ocean can be tens of centimetres higher – can slosh back eastwards. This slow, long, east-moving wave of warmth is called a Kelvin wave. For an example, the image at right depicts the current Kelvin wave using temperate “anomalies” across the Pacific.
In general, if the change in the winds is strong and persistent enough, the Kelvin wave or series of Kelvin waves will be really warm and powerful, enough to cut off the upwelling in the east and dramatically warm the Pacific all the way from the South American coast across the International Dateline. This is what happens in a classic “Eastern Pacific” (EP) El Nino, like 1997/98 or 1982/83 (despite all the excitement about images like the above, the current Kelvin wave is alone not enough to trigger such an event; there would need to be continued or further gaps in the easterly winds).
On the other hand, if the switch in the winds is short-lived or happens only in the western half of the Pacific, the surface warming will be restricted to the middle of the Pacific, around the International Dateline. Scientists have been calling these events “Central Pacific”(CP) El Nino or El Nino “Modoki”.
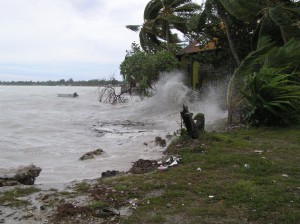
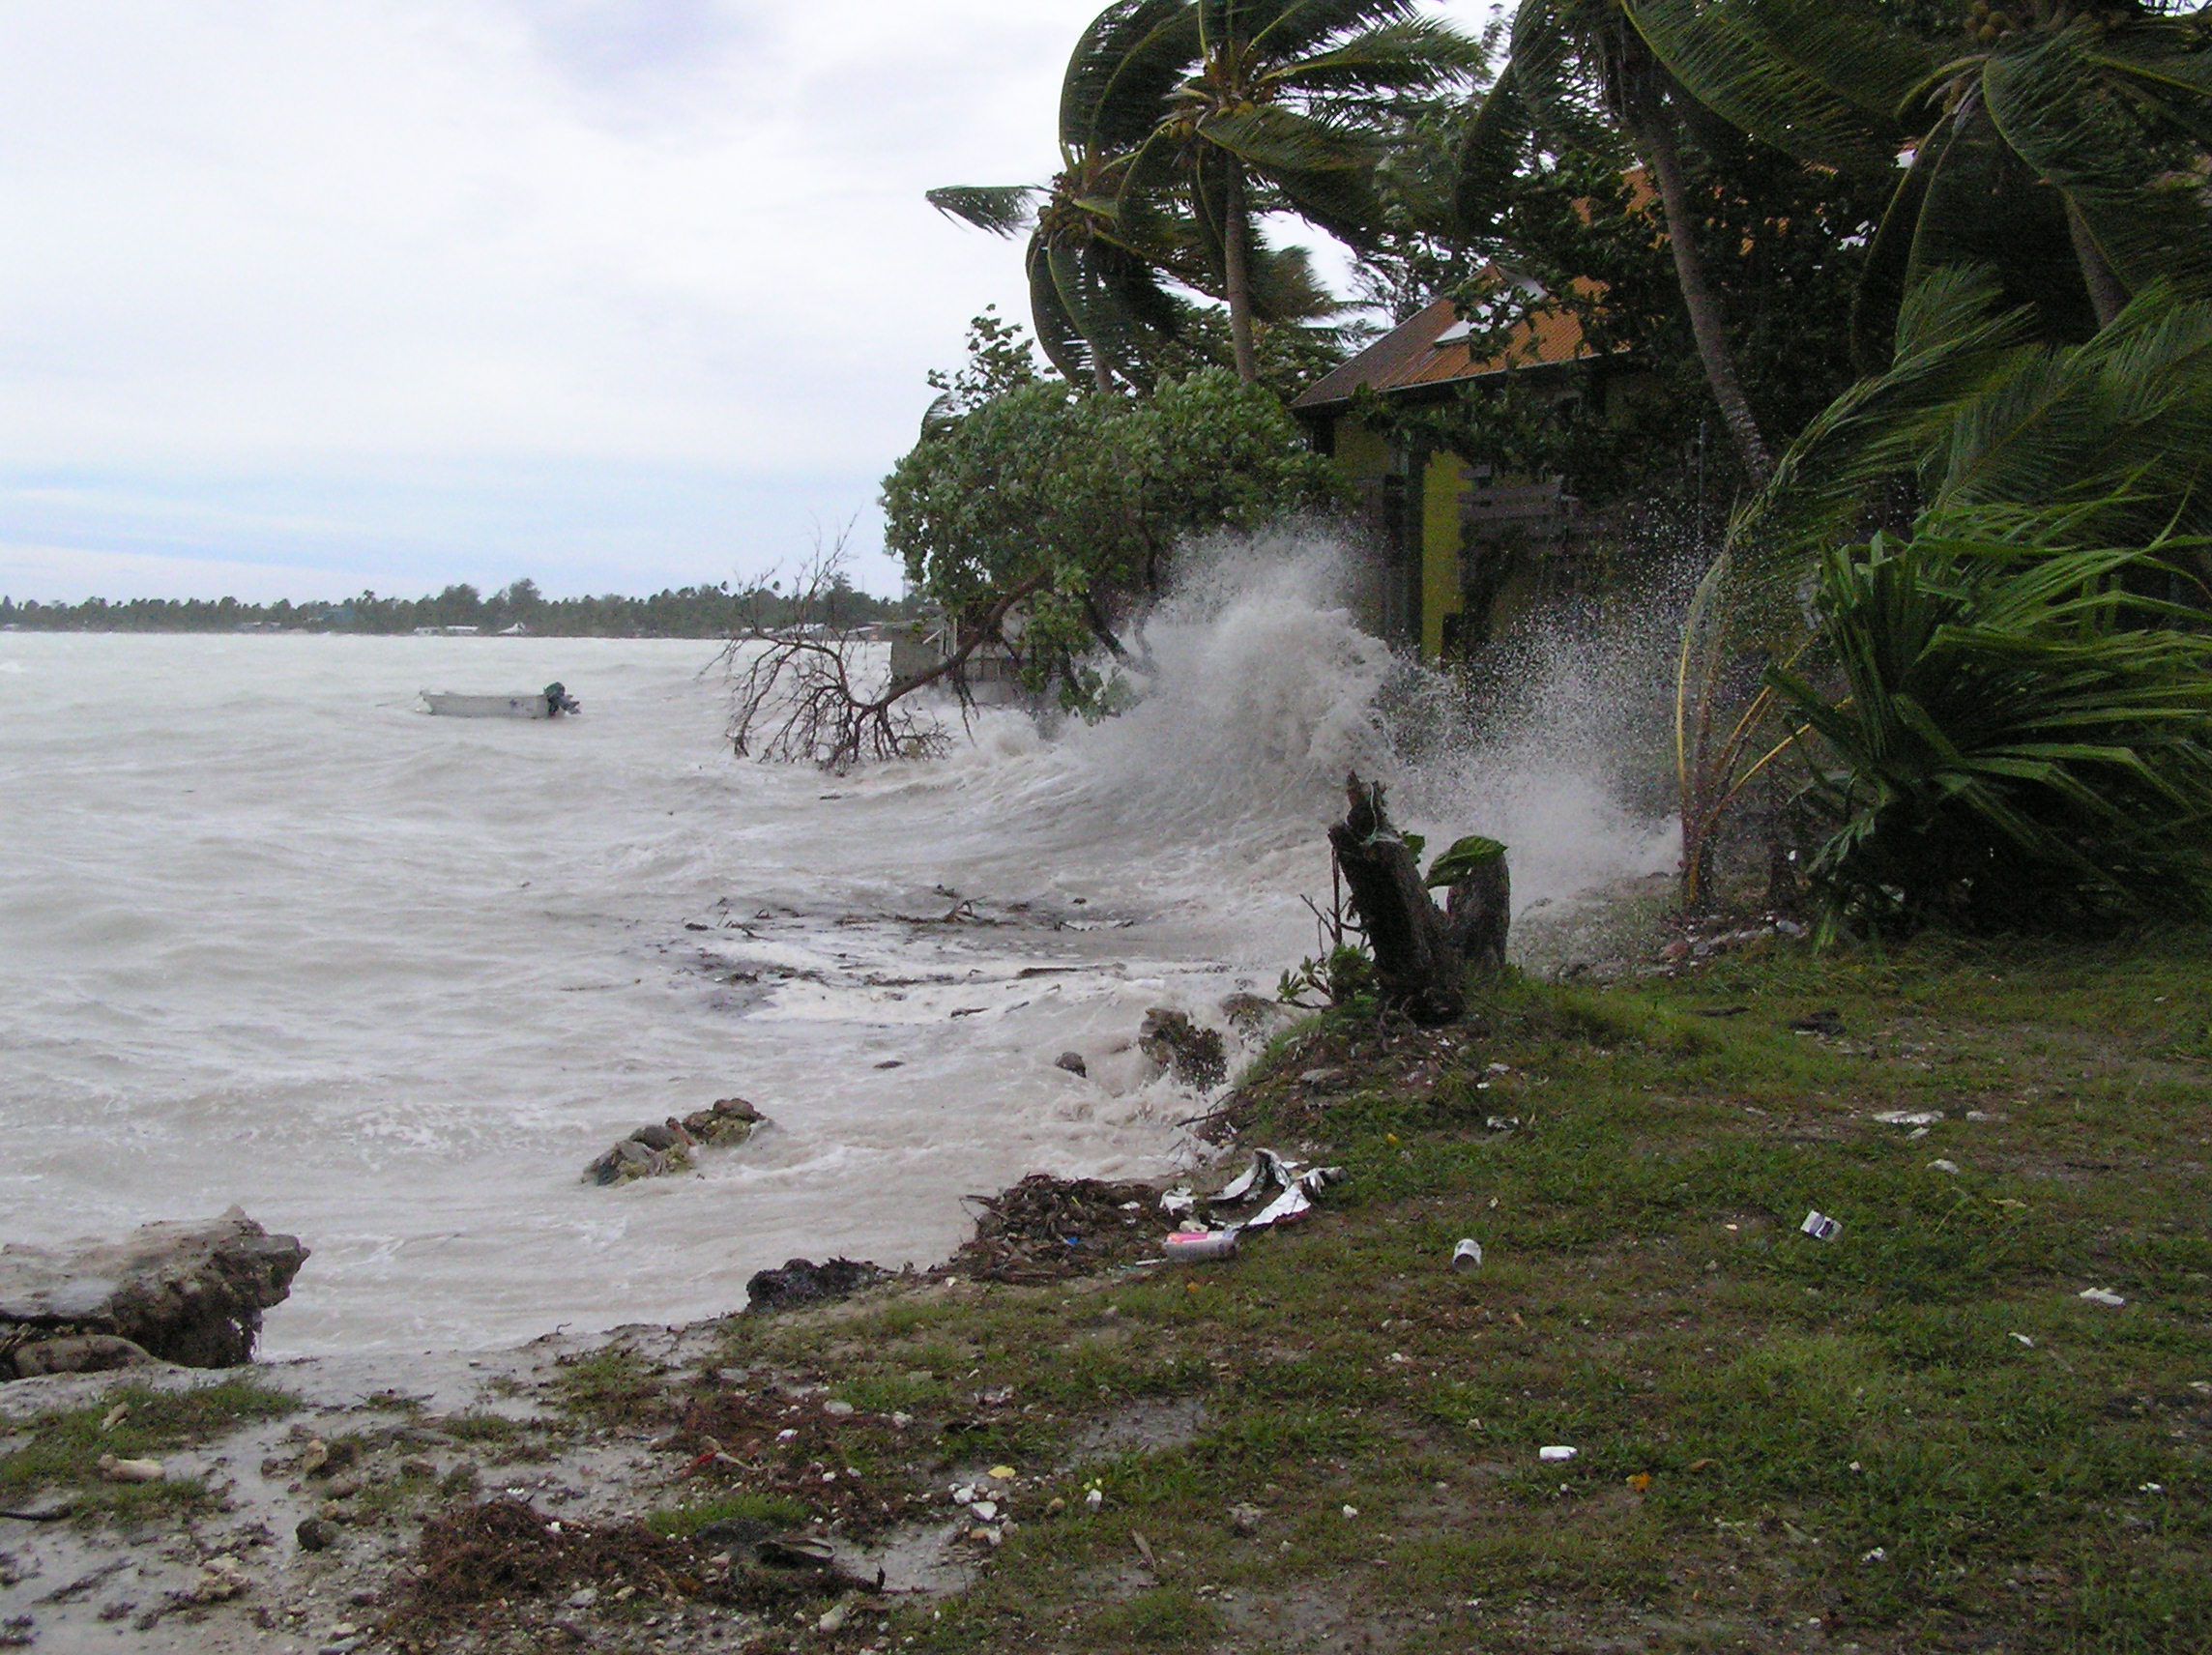
Full image from February 2005 storm in Tarawa
In fact, the header for this blog comes from a photo taken in Tarawa, Kiribati – right in the Central Pacific, 7 degrees west of the International Dateline – during the 2004/5 Central Pacific event. The elevated ocean temperatures caused bleaching of corals in Kiribati (pdf), and launched my field work. In the photo, you’re seeing a combination of high seas from the CP El Nino event, an El Nino driven westerly storm and a high tide blast the homes along the lagoon shoreline with waves.
The effects of an El Nino event on weather around the world (“teleconnections”) can depend on the type of event because of how the location and extent of abnormally warm Pacific waters affects the atmosphere. Our study showed that if you control for the other influences on global average surface temperature (like volcanoes and the human-induced trend), Central Pacific and “mixed” events are not unusually warm globally. Only the Eastern Pacific events affect the global average surface temperature.
This has important implications for the “pause” in surface warming. Over the past 10-15 years, the easterly winds have been abnormally strong, with few gaps sufficient to generate Kelvin waves. This is related to decade-scale variability in the Pacific Ocean conditions, called the Pacific Decadal Oscillation (PDO) or Interdecadal Pacific Oscillation (IPO).
It may then come as no surprise that all the El Nino events since 1998, including the 2009/10 event that made the cherries blossom early in Vancouver, have all been of the CP variety. The same happens to be true for other “slowdowns” in the rate of global surface temperature change since the Industrial Revolution. This suggests the decade-scale variability in the Pacific affects El Nino development, and in turn, the ups and downs in the rate of human-caused global surface warming. From the conclusion of our paper:
The current mean state of the Pacific tends to restrict wind anomalies and anomalous convection to the central Pacific, and hence favours CP rather than EP events [Xiang et al., 2012]. A shift in the mean state of the Pacific back to a warm phase in a few years may allow for globally warm traditional EP El Niño events to return.
Could this coming El Nino spell the end of the pattern?
It is simply too early to say for certain. There are some telling signs. For one, the change in upper ocean heat content over the past three months is similar to that of the last two Eastern Pacific events (1997/98, 1982/83). We should be careful about reading too much into those numbers. There are other years in which such a pattern in upper ocean heat content did not lead to an Eastern Pacific El Nino event.
Unfortunately, patience is not a virtue on the internet!
 presenting the findings to the public, subjective judgements had to made about which findings warrant mention. Yet this is what someone playing the honest broker would seek to avoid. A partial solution to this dilemma, suggested years ago by Stephen Schneider and discussed in
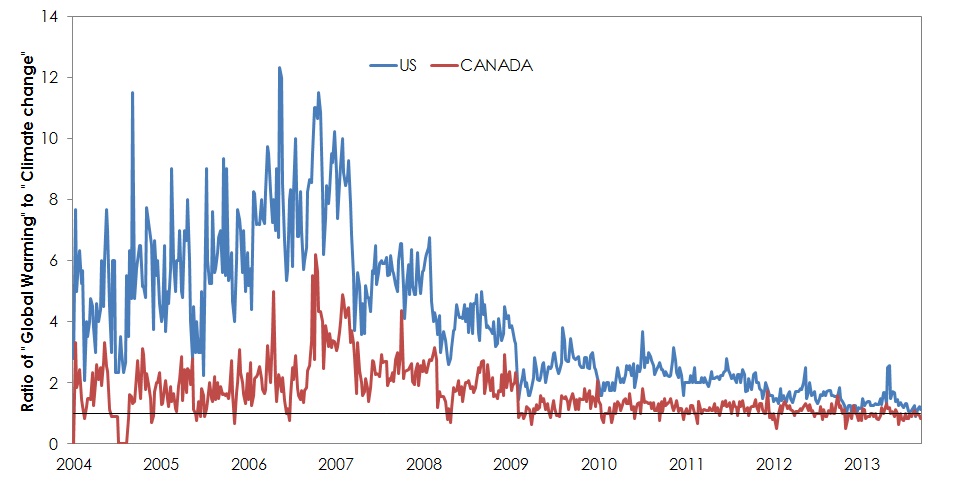
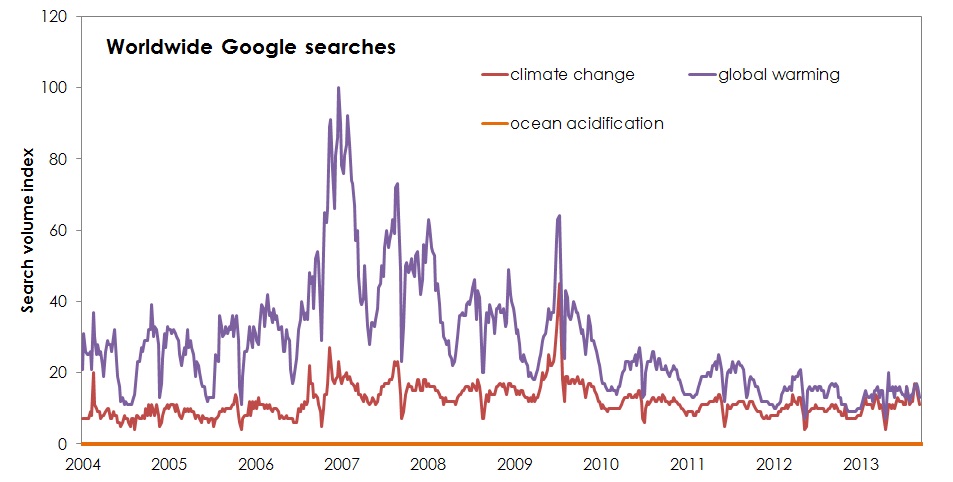
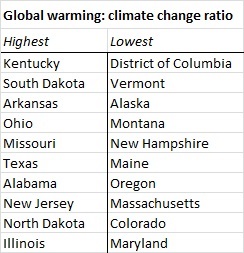 Washington DC is the only “state” where climate change is the preferred term, no doubt related at least in part to its use in government.