Kevin Zhang | MEL Candidate | Dec 17, 2021.
Mentor: Chris Li, Scall-Chem Co./ Datang International Power Generation
Abstract
The development of the wind power industry in this certain mountainous terrain can not only transmit electricity to the power grid, but also promote local economic development. This project takes a mountain wind farm as the research object, deeply studies the characteristics of wind resources in this region, providing theoretical basis for the site selection of mountain wind farm. According to the software mathematical model and calculation principle (using Wind energy industry-standard software, and RETScreen) the wind farm micro-site selection and unit optimization will be addressed, the wind farm financial analysis will also be included. After correction, the estimated annual energy production of WAsP (Wind Atlas Analysis and Application Program) simulation is about 140.16 GWh and the average AEP of single wind turbine is 8.24 GWh, the annual equivalent load hours are 2746.66 h, and the capacity coefficient is 0.314. The financial performance is also analyzed and results show that the construction of the project is conducive to the economic benefit which has 9.8% of pre-tax IRR-equity and 12 years of equity payback period.
Introduction
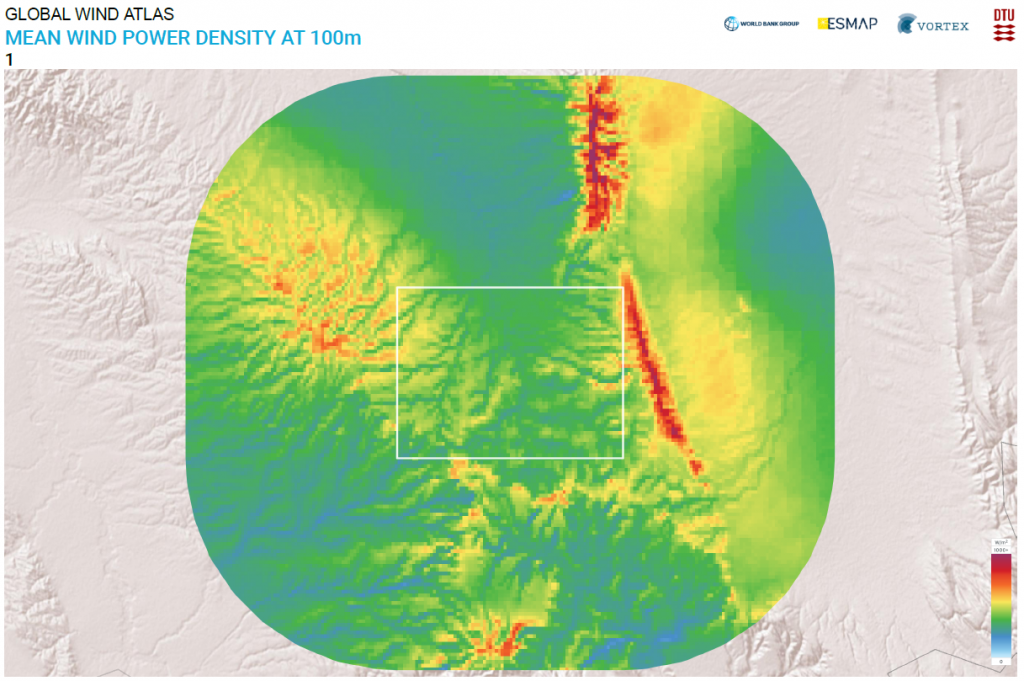
The development of China domestic wind power resources has lasted for more than 20 years. With the continuous development of domestic wind power resources, the potentially exploitable wind farm terrain becomes more and more complex. In recent years, the development of wind farms in China has gradually shifted from plain areas with abundant wind resources to mountainous and hilly areas, while mountainous and hilly terrain are subject to many restricted factors. To construct a wind farm, the first step is to choose an appropriate site. However, the quality of site selection resources is directly related to the output and economic feasibility of the wind farm . Experiences show that power generation loss and increased maintenance costs caused by the failure of wind farm site selection are far greater than the cost of detailed investigation of wind farm site. Therefore, wind farm site selection is crucial for wind farm construction.
Objective
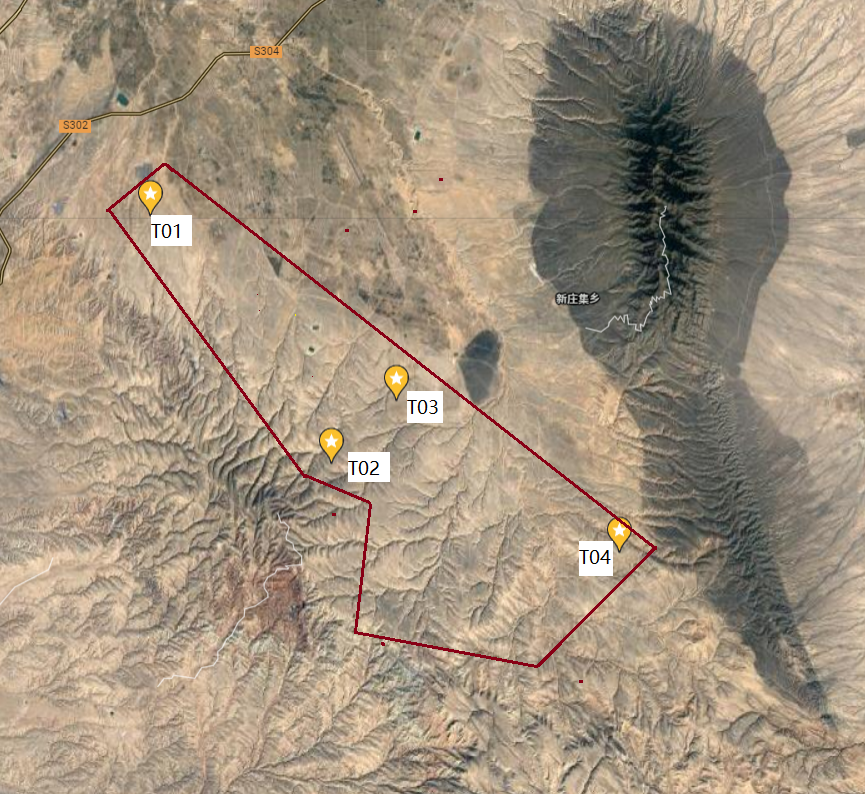
- Anemometer tower layout and data verification.
- Wind farm macro site selection. Build a mathematic model based on Weibull distribution.
- Wind farm micro site selection, energy production and financial performance analysis.
Methodology
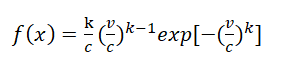
•Weibull distribution model
Weibull distribution model has the advantages of simple form and convenient calculation, which can better describe the distribution of wind speed and adapt to the frequency distribution of different shapes. Its probability density function is:
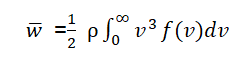
•Wind energy density
Wind power quantifies the amount of wind energy flowing through an area of interest per unit time. For wind turbines, wind energy density refers to the wind energy swept by the impeller per unit area:
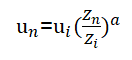
•Vertical wind shear
When the atmosphere is neutral, turbulence is generated solely by dynamic factors, and the variation of wind speed with height follows Prandtl’s turbulence formula:
•Wind turbulence intensity
Turbulence Kinetic Energy (TKE) is calculated as follows:
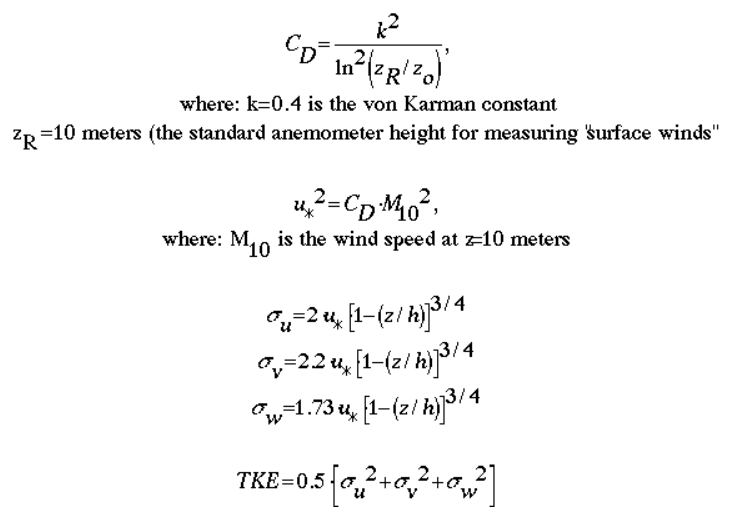
The turbulence intensity, also often refered to as turbulence level, is defined as: ,
,
where  is the root-mean-square of the turbulent velocity fluctuations and
  is the mean velocity
If the turbulent energy (TKE),  , is known can be computed as:
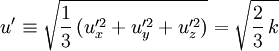
Results and Discussion
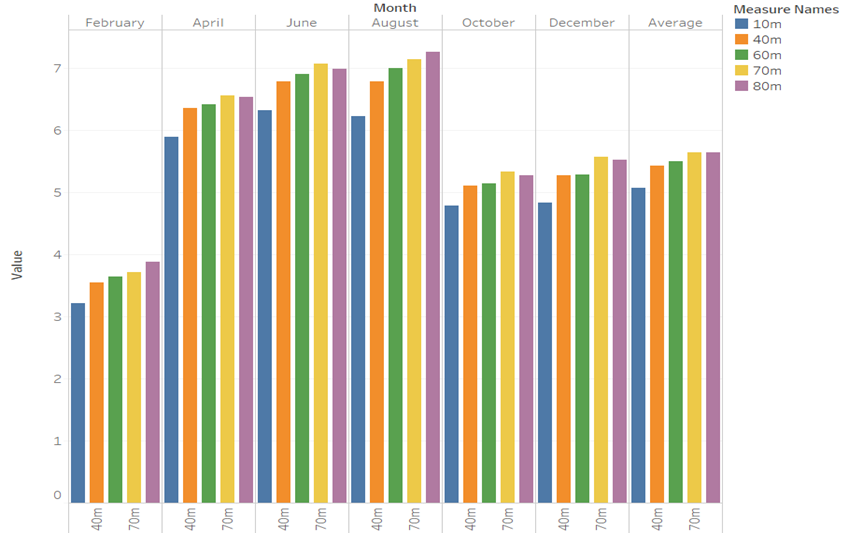
According to histogram Figure 1 of wind speed of tower in the center region, the wind speed of 80m ranges from 3.35m/s to 7.26m/s. The spring and the summer seasons are strong wind seasons. There is little change in wind speed in strong wind seasons, which is conducive to fan output.
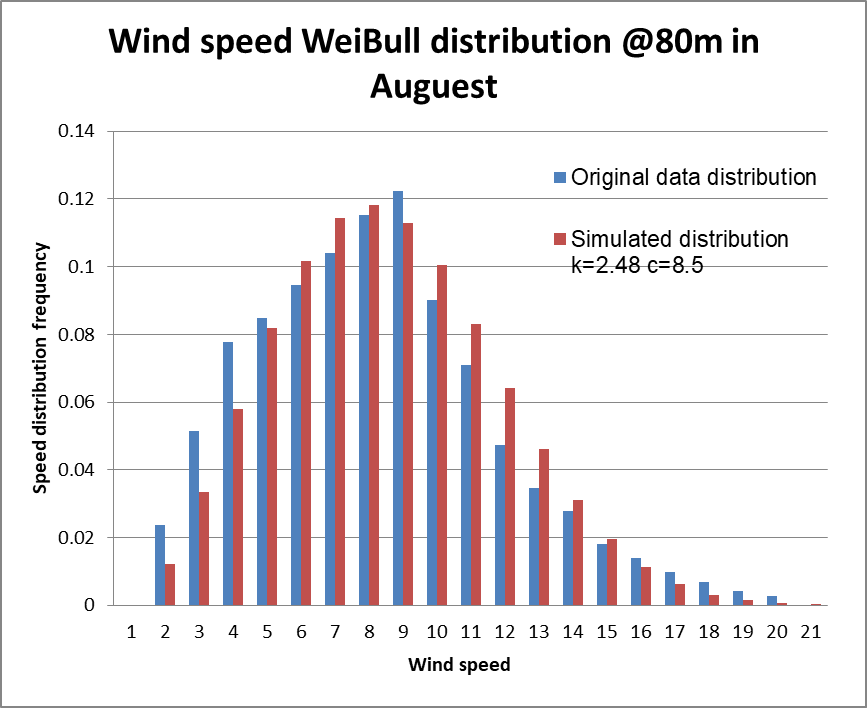
•Matching a Weibull Distribution to a Data Set in Excel
The results show the average wind speed (at 80m tower height) is about 7.26 m/s. The wind speed is mainly distributed in the range of 5 to 10 m/s ,which means it is conducive to build the turbine. Especially the wind speed of 7 to 9 m/s has the highest frequencies in August. Based on the simulation matching of Weibull Distribution to actual dataset, the results shows k=2.48 and c=8.5
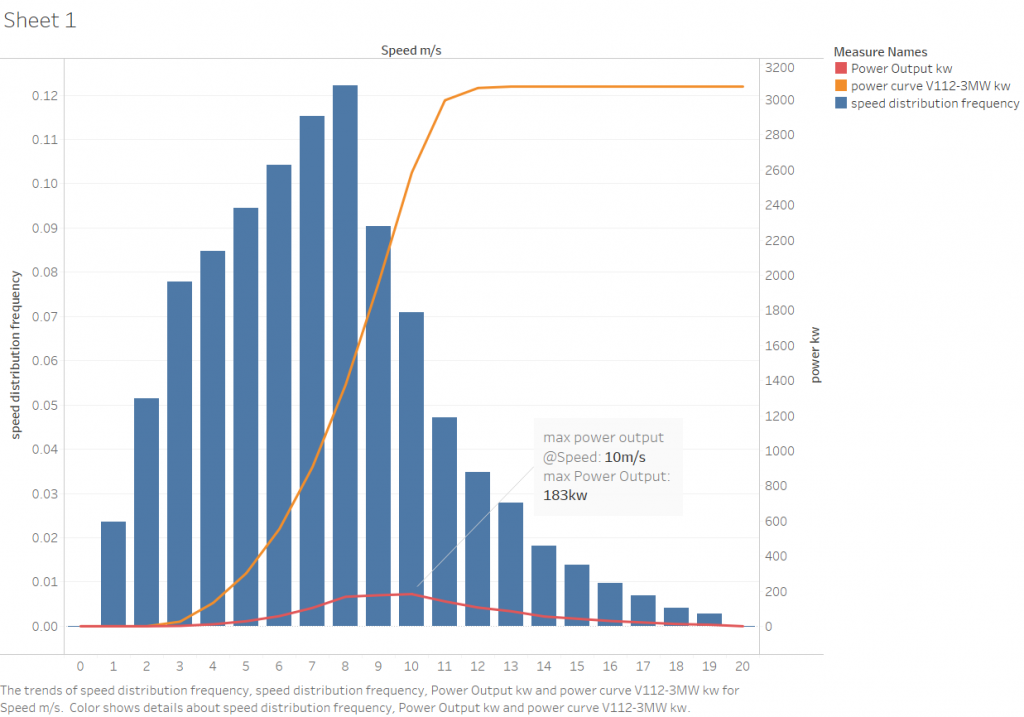
The wind speed distribution frequency and assumed wind turbine power curve (Vestas V112-3.0 MW ) are plotted . Based on the result, the selected turbine output maximum power at 10m/s wind speed. The estimated annual energy output is calculated to be 10.83 GWh.
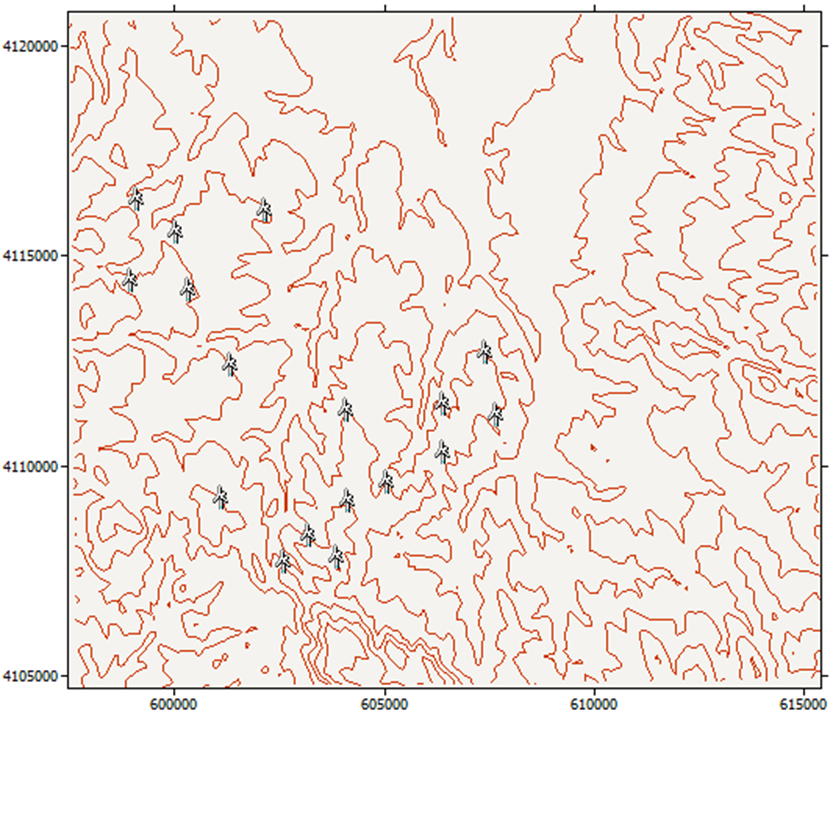
•Layout optimization and production simulation by WAsP
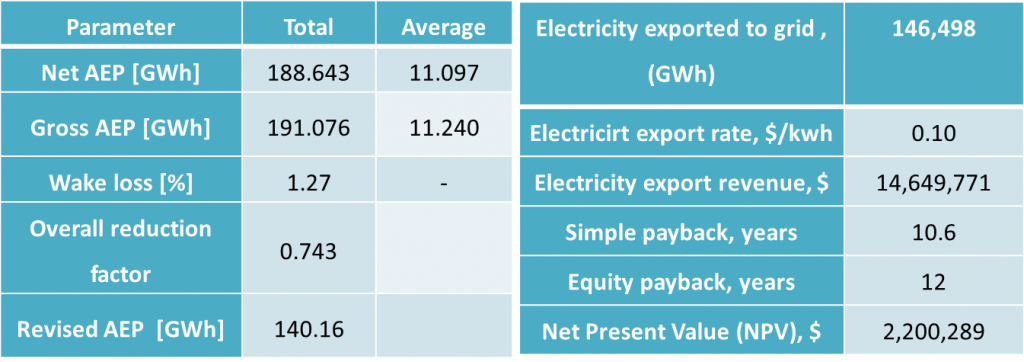
The simulation result shows total net Annual Energy Production (AEP) is about 188.64 GWh and average AEP of single turbine is about 11.097 GWh with about 1.27% wake loss.
•Comparison of WAsP and RETScreen
The revised AEP of the wind farm is about 140.16 GW·h and the average AEP of single wind turbine is 8.24 GW·h, the annual equivalent load hours are 2746.66 h, and the capacity coefficient is 0.314.
The simulation of RETScreen result shows that the electricity production is about 146.498 GWh which is quite close to the WAsP simulation result after correction (140.16 GW·h). the capacity factor is about 32.8%.
However, the selected production reduction factor is relatively subjective and the production loss of RETScreen simulation is also very general.
•Financial performance evaluation by RETScreen
Pre-tax Modified Internal Rate of Return (MIRR)– equity is about 9.4% which is higher than the after-tax benchmark IRR of project capital, which is 8% defined in ” Economic Evaluation Methods and Parameters of Construction Projects “. The Net Present Value (NPV) is about $2,200,289. Equity payback period is about 12 years including one year of project construction.
Conclusion
•Based on the analysis, WZ 50 MW wind power plant is estimated to produce about 140 – 145 GWh electricity annually.
•The equity payback period is about 12 years with 9.4% MIRR, which is profitable and conducive to local economy.
Contact

Kevin Zhang
Email: zfxhaixxx@163.com