
An Educational Financial Crisis
Introduction:
Should students be without access to important tools that could prove valuable to their future, should teachers have to forgo classroom activities due to large resource waiting lists and should administrators have to pick and choose between departments for projects to implement because there is not enough to go around if projects go beyond the basic needs and maintenance requirements for a school to be operational. Education should be visionary. Education should have systems in place that promote long term investments for a school’s development, rather than the simple short term expensing for maintenance purposes.
Underlying the Education philosophy in Canada are the issues of access and the obligation of government to provide equality of education to students regardless of family income. The current system’s values of meritocracy, equality, equity, multiculturalism and the liberal humanist notions of the individual are to be revered. However, the complex and diverse needs of society have put a strain on the resources required by education system to function well. An unnecessarily large part of this strain can be attributed to an unrealistic funding model and a heavy reliance on government funding for support.
The reality is that there is no such thing as a free education. The knowledge incurred reflects only one half of education’s equation, because at the end of the day there is another list of checks that need to be balanced regarding the substantially large incurred costs for the education being provided. With education’s costs soaring and the government’s relentless efforts to streamline them, financial problems exist within the Canadian K-12 education system; evidenced by the many public schools in need. In order for our graduates to remain competitive in the world’s markets it is important to understand the limitations exerted by a school’s budget and the funding policies that dictate the funds being procured and distributed to our schools. Insightful decisions regarding the funding model can be brought to fruition by aligning our idealized educational expectations to the reality that is unfolding in our classrooms. It is important to understand the ways in which government restricts and enables a school’s funding options. It is crucial to understand the financial dependencies that exist and ways to go beyond them. Like why this past decade has seen more private sector fundraising than the century before it. It is vital to establish what our education system needs and find ways to meet them. There are many unfortunate and unnecessary realities that exist within our education system, which may never be fully solved, but adequately alleviated through proper funding—public and private.
Overview:
This paper explores the quality of the job being done with respect to the development of our British Columbian K-12 education in order to find ways to make it better. There is always room for improvement in all we do and that process of transformation always begins within. To know what one has to work with in the process is crucial—Foundation. So is the idea of what one wants and where one wants to go—Vision. Only then, can steps be made to move in the desired direction—Mission. The foci of the paper are the financial considerations that play an intricate role in defining education. The desire is to obtain a better understanding of the funding of education in British Columbia, Canada—how funding works and what our funding is getting us? In particular, the K-12 public education sector.
The first aspect of evaluating the funding model deals with the expectations from education. For Canada to have a role in this emerging global village it must have an education system that is competitive due to the importance of education in defining the future of a nation. Since a nation is only as good as the people it rears, the education should be capable to provide the intellectuals and skilled labor required to guide and fuel the political and social-economic needs of society. In short, a system is desired that rivals other nations. Once our expectations are clearly mapped it is important to understand the role that funding plays in alignment. One aspect of funding is the flow of money within the education system—where the money comes from and where that money goes? Tracing the sources of revenue provided to education involves the allocation process and the funding policies behind it. By understanding the funding formula a person can assess the strengths and weaknesses inherent in its design. Lastly, part of the evaluation of the funding model involves understanding the impact of funding on the ground—the schools and school districts. By understanding the expenditures common to a school one can understand the reality being faced in the classrooms and the needs required. There is no better way to understand the impact of an education than on the students that receive it.
It is anticipated that once these three aspects of an education are understood, then through the process of reverse engineering, a person can work backwards to find ways to make improvements. The 6 stages of the literature review process involve:
- The Current Education Situation in Canada (According to World Rank)
- The Current Education Situation in Canada (Financial Perspective of World Rank)
- The Funding Model (Federal Perspective: Canadian Overview)
- The Funding Model (Provincial Perspective: British Columbian Overview)
- Canada-Wide Comparison of K-12 Funding (Provincial Perspective: British Columbia)
- Understanding the Impact of Funding at the Local Level (Schools & School Board Districts)
Problem Statement:
There are obvious problems within the British Columbian K-12 education system that need to be addressed. It is apparent that standards are falling and quality is slipping. In order to assess the direction of the future it is important to understand the current state of our educational affairs. It is the intention to look at the underlying financial support structure to better gauge our educational condition in terms of the operational and developmental aspects. Funding lies at the heart of financial support and represents all the revenue either derived from a source or for an object. Operational finances refers to the resources needed to keep the doors of a school open for a full year; anything required by the design of a school to ensure the execution, control and operations that convert resources into desired goods and services required by students to stay in school and learn. Operational resources are purchases made and expensed within the same year. Whereas developmental finances refer to the resources invested into a school for the sake of improvement or growth; any investment made in a year which is not consumed during that year is expected to have been purchased for the development of the school. The notion of development in this paper focuses on a schools ability to acquire tangible objects like supplies, furniture, equipment, tools and technology that are used by students in their programs and services.
Currently, it is believed that our schools are not able to operate within their budgets while effectively planning for tomorrow. It is expected that a holistic overview of the education system will help us align our expectations to the realities that exist and assess the extent to which schools are forced to operate within their budget. By studying the allocation of finances used in education from the municipal, provincial and federal government in conjunction with the expenditures being made at a school it is hoped to establish how the current funding model is impacting our schools.
Literature Review:
The Current Education Situation in Canada (According to World Rank):
The status of Canada in the international community with respect to the quality of its education system and what it delivers is usually ascertained through world reports and rankings. A global perspective of education establishes a tone of the direction and involvement in education by each nation and indicates areas of excellence and those that need improvement. For Canada, its education system overall has received a 7th place international ranking by the New Jersey Minority Educational Development (NJMED) agency for 2013. A spokesperson from NJMED also commented on Canada’s status in the report (New Jersey Minority Educational Development, World Top Education Systems, 2013):
Always a contender for a place in the top 5, Canada has one of the world’s
highest college graduation rates. The country still has not invested enough
time or resources to develop children before they enroll into primary
education. When they do, they could find themselves a top 3 ranking.
In another report, the Learning Curve 2012 Report, put out by The Economist Intelligence Unit in conjunction with Pearson ranked Canada 10th overall with respect to the global index of cognitive skills and educational attainment (44). Whereas the latest Programme for International Student Assessment (PISA) results from the Organisation for Economic Co-operation and Development (OECD) ranked Canada 14th in math, 12th in science and 9th in reading overall in the 2012 report.
According to these reports it appears that Canada’s education system is in good condition. However, contained in these reports are only half truths. There is only so much that a person can ascertain from a number on its own. More important than the absolute ratings are the trends behind them. These reports also indicate the dynamic nature of a nation’s education system and highlight the changes going on with insight why. According to these three reports Canada has not been improving, but consistently slipping in its ratings year after year. According to the New Jersey Minority Educational Development (NJMED) agency Canada is a 7, but has historically been in the top 5. The Programme for International Student Assessment (PISA) report in 2009 had Canada ranked three or four positions higher across the board: 10th in math, 8th in science and 6th in reading. According to the report, Canada was 1 of 10 countries (out of 64 countries with comparable data) that had deteriorated in its standings (The Guardian, Pisa 2012 results: which country does best at reading, maths and science? 2013). The fact that movement up or down in the rankings does not necessarily indicate a literal change in one countries position, but a relative change to others, means that more information is required.
To help understand if Canada’s education system is really deteriorating or if the gains made by the Canadian education system are falling short against the strides taken by other countries more indicators are needed. The learning Curve 2012 Report notes that funding is an important factor in strong education systems, but that a culture supportive of learning is even more critical. A fact reiterated by Pearson’s chief education adviser Sir Michael Barber, who said that countries which offer teachers a higher status in society and have a culture of education tend to be higher ranking (Huffington post, Best Education in the World: Finland, South Korea Top Country Ranking, U.S Rated Average, 2013).
The Current Education Situation in Canada (Financial Perspective of World Rank):
Common sense dictates that the success of a country’s education system depends more on how resources are invested than the amount invested. However, in this technologically advanced global village with the amount of information available at our finger tips it is hard to put a patent on public educational intellectual property and education system design. Especially when considering that people are very aware in regards to what everyone else is doing and working hard in trying to deploy methods and employ resources that will garner better results. This is why Educational spending remains an important indicator in evaluating the success of a particular education system. A common practice is to compare the educational spending of a nation to its gross-domestic product (GDP). This relative expenditure can be one indicator of the level of resourcing in schools. On a political level, spending can indicate the level of importance of education according to government policy makers. On a social level, funding, spending and financial support can give a fair indication of the culture and status of education in society.
The United Nation, UNESCO and the World Bank share the same data for a country’s public expenditure on education as a percent of gross-domestic product (GDP). The data represents education as a whole (primary, secondary and tertiary) and a country as a whole (special districts and regions and urban, suburban and rural populations). The following table and graph depict Canada’s public expenditure on education as a percent of gross-domestic product (UN, UN Data).

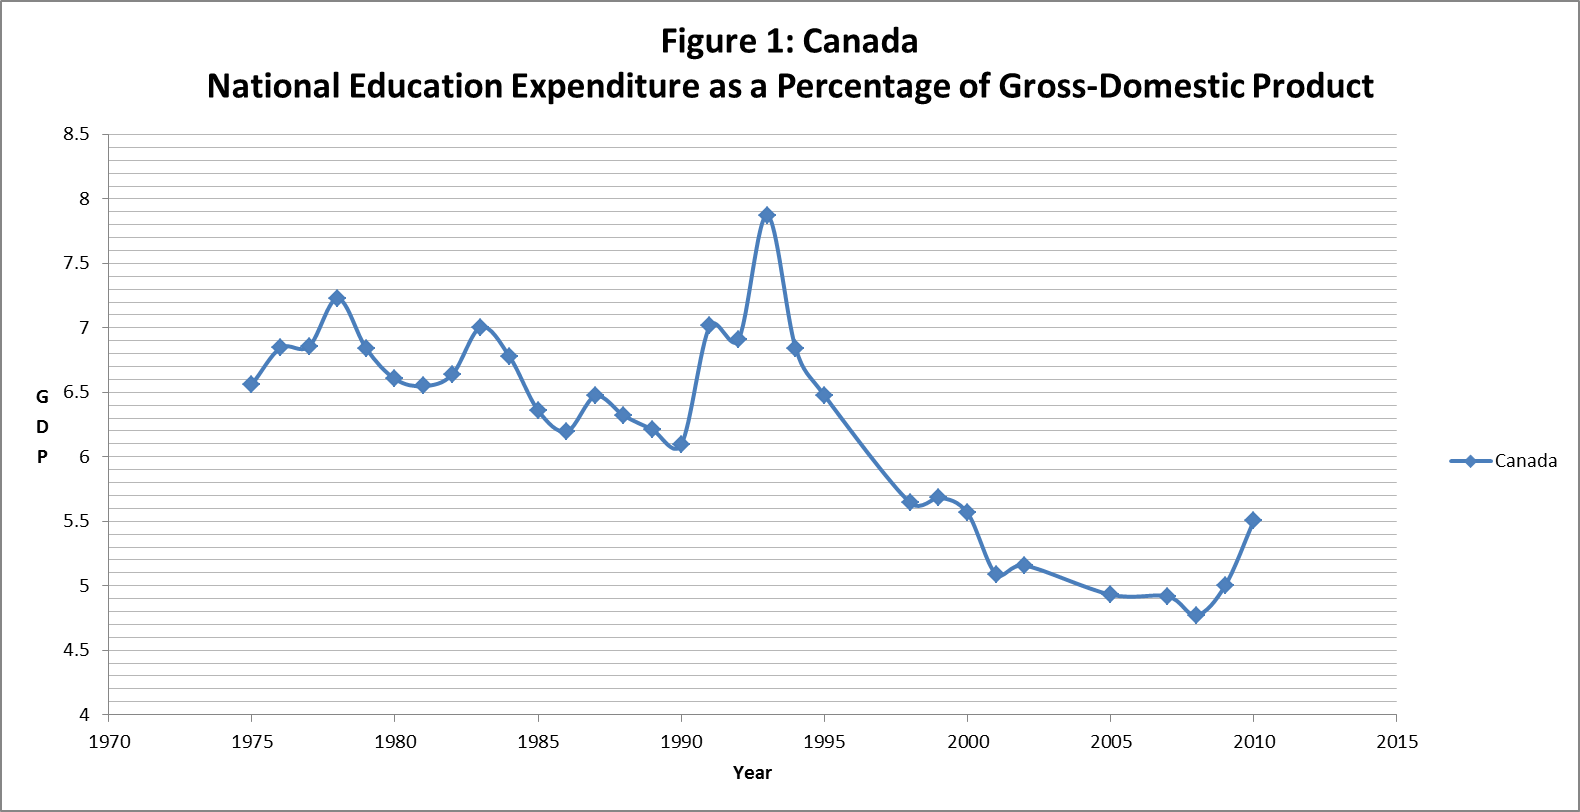
From the above data trends emerge. Historically, Canada has devoted a large proportion of its expenditure to education. Between 1975 and almost 2000 Canada spent between 6.0% and 8.0% of its GDP on education, corresponding to an average of approximately 6.5%. According to data provided by the World Bank, an expenditure of 6.5% of GDP on education correlates to a nation being in the race, even a contender for the lead in education—well above the world average. Depending on the year (the actual GDP figures) Canada would rank between 10th and 35th place in the world on education expenditures. However, since around 2000, policy in Canada had drastically changed, moving away from educational spending. By 2002 Canada had fallen to 49th place (corresponding to 5.2% GDP) and has continued to fall year after year. By 2008 Canada’s expenditure as a percentage of GDP had reached an all-time low of around 4.7% of GDP, corresponding to an 80th place position amongst nations according to their educational spending habits. In part, this downward shift in ranking has occurring due to the redistribution of wealth occurring in the world as the once G3 (Group of 3 economic powerhouses) has transformed into the modern G20. With nearly 200 countries in the world and the number of emerging marketsgrowing the effect on world spending on education as a percentage of GDP has been growing. Figure 2 below shows Canada’s education expenditure compared to the worlds.
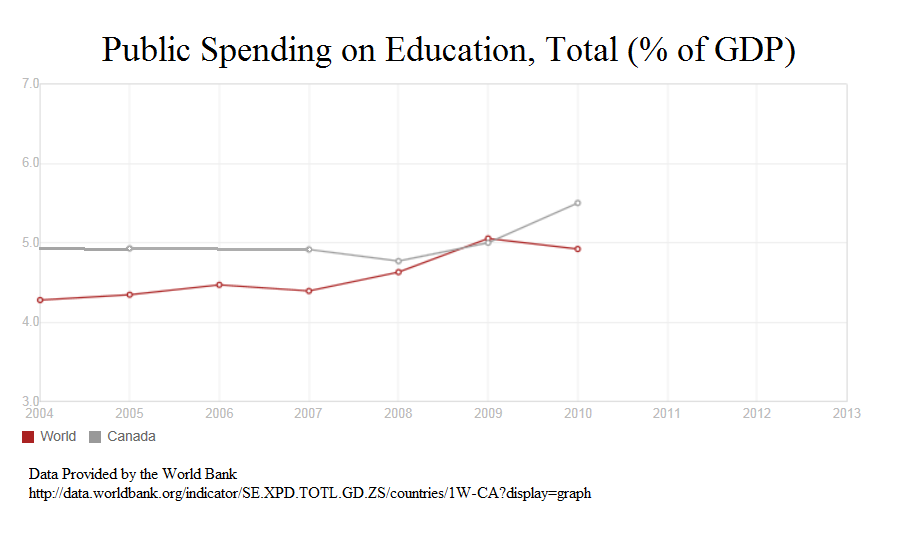
From these graphs, it is shown that educational spending for Canada as a function of GDP has been relatively steady and above a GDP of 6% over time until around 2000 and then started to drop, decreasing over time. During this same period of time, 1975 to Today, the average world public expenditure on education as a percentage of GDP for the world has been and is expected to continue to increase with time. 2009 marks a pivotal point for Canada, a wake up call, as the world’s average expenditure surpassed Canada’s; marking the year that Canada had fallen below the world’s average in terms of educational spending. This world average, in terms of GDP, is on par with nations like Latvia, Syria, Rwanda, Mozambique, Poland, Bhutan, Ecuador and Spain. Spain, a nation in financial ruin (PIIGS, Portugal, Ireland, Italy, Greece and Spain) amidst the European crises still contributed a value equal to that of Canada, 5.0% of its GDP to education, in 2009. Ireland another country facing austerity measures still contributed 6.5% of its GDP in 2009 (The World Bank, Public Spending on Education). If it is true that you pay for what you get, then when seen through these lenses, Canadians should not complain as Canada is faring pretty good in the world of education.
The Funding Model (Federal Perspective: Canadian Overview):
The use of international recognition and perception is valuable in so far as to assess the quality of education within our Canadian boarders—our primary concern. The strong positive correlations between the quality of education being delivered and finances being received are the focus. In Canada, the funding of education is primarily a public concern and at the top of the financial food chain in Canada is the federal government. In Canada, however, there is no federal department of education and no integrated national system of education. The federal government of Canada primarily provides financial support for the teaching of the two national languages, English and French, and for postsecondary education. In addition, the federal government is responsible for the education of Registered Indian people on reserve, personnel in the armed forces and the coast guard, and inmates in federal correctional facilities (The Council of Ministers of Education, Education of Canada Overview).
This leads to each province and territory being responsible for its own education, which means that public funding for education, comes directly from the provincial or territorial government.The provincial ministries and departments of education provide educational, administrative, and financial management and school support functions. These ministries and departments also define both the educational services to be provided and the policy and legislative frameworks (The Council of Ministers of Education, The Development of Education Reports for Canada 2008, 2008).The provincial and territorial government establishes the regulations, which provides the grant structure that sets the level of funding for each school board. Factors such as the number of students, special needs, and location determine the amount of grant funding (The Council of Ministers of Education, The Development of Education Reports for Canada 2008, 2008).
On the local level, the governance of education is entrusted to school boards (also known as districts, divisions, or councils). The power delegated to the local authorities is at the discretion of the provincial and territorial governments.The local government andschool boards can also receive public funding with taxing powersthrough a mix of provincial transfers and local taxes(The Council of Ministers of Education, Education of Canada Overview).
The Funding Model (Provincial Perspective: British Columbian Overview):
In British Columbia the K-12 public education system is jointly managed by the provincial government and the 60 elected boards of education. The province establishes the amount of grant funding for public education annually, and uses a funding formula to allocate these funds to the Boards of Education. The Boards of Education, in turn, operate and provide public education programs and courses in British Columbia. The Boards manage and allocate their allotment based on local spending priorities (Ministry of Education of British Columbia, K-12 Funding Allocation System). The vast majority of funding received by a school originates from the provincial government. The provincial funding formula consists of a base plus a supplemental portion. The base provides the primary funding received by schools and it is in the form of an operational grant based on enrollment—student registration, course load, attendance and active participation. In addition, the government provides capital costs and funding for special programs through supplemental government funds. However, School Boards and Schools have other sources of revenue and can accumulate and invest operating surpluses, but are not allowed to operate with a deficit.
Capital grants represent long-term planning considerations. Capital grant allocation is based on 5-year plans. Government funds the capital costs of school construction. This is done through debt-service grants. The major components of Government’s capital program are site acquisition, construction of new schools, additions to existing schools, and renovations to existing schools. In addition to capital funding allocations, boards receive an annual facility grant to cover the costs of renovations to extend the useful life of school buildings (Ministry of Education of British Columbia, Capital Management).
Supplemental grants (special purpose or discretionary grants) are based on need. Supplemental grants are provided to Boards of Education to address the variable costs associated with running a particular school. Supplemental grants can be requested by a school and fall within one of the seven following broad categories (Ministry of Education of British Columbia, 2013/14 Interim Operating Grants):
- Unique student needs, including special needs, English as a Second Language, Aboriginal Education, and Adult Education programs;
- Enrolment Decline, where enrolments decrease by more than one per cent in a year;
- Salary Differentials, for districts with higher average teacher salaries;
- Unique Geographic Factors;
- Education Plan, Transportation and Housing;
- Formula Transition; and
- Funding Protection
Public school grants are allocated using a largely student-based funding system, with the majority of funding allocated on a per student full-time equivalent basis. A school can receive up to a maximum 1.0 FTE (full-time equivalent) per student in a school year. The amount of funding allocated per maximum 1.0 FTE varies depending on the status of the student and/or the school. For a student enrolled in a standard (regular) school the current 2013 FTE is $6900 (See the ministry of education operating grants manual for other FTE evaluations).
Figure 3 below depicts the basic categories of revenue used in the funding allocation process. It identifies the significant types and sources of revenue for a school district within as few standardized headings as possible. The items listed are identified as objects tagged with account numbers for financial purposes (Ministry of Education, Operating Fund; Operating Fund Account Descriptions Revenues, 4).

As previously stated, the majority of funding received by a school comes from the province. From this figure funds originate under the 620 provincial grant account. According to the 2012/13 budget report, approximately 94.4 percent of the total Budgeted Revenue identified by the School Boards of Education originated from the province in Provincial Grants. The reaming 5.6 percent of revenue originated from the other object accounts indicated: Federal grants, school referendum taxes, other revenue, rentals and leases and investment revenue (Ministry of Education, Annual Budget Analysis and …, 1).
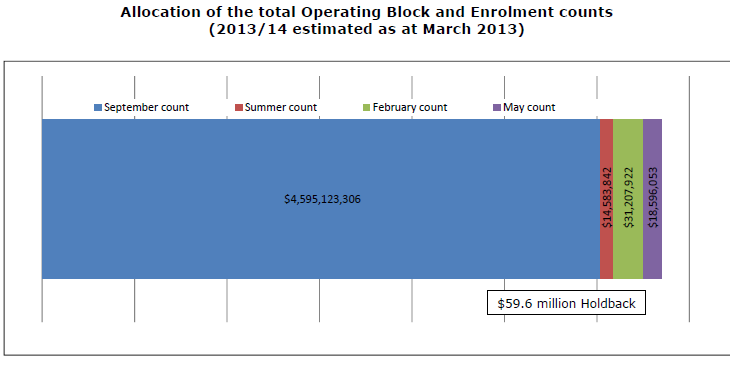
A graphical overview of the provincial operating grant allocation formula that breaks down the funding received is shown below in figure 4. The funding information displayed below is based on a total estimate of 4.73 billion dollars for the 2013/14 school year (Ministry of Education, Overview of the 2013/14 Operating…). This figure indicates that nearly 80% of the funding comes from the basic allocation portion of the formula. The information provide with figures 3 and 4 not only illustrate the funding allocation hierarchy, but illustrate the heavy dependence on the provincial government and the performance of the different aspects of the funding formula.

Canada-Wide Comparison of K-12 Funding (Provincial Perspective: British Columbia):
“Students in British Columbia are being shortchanged in comparison to students elsewhere in Canada”, represents the opening statement in the Education Funding Brief 2012 put out by the British Columbia Teachers Federation (BCTF) (2). This document goes into detail outlining the need for change in British Columbia due to the fact that other provinces have been improving K-12 funding at a greater rate than British Columbia and that percentage increases in the funding for education in British Columbia have not been keeping up. The main argument put forward by the article is that “There is no valid excuse for British Columbia to follow a decade of reducing educational services, with a continuation of that practice” (British Columbia Teachers Federation, Education Funding Brief 2012, 8). A statement that builds on the findings of the previous sections, which showed a reduction in spending started around the turn of the century on a national level.
Appendix 3 of the Education Funding Brief 2012 compares the Canadian and British Columbian public expenditure of gross domestic product per capita for K-12 education over this recent decade. The main takeaways are that prior to 2002/03 British Columbia used to be higher than the Canadian average and that British Columbia has never returned to the average with the gap continuing to widen between British Columbia and the rest of Canada. The 2009/10 figures for total expenditures in public elementary and secondary schools as a percentage of GDP per capita is 3.6% and 3.3% respectively for Canada and British Columbia. This information is summarized in figure 5 below.
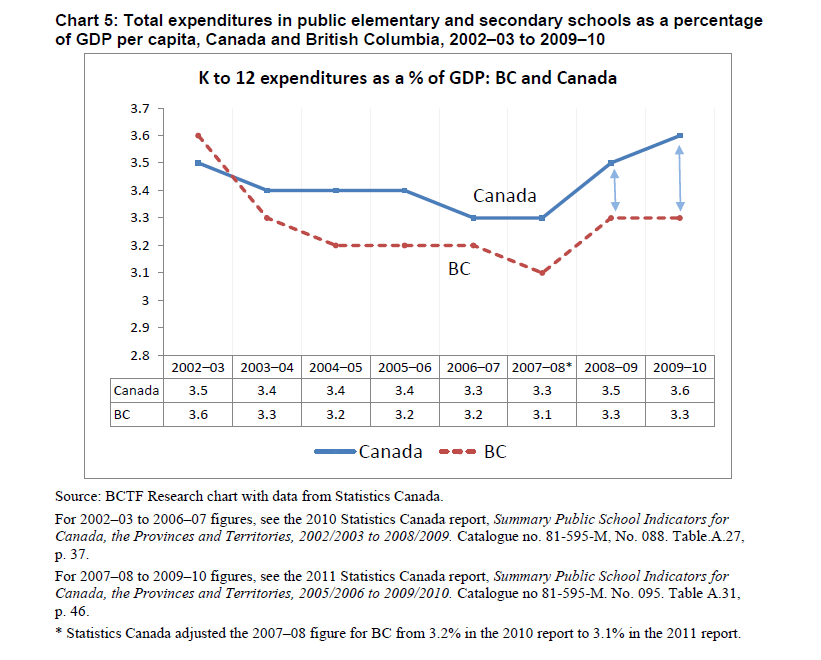
With British Columbia being below the Canadian average and one of the lowest funded provinces for education, it is important to develop a sense of the urgency that exists with regards to change. When looking at the improvements to the education budgets across the provinces, we find that British Columbia, compared to the other provinces, provided the lowest percentage increase in education funding for six key indicators used by Statistics Canada to measure public school expenditures; a Fact that does not bode well for reducing the widening funding gap. Table 2, shown below, looks at where British Columbia stands in comparison to other provinces in improvements to their education budgets (British Columbia Teachers Federation, Education Funding Brief 2012, 3).

Understanding the Impact of Funding at the Local Level (Schools & School Board Districts):
Since the effects of provincial level funding on education are usually apparent at the local level. It is best to assess a funding model by evaluating the adverse effects that the funding policies have on schools. However, complicating the issue is the notion of an essential service. An evaluation of the funding behind a service that is designated essential is more difficult as the show must always go on. In British Columbia, the provision of primary and secondary education falls under the essential services act, which requires the government to provide those services, and the union is required to allow its members to perform those services in the event of a strike or lockout. So, the quality of a funding model cannot be purely based on the fact that a school is operational. Quality, as determined here, is based on the ability to realize long term prospects as defined by the funding model. Put another way, can a school operate within their budget while continuing to develop for tomorrow, or is the hindrance to development posed by the funding provided too great? The reality is that most districts and their schools are facing challenges in handling their finances. Many sacrifices are being made that have led to a reduction in today’s supplies and services and an inability to make long term plans for development. The main areas of inquiry revolve around the long-term development plans for infrastructure, programs and services, and supplies acquisition (curricular, furniture, equipment and technology). The Vancouver and Coquitlam districts serve as a focal point in illustrating certain aspects of funding.
Financial:
The Coquitlam district is in terrible shape financially. It is currently experiencing an 8 million operating cost deficit that will take many years to pay off (Tri-City News, Lack of control and…). KPMG, the consultant agency who headed the audit, suggests the district’s leadership team has been lacking in financial prudence. Negligence not criminal activity is the culprit. The incident occurred because the school district was trying to operate the school not like a business—“putting education outcomes before the bottom line” (Tri-City News, Lack of control and…).
The Vancouver school board is also facing a structural deficit with its operating costs exceeding its revenue, according to a report made for the Ministry of Education of British Columbia on the condition of the Vancouver School District (Ministry of Education, Report on the Vancouver School Board, 2010, 4). The report goes onto say that “The Vancouver School Board does not have a long term strategic plan which would link Vancouver School Board’s educational and business priorities and align its actions and allocation of funding with those priorities” (3). One of the main concerns iterated in the report pertains to the long term planning of the Vancouver school board being less than effective; there is no integrated strategic plan, no formal long term capital plan and the strategies employed are more reactive rather than strategic (5)—The Vancouver School Board (VSB) and District Management Team (DMT) attributed the planning problem to the uncertainty over provincial policy and funding (27).
Infrastructure:
Unlike Coquitlam, the Vancouver school board has an infrastructure problem. The Vancouver School Board is an old district and owns 110 schools as a part of its network some over 100 years of age. The facilities are aging and have extensive needs with respect to seismic safety. Seismic concerns and upgrades are required on at least 52 buildings. The total cost of the current infrastructure proposal for basic upgrades is estimated at a minimum of $600-800 Million with full upgrades or complete replacement options ranging up to $1Billion (Vancouver School Board, Vancouver School Board Sectoral Review, 2012, 33). The Vancouver school board has been unable to address the infrastructure concerns due to the difficult task of obtaining support from the Ministry of Education (Vancouver School Board, Vancouver School Board Sectoral Review, 2012, 33).
Programs & Services:
Of all the indicators, the use of program and service availability to judge policy is difficult, arising from the multi-faceted biases that exist regarding their essential nature. However, in the case of the Coquitlam district, since school boards are not permitted to carry over deficits Coquitlam is in a bind. Not only will the 8 million deficit take years to pay off, but the Coquitlam district had to make $12.1 million in cuts to this year’s operating budget. Cuts that were for years considered to be important to the running of the district. According to an article in the Tri-City Now, one-hundred and forty-two district jobs are going to be cut that will significantly cut into the current programs and services being offered in the district (The Tri-Cities Now, School Board Budget Cuts 142…). With the order to return back to basics, all non-essential and extra-curricular activities are planned to be cut back.
The Vancouver School board is facing a similar predicament. It is the intention of a budget to handle the operating costs of an efficiently run school. The financial consequences of an inefficiently run school reside with the district and particular school—reduction of programs and services to compensate. From the report on the Vancouver school board, the Ministry of Education’s interpretation of the VSB’s incurred deficit is that school consolidation and closures (59) and the reduction or elimination of activities that are of less priority (29) will be enough to correct for education-wide inefficiencies created by the declining student enrollment, which is believed to be the at the heart of the deficit (Ministry of Education, Report on the Vancouver School Board). In other words, the cost to heat a building that is under capacity will result in the elimination of a breakfast program, afterschool club or school bus due to the inability of the per student funding to cover the heating for the rest of the students that attend.
Supply Acquisition:
The acquisition of material goods is much easier to quantify than a service. Just as the ability to distinguish a material good for tomorrow from one for today. Physically speaking, it is as easy as walking through a school and assessing if the tools used by the students are modern and up to date. An equivalent assessment can be done through inspection of a school’s financial statements. For any object purchased in a year which is not consumed during that year is expected to have been purchased for the development of the school. In this section we focus on a schools ability to acquire tangible objects like supplies, furniture, equipment and technology that are used by students.
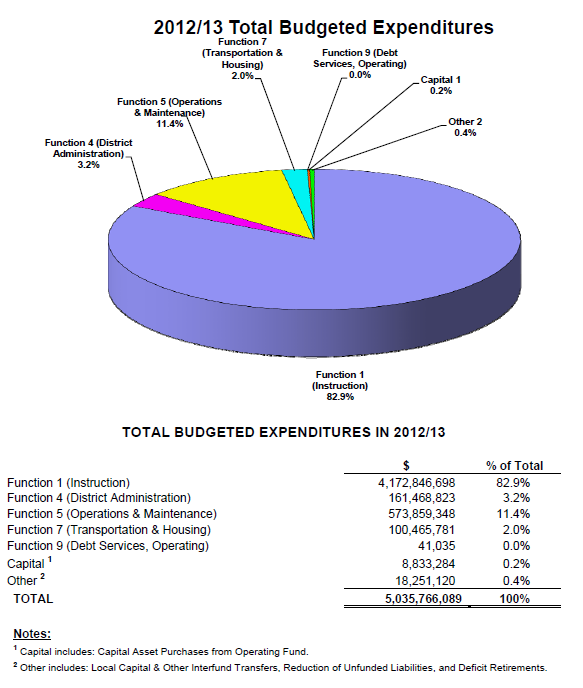
The primary reason that this is possible is because sound accounting principles exists that require—legally bind—a business, like a school, to list and itemize their yearly activities in financial statements for reporting purposes. In addition, because education is a public service its records are accessible for inspection by its citizens for transparency issues. Therefore, to understand the quality of an education’s funding model in terms of supply acquisition, a school’s expenditure in relation to its funding for the items of interest must be considered. Figure 6 below summarizes the Total Budgeted Expenditures for 2012/13. The operating expenditures are grouped into five broad functional areas: Instruction, District Administration, Operations and Maintenance, Transportation and Housing, and Debt Services (Ministry of Education, Annual Budget Analysis and Revenue…).
However, since funding is expressed by object (see figure 3) and expenditures are expressed by function (see figure 6 above), the following two figures are used to facilitate a connection between the money in (revenue) and the money out (expenses) through the processes that the money is used. Figure 7 below expresses expenditures in terms of the 5 functions given in the last figure (figure 6 above) and the programs that those functions support (Ministry of Education, Operating Fund; Operating Fund Account Descriptions Revenues, 13).
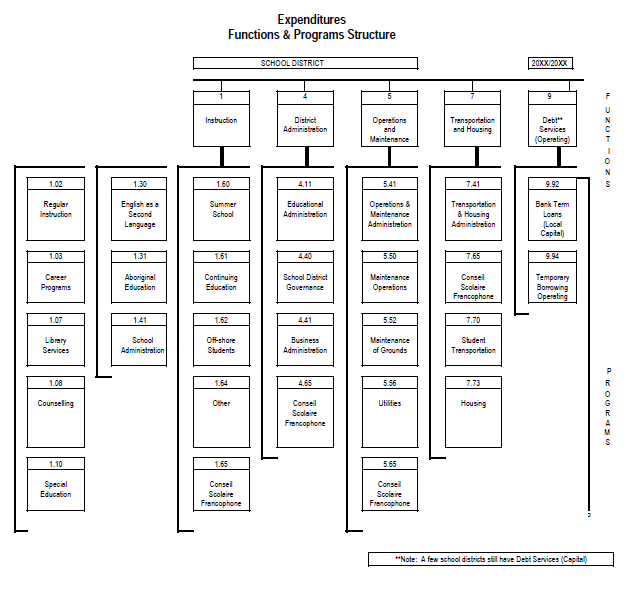
Figure 8 below expresses the expenditures by the objects we intend to measure the funding formula with (Ministry of Education, Operating Fund; Operating Fund Account Descriptions Revenues, 6). The modern aspect of the tools used by students: the supplies, furniture, equipment and technology used by students today that are relevant to their future tomorrow.
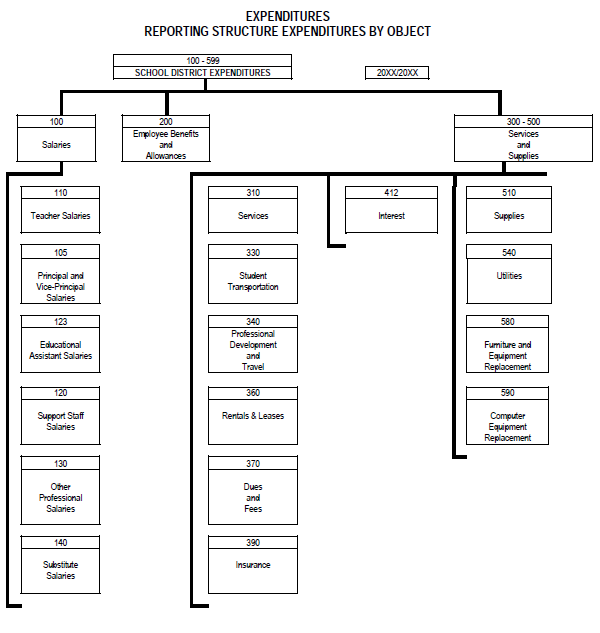
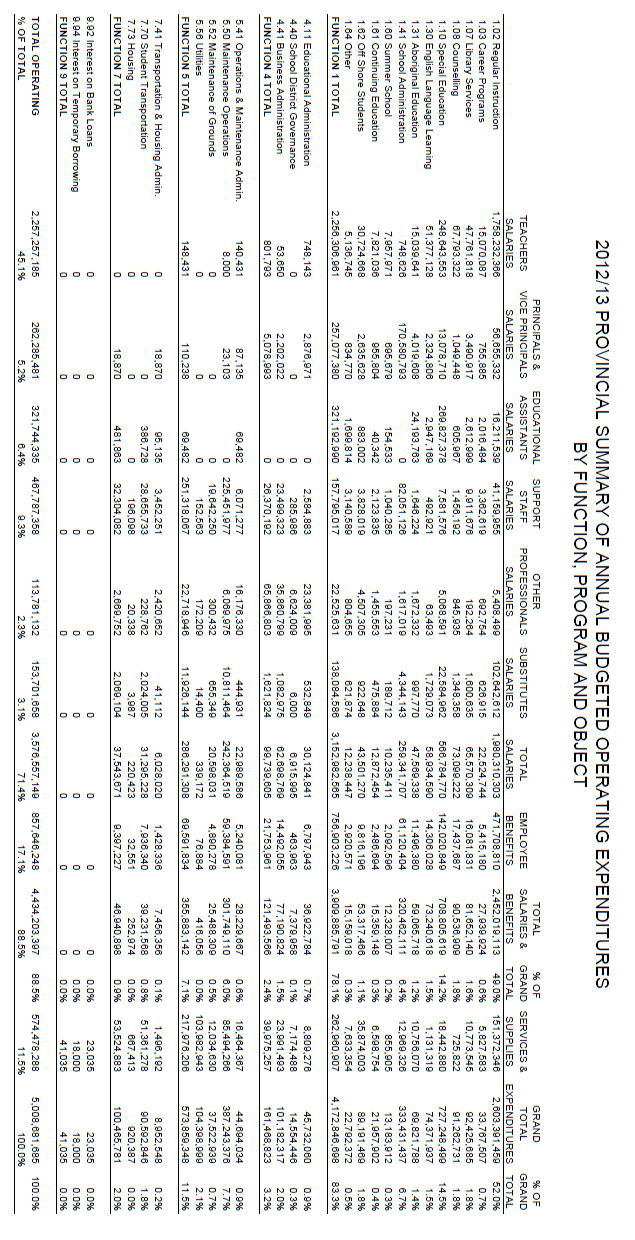
Looking at figure 8 the objects of interest are the services and supply, 300-500 accounts, categories. In particular, we want to look at the portion of the supplies (510) that are not consumed within the year and the furniture and equipment replacement (580) and computer equipment replacement (590) accounts. These particular accounts will pertain to merchandise purchased with the intention of growing programs and services. Table 3 represents the 2012/2013 provincial summary of annual budgeted expenditures by object and looks at the values for these accounts (Ministry of Education, BC School District Revenue and Expenditure Tables 2012/13; Provincial Summary of Budgeted Expenditure by Object).
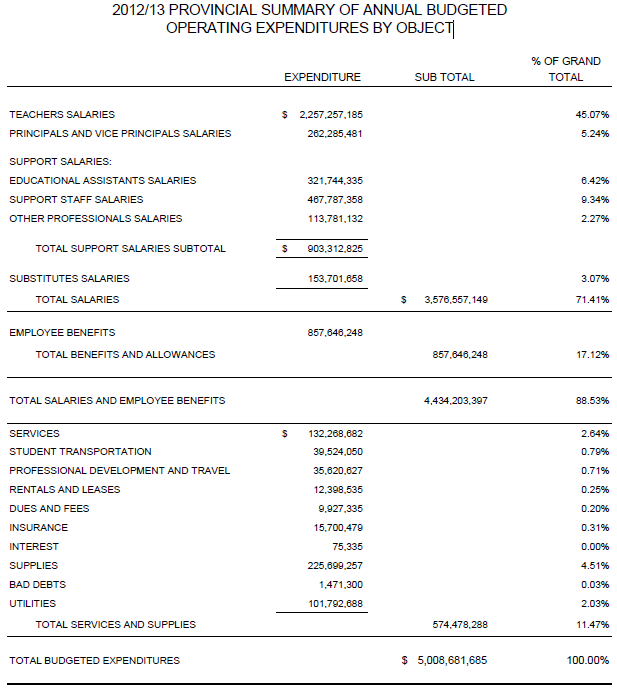
By comparingthe accounts listed in Table 3 to the accounts listed in figure 8 it can be verified that each account is accounted for with a value and percentage except for account 580 (furniture and equipment replacement) and 590 (computer equipment replacement). This means that the values associated with these accounts are so small that they can be amalgamated with their parent account 510 (supplies) for reporting purposes. The value of the supplies account indicated in the above table is 4.51%. Table 4 below is provided to illustrate the same findings by comparing the object accounts to the function and program accounts in figure 7. Table 4, on the next page, represents the 2012/13 provincial summary of annual budgeted operating expenditures by function, program and object (Ministry of Education, BC School District Revenue and Expenditure Tables 2012/13; Provincial Summary of Budgeted Operating Expenditures by Function).
Since the values have not been made readily accessible, an in depth audit of the financial statements would be required to produce an accurate value. However, there are three approximations that can be used to gauge the percentage of the supply account that will be used within a year. First, the basic allocation formula can be used to derive an approximate value. From figure 4 the basic allocation portion accounts for approximately 79% of the funding with the supplement accounting for the remaining 21%. Therefore a fair value for supplies that are dedicated to the future development of the school and students would be around 0.94% (21% of 4.51%). Second, a comparison of the utilities account to the supplies account could give a value. Generally, utilities would consume a fraction of the supplies required to run a school. Assuming a ratio of two or three-halves consumption of utilities (2.03%) to supplies (4.51%) would imply that a fair range for supplies that are dedicated to the future development of the school and students will range somewhere from 0.45% up to 1.47%. Third, would be to compare the supplies account to the capital assets account (This is the capital 1 account in figure 6 that represents capital asset purchases from the operating fund ≈ 0.2%), which is an account for long-term large purchases. Assuming a ratio of two for the consumption of long-term supplies to capital assets would yield a fair value for supplies being dedicated to the future development of the school and students to be around 0.4%. Although these are just approximations, all four methods indicate that the portion of the supplies account being dedicated to the future growth and development of the school and its students corresponds to a value under 1%. The max being 4.51%, which assumes that all teachers are purchasing all the supplies needed for their students that year out of their own pocket.
Conclusion
Headlines all around the world talk about the strides made by Asian countries with the dragons dominating the charts (Korea, Taiwan, China, and Singapore). The emerging markets have emerged in terms of educational reforms and standings. Many newly developing nations have already begun investing in tomorrow, investing in education, in which the results are already clear. Even though no two education systems are alike and a person may consider a dragon nation-Canadian comparison to be unfair. It would not change even if we evened the playing field and compared oranges to oranges.A comparison of Canada to the average western education system would still find Canada lagging behind in terms of their investment into education as a percentage of GDP by 0.5% to 1.5%. Canada, a top 10 nation with respect to Education running off of a budget, according to GDP, fit for an 80th place finish. Comparatively speaking, it is clear that an influx of funding is required if we wish to remain competitive on the international level. If we were in a race, then we would be equipped with an antiquated Ford Mustang that was trying to compete against the more modern Mercedes, Porches and Mitsubishi’s coming off the assembly line. The state of education currently experienced is unbecoming.Of course Canada is slipping every year in its standings and it will continue to do so until something is done. Our education system is running on steam and without fuel it is inevitable to continue to slide. The intellectual property of our past will continue to hold ground for only so long.
The comparison of British Columbia to other provinces within Canada also yielded unwelcoming results. The shift in education spending that occurred nearly a decade ago in British Columbia caused British Columbia to fall behind the rest of Canada.A shift attributed to the “direct result of Liberal government funding policies” (Ministry of Education, Education Funding Brief 2012; Appendix 3, 3). Statistics tells us that British Columbia needs to increase spending by at least 0.3% of GDP in order to meet the Canadian average. More is expected though due to recent trends by other provinces corresponding to increases in educational spending. This decade of reduced spending can be witnessed firsthand with a walk down the halls of an average school and a visit to an average classroom, which will undoubtedly yield an unelaborate, outdated setup stemming from the void of resources being devoted to the future development of the school.A secondary source that can be used to verify that claim would be the financial statements from a school. 88.5% of a school’s expenditure is attributed to employees and employee benefits. The remaining 11.5% of the expenditure is devoted to the supplies and services of a school, nearly all of which is required by the school to remain operational. It is estimated that less than 1% of a budget is put to future use—the ability to acquire tangible objects like supplies, furniture, equipment, tools and technology that are used by students. If a business would eventually fold by only investing 1% of its resources into its future then why would a school be any different? Why isn’t something being done? Why has the can been kicked for so long?
Schools and school districts are having a hard time handling their finances as illustrated by the Vancouver and Coquitlam districts; be it infrastructure, programs, services or supplies, problems are inherent in which increased funding would help. Pointing fingers is easy when looking at the funding allocation model. In essence, all our eggs have been put into a single basket. Our education system is at the mercy of provincial funding which provides 94.4% of the budgeted revenue received by schools. Only 5.5% currently comes from everywhere else. With the majority of provincial policies being geared towards equity and not performance, it implies that the intended focus is on addressing the needs of schools operating below par by raising standards to be in line with minimum expectations. It is difficult for a normally operating school to obtain more resources for development if they are not against odds or subscribing to specific programs tied to funding set out by the provincial government. Provincial policies regarding provincial funding are clearly defined and focus on operational costs. If growth and development is a concern then the public must call for a change in the provincial funding allocation formula or be prepared to seek funds elsewhere. However, with the limited role that the federal government (specialized language programs in English and French) and school districts (school referendum taxes) play, the bulk of the efforts would reside on the school itself—school generated funds. The school can generate its own funding through rentals, leases, investment revenue, specialized tuition and miscellaneous. Miscellaneous according to the ministry of education includes revenue from sources like vending machines, cafeterias, field trips, yearbook sales, school fees, graduation fees, band fees, and fundraising. Whereas fundraising refers to other revenue from the private sector like through donations, corporate sponsorship, parent advisory councils.
Works Cited
British Columbia Teachers Federation, (2012), EDUCATION FUNDING; A Brief to the Select Standing committee on Finance and Government Services. Retrieved (15/01/2014) from http://www.bctf.ca/uploadedFiles/Public/Publications/Briefs/2012EdFundingBrief.pdf
Huffington Post, (2013), Best Education in the World: Finland, South Korea Top Country Ranking, U.S Rated Average. Retrieved (11/01/2014) from http://www.huffingtonpost.com/2012/11/27/best-education-in-the-wor_n_2199795.html
Ministry of Education of British Columbia, (2013), K-12 Funding Allocation System. Retrieved (12/01/2014) from http://www.bced.gov.bc.ca/k12funding/
Ministry of Education of British Columbia, (2013), 2013/14 Interim Operating Grants. Retrieved (12/01/2014) from http://www.bced.gov.bc.ca/k12funding/funding/13-14/welcome.htm
Ministry of Education of British Columbia, (2013), Capital Management. Retrieved (12/01/2014) from http://www.bced.gov.bc.ca/capitalplanning/
Ministry of Education of British Columbia, (2013), 2013-14 Operating Grants Manual. Retrieved (12/01/2014) from http://www.bced.gov.bc.ca/k12funding/funding/13-14/operating-grants-manual.pdf
Ministry of Education, (2010), Report on the Vancouver School Board (School District 39). Retrieved (15/01/2014) from http://www.fin.gov.bc.ca/OCG/ias/pdf_Docs/062026RptFin1.pdf
Ministry of Education, (2013), Annual Budget Analysis and Revenue & Expenditure Tables Overview. Retrieved (16/01/2014) from http://www.bced.gov.bc.ca/accountability/district/revenue/1213/pdf/analysis-overview.pdf
Ministry of Education, (2013), BC School District Revenue and Expenditure Tables 2012/13; Provincial Summary of Budgeted Expenditure by Object. Retrieved (16/01/2014) from http://www.bced.gov.bc.ca/accountability/district/revenue/1213/pdf/table07.pdf
Ministry of Education, (2013), BC School District Revenue and Expenditure Tables 2012/13; Provincial Summary of Budgeted Operating Expenditures by Function. Retrieved (16/01/2014) from http://www.bced.gov.bc.ca/accountability/district/revenue/1213/pdf/table06.pdf
Ministry of Education, (2013), Operating Fund; Operating Fund Account Descriptions Revenues. Retrieved (16/01/2014) from http://www.bced.gov.bc.ca/accountability/district/reference/operating-fund-account-descriptions.pdf
Ministry of Education, (2013), Overview of the 2013/14 Operating Grant Allocation Formula. Retrieved (17/01/2014) from http://www.bced.gov.bc.ca/k12funding/funding/13-14/overview.pdf
The Council of Ministers of Education, Canada (CMEC), (2008), The Development of Education
Reports for Canada 2008. Retrieved (11/01/2014) from http://www.cmec.ca/Publications/Lists/Publications/Attachments/122/ICE2008-reports-canada.en.pdf
The Council of Ministers of Education, Canada (CMEC), (2008), Education of Canada Overview. Retrieved (11/01/2014) from http://www.cmec.ca/299/Education-in-Canada-An-Overview/
The Guardian, (2013), Pisa 2012 results: which country does best at reading, maths and science? Retrieved (12/01/2014) from http://www.theguardian.com/news/datablog/2013/dec/03/pisa-results-country-best-reading-maths-science#_
The New Jersey Minority Educational Development (NJMED), (2013), World Top 20 Education Systems. Retrieved (11/01/2014) from: http://worldtop20.org/
The Tri-Cities Now, (2014), School Board Budget Cuts 142 District Jobs; Teaching Positions to be cut along with some administrative jobs. Retrieved (16/01/2014) from http://www.thenownews.com/news/school-board-budget-cuts-142-district-jobs-1.446332
The World Bank, (2013), Public Spending on Education. Retrieved (15/01/2014) from http://data.worldbank.org/indicator/SE.XPD.TOTL.GD.ZS
Tri-City News, (2014), Lack of control and monitoring led to Coquitlam school district deficit — audit. Retrieved (16/01/2014) from http://www.tricitynews.com/news/240015401.html
United Nations, (2013), UN Data; A World of Information. Retrieved (14/01/2014) from http://data.un.org/Data.aspx?d=UNESCO&f=series%3AXGDP_FSGOV
Vancouver School Board, (2012), Vancouver School Board Sectoral Review; Our Schools, Our Programs, Our Future. Retrieved (15/01/2014) from http://ourfuture.vsb.bc.ca/report/sectoral-review-mar30.pdf