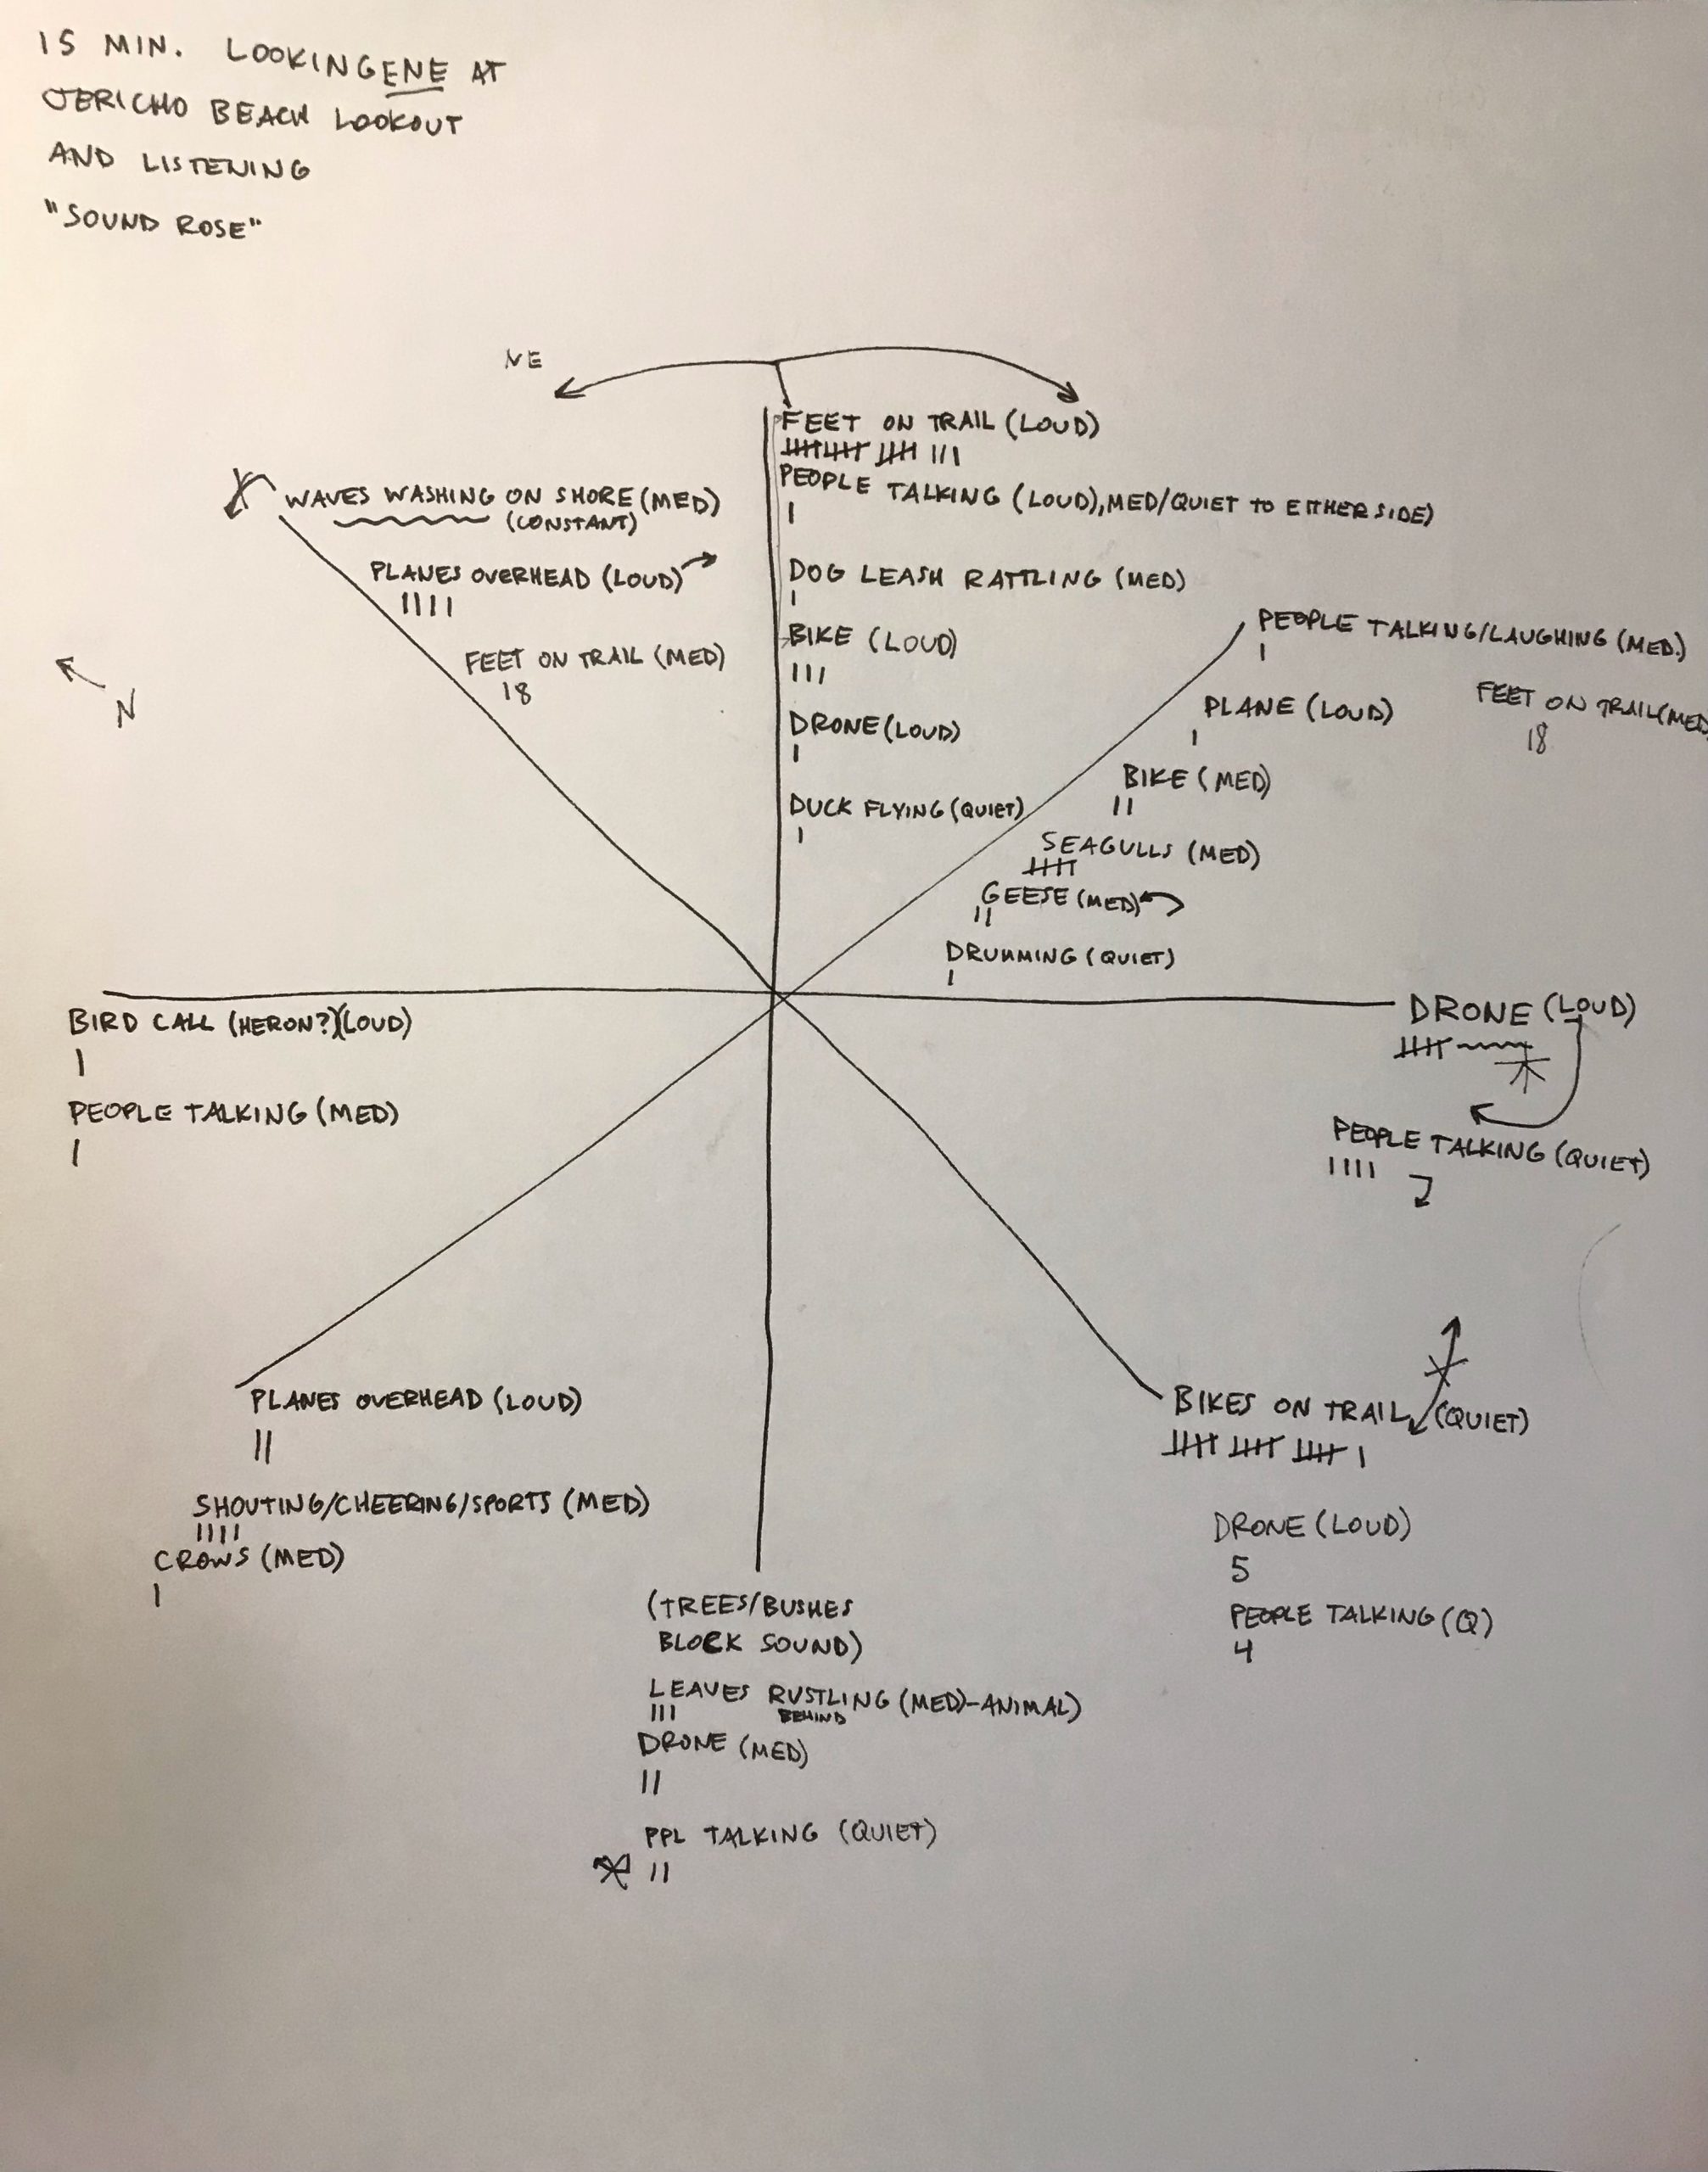
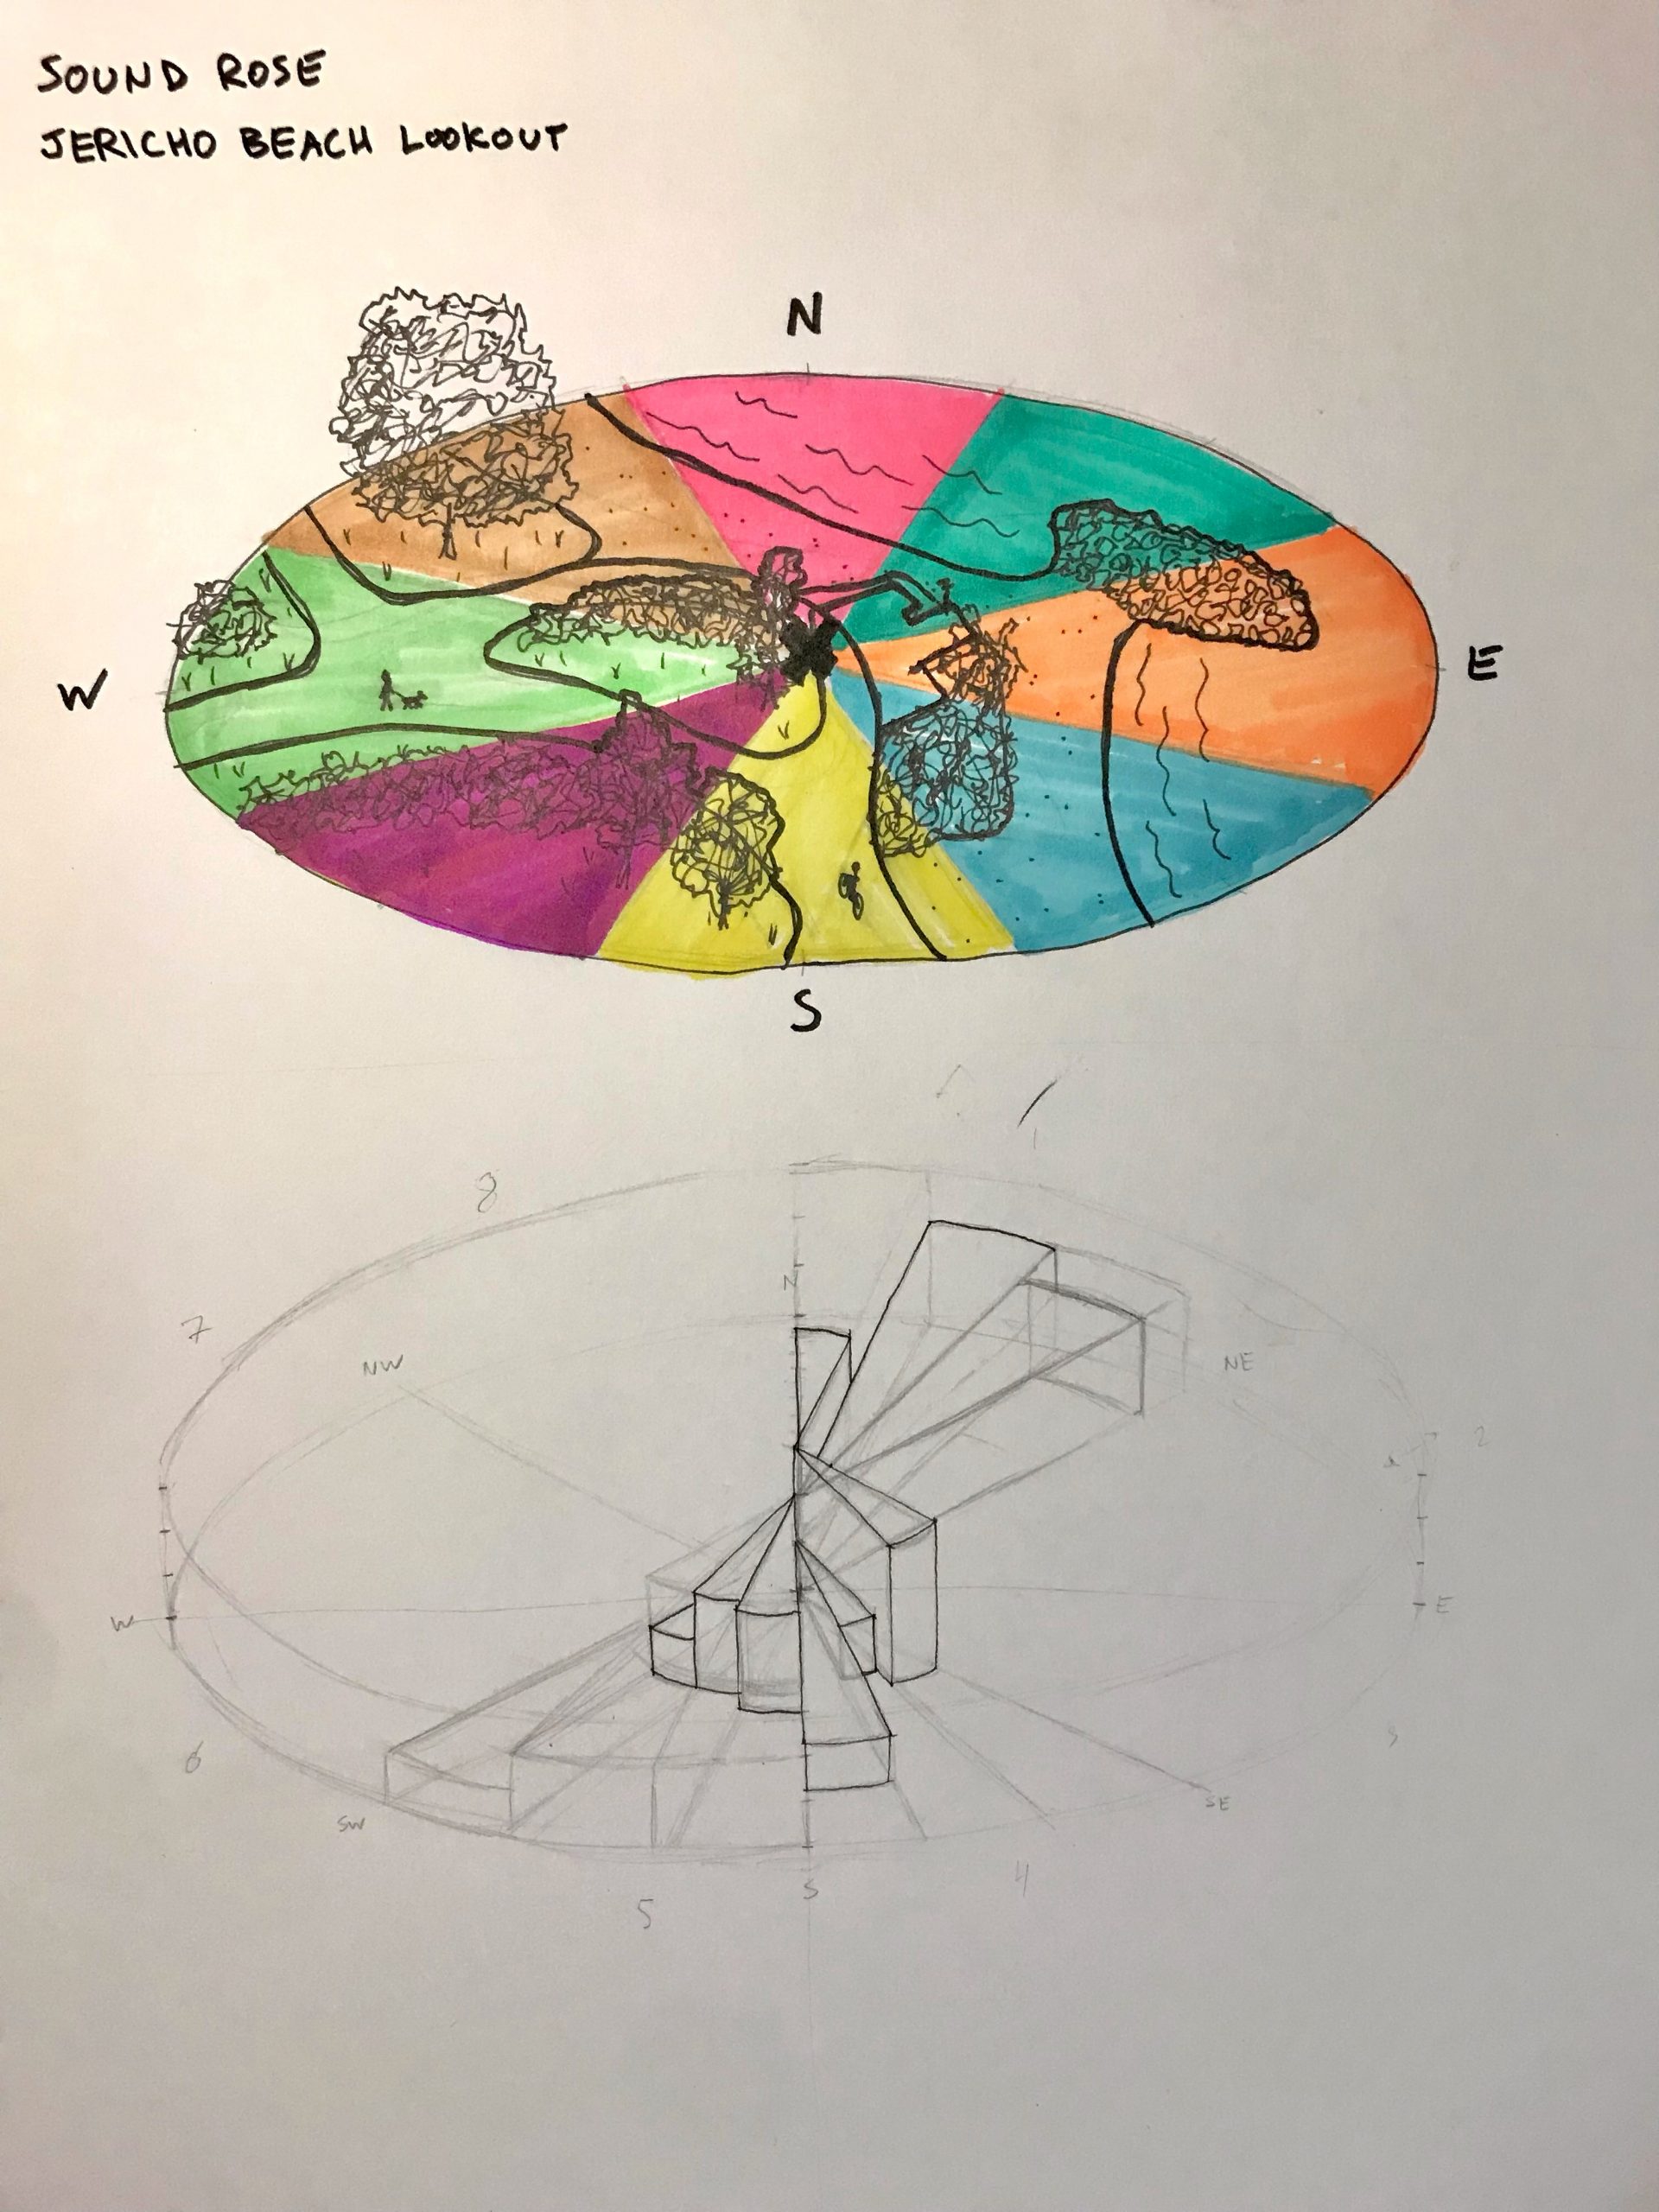
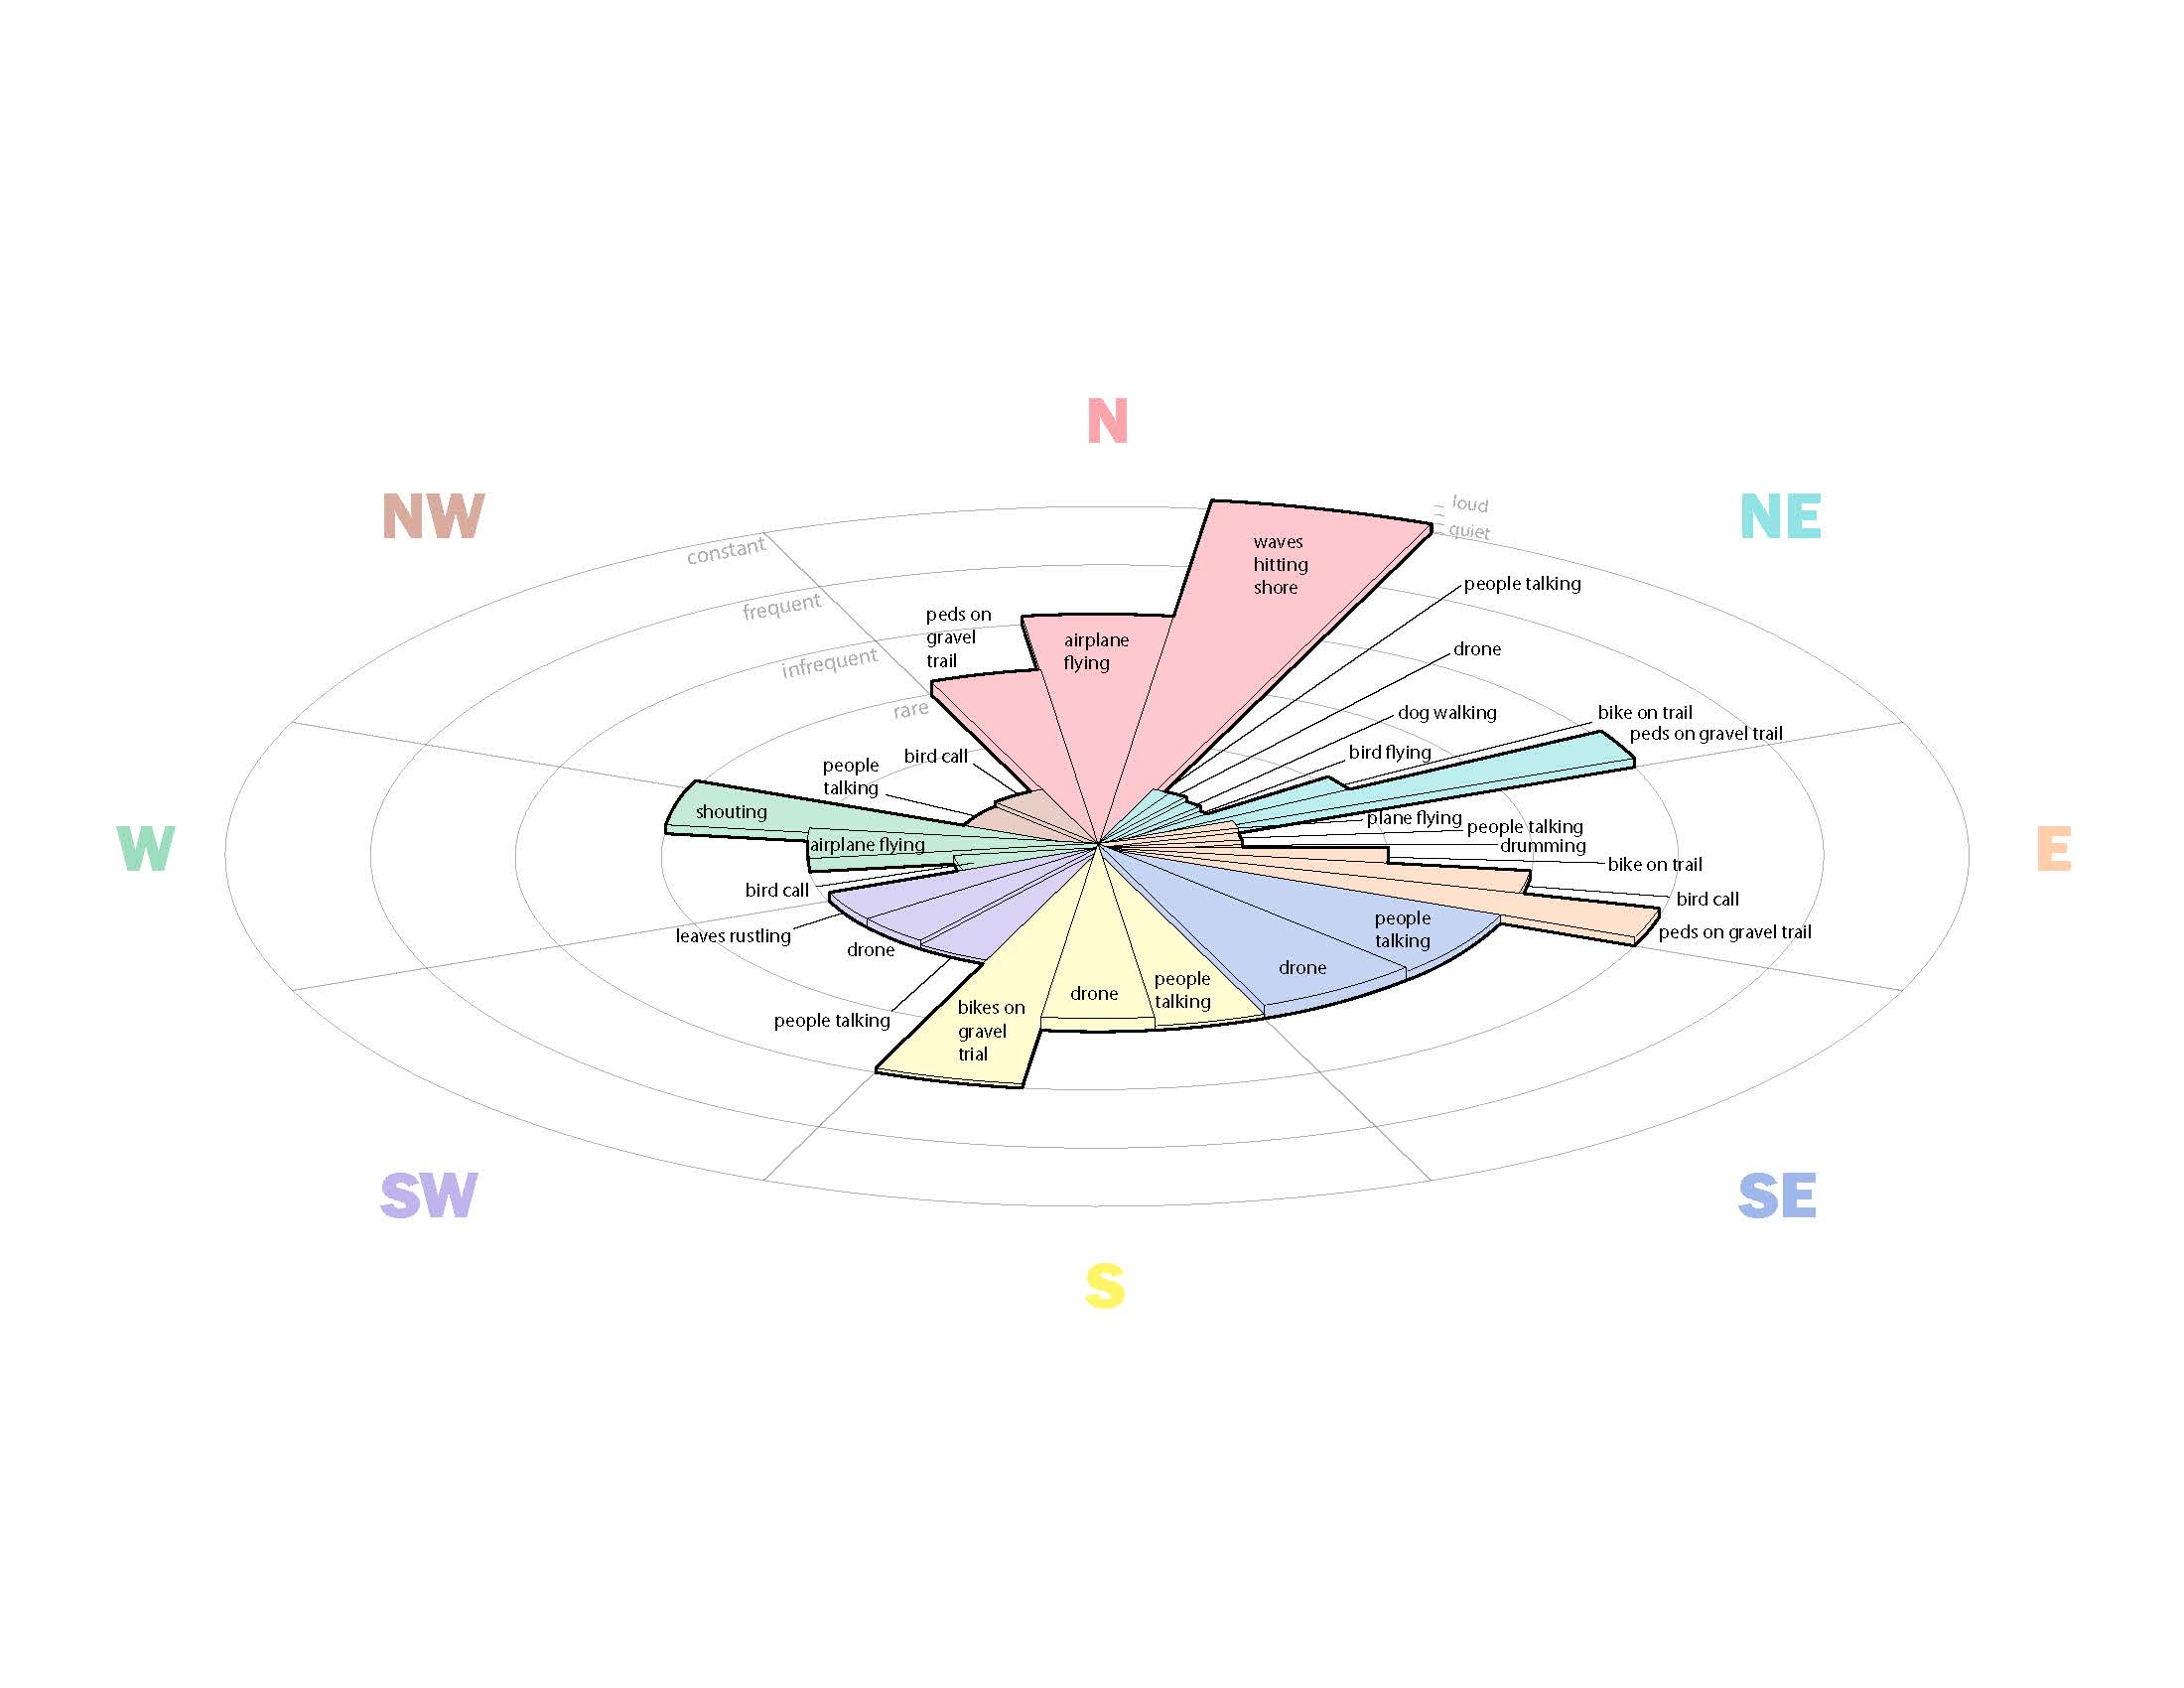
For 15 minutes took tally of sounds heard, which direction they came from, and roughly how loud they were. Site: Jericho Beach Lookout near public binoculars.Sketched map of site surroundings, with cardinal directions colour-coded. Attempted to plot on hand-drawn compass rose below, but too complex. Ultimately made digital version (below).“Sound rose” of sounds heard at Jericho Beach lookout. Each bar represents a different sound, with its extent representing the frequency with which it was heard, and its height representing how audible it was. Cardinal directions are colour-coded and correspond to colours on the map above. Different directions varied greatly in the sounds heard variety of sound sources.
Thanks! It was hard to have everything visible, but kind of worked out! I’ve been thinking it might be more readible in 2D, with colour saturation as the measure of ‘loudness’ rather than height/depth of the bars in 3D.

This is spectacular
Thanks! It was hard to have everything visible, but kind of worked out! I’ve been thinking it might be more readible in 2D, with colour saturation as the measure of ‘loudness’ rather than height/depth of the bars in 3D.