In class

At home

School of Architecture and Landscape Architecture (SALA), University of British Columbia
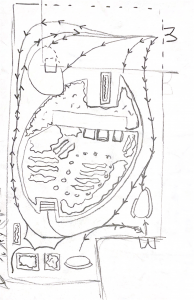
UBC Nest Rooftop Garden Moments
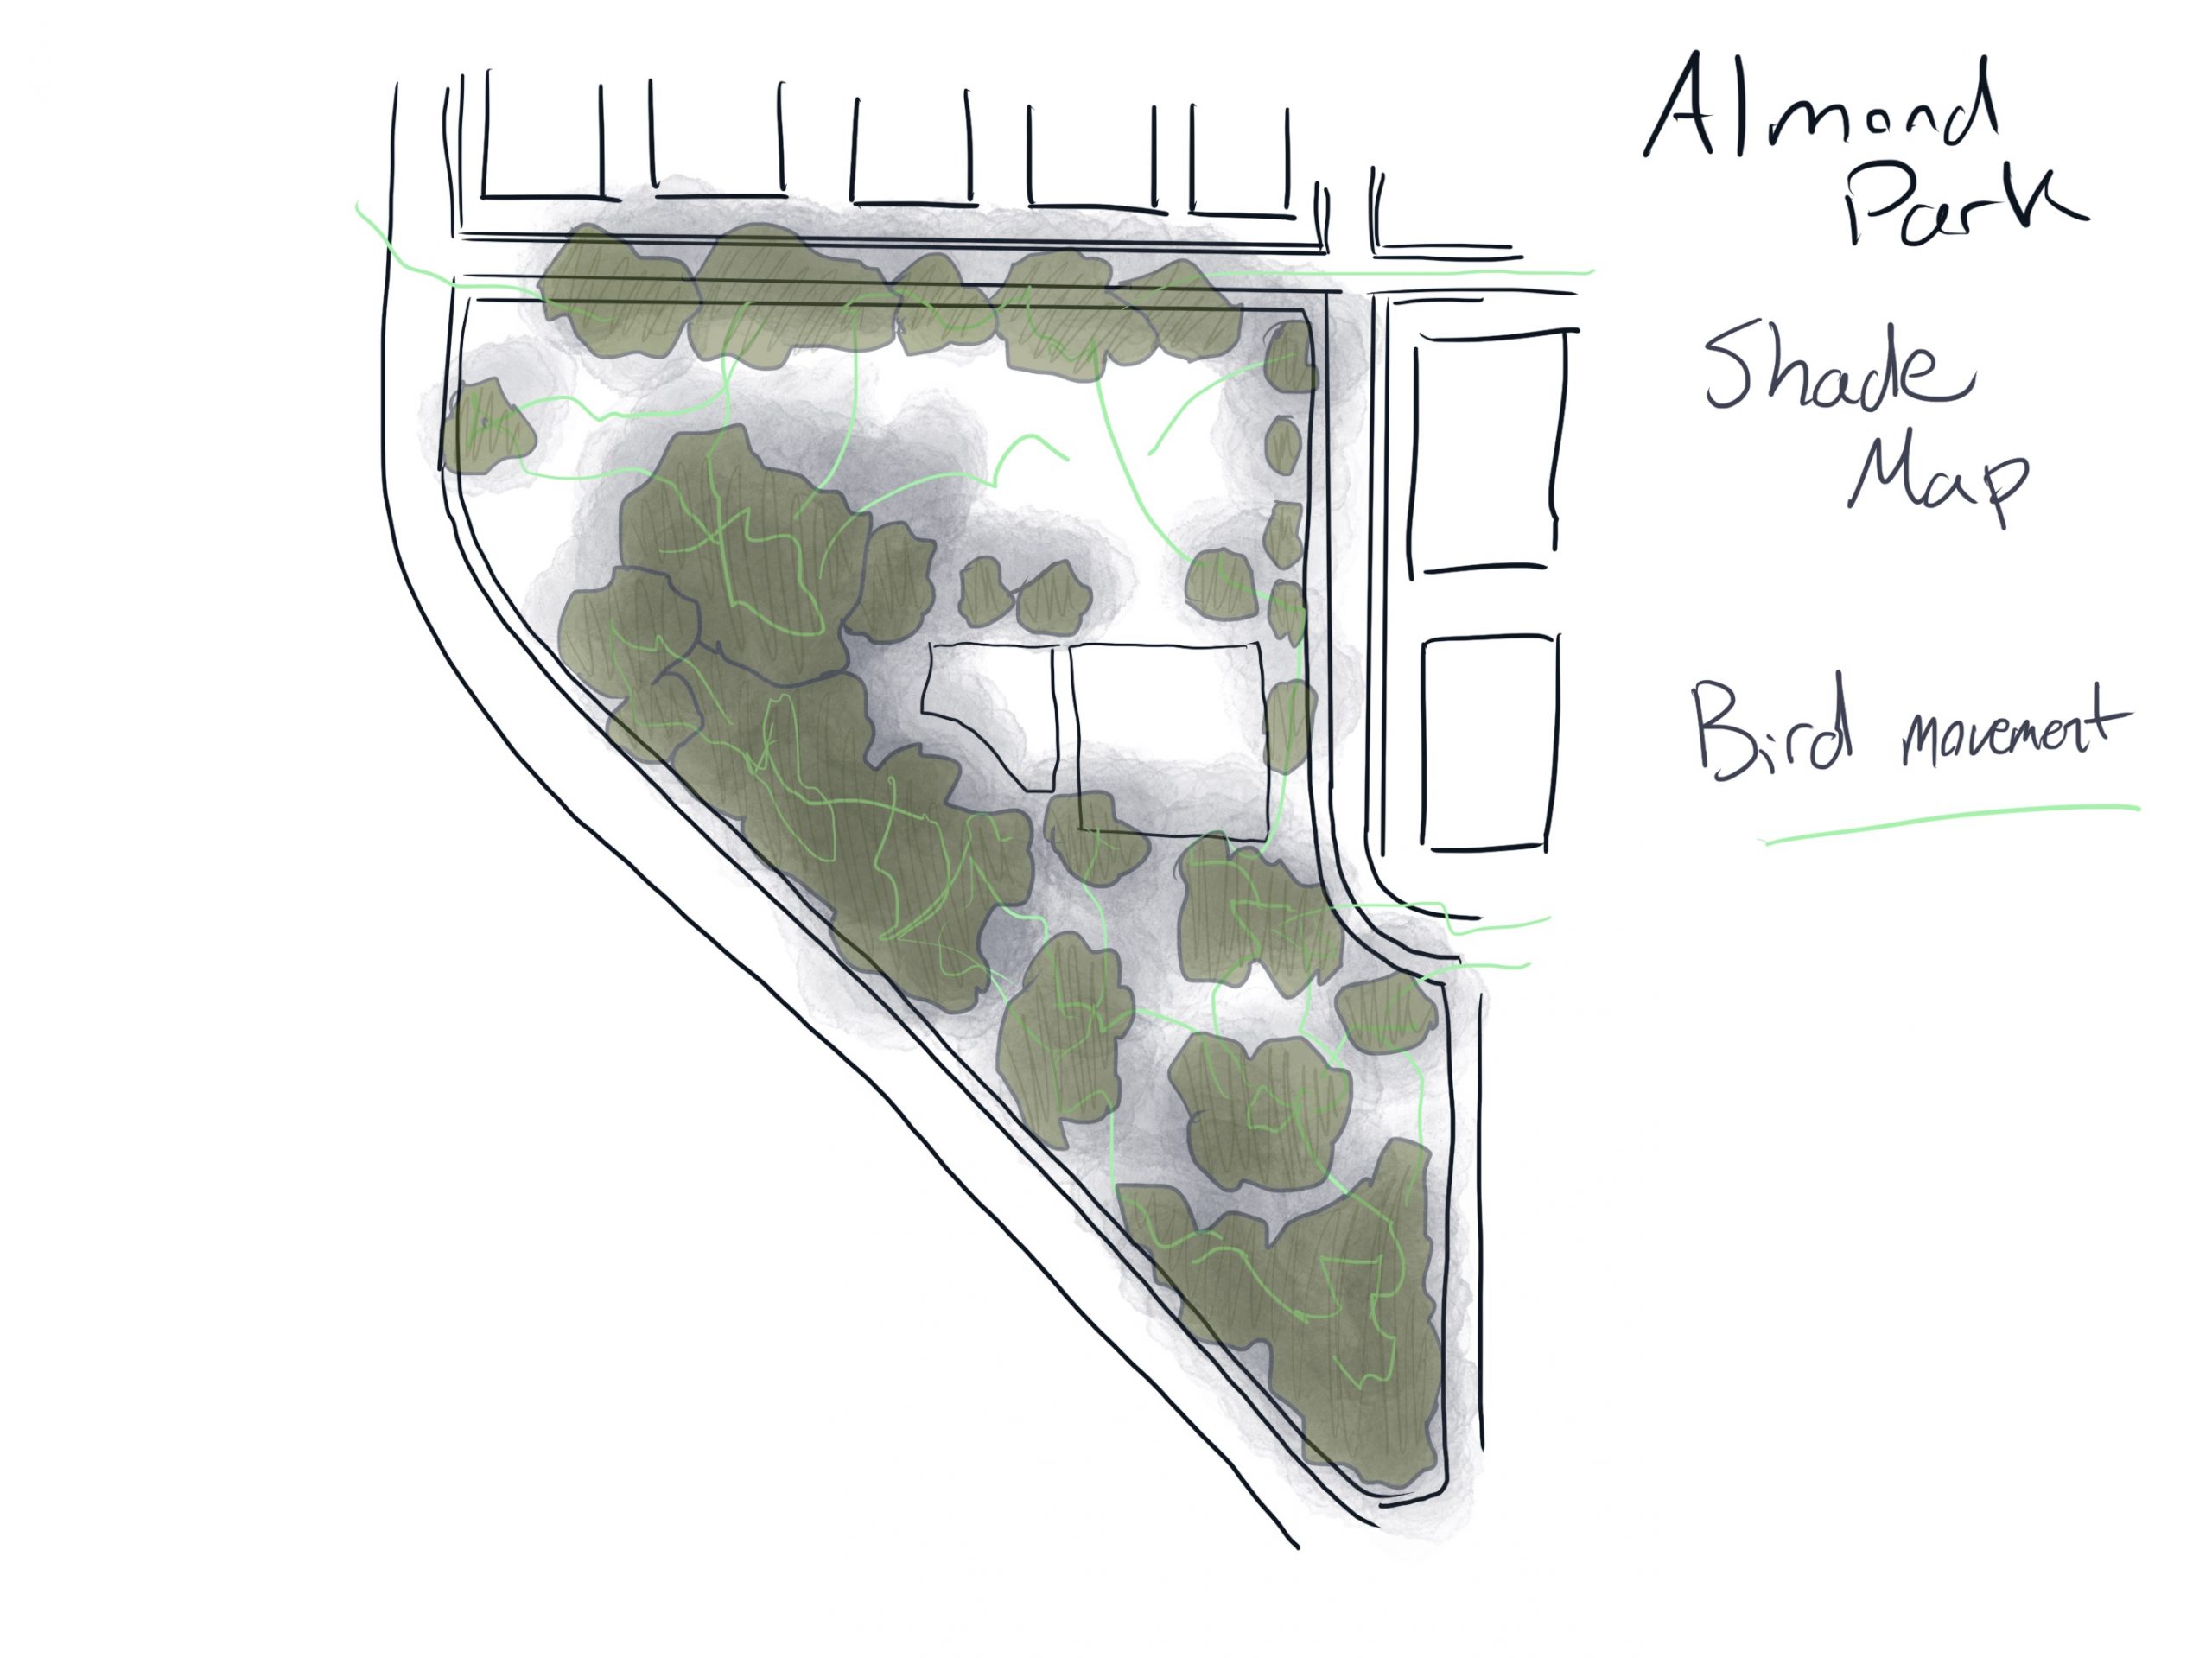
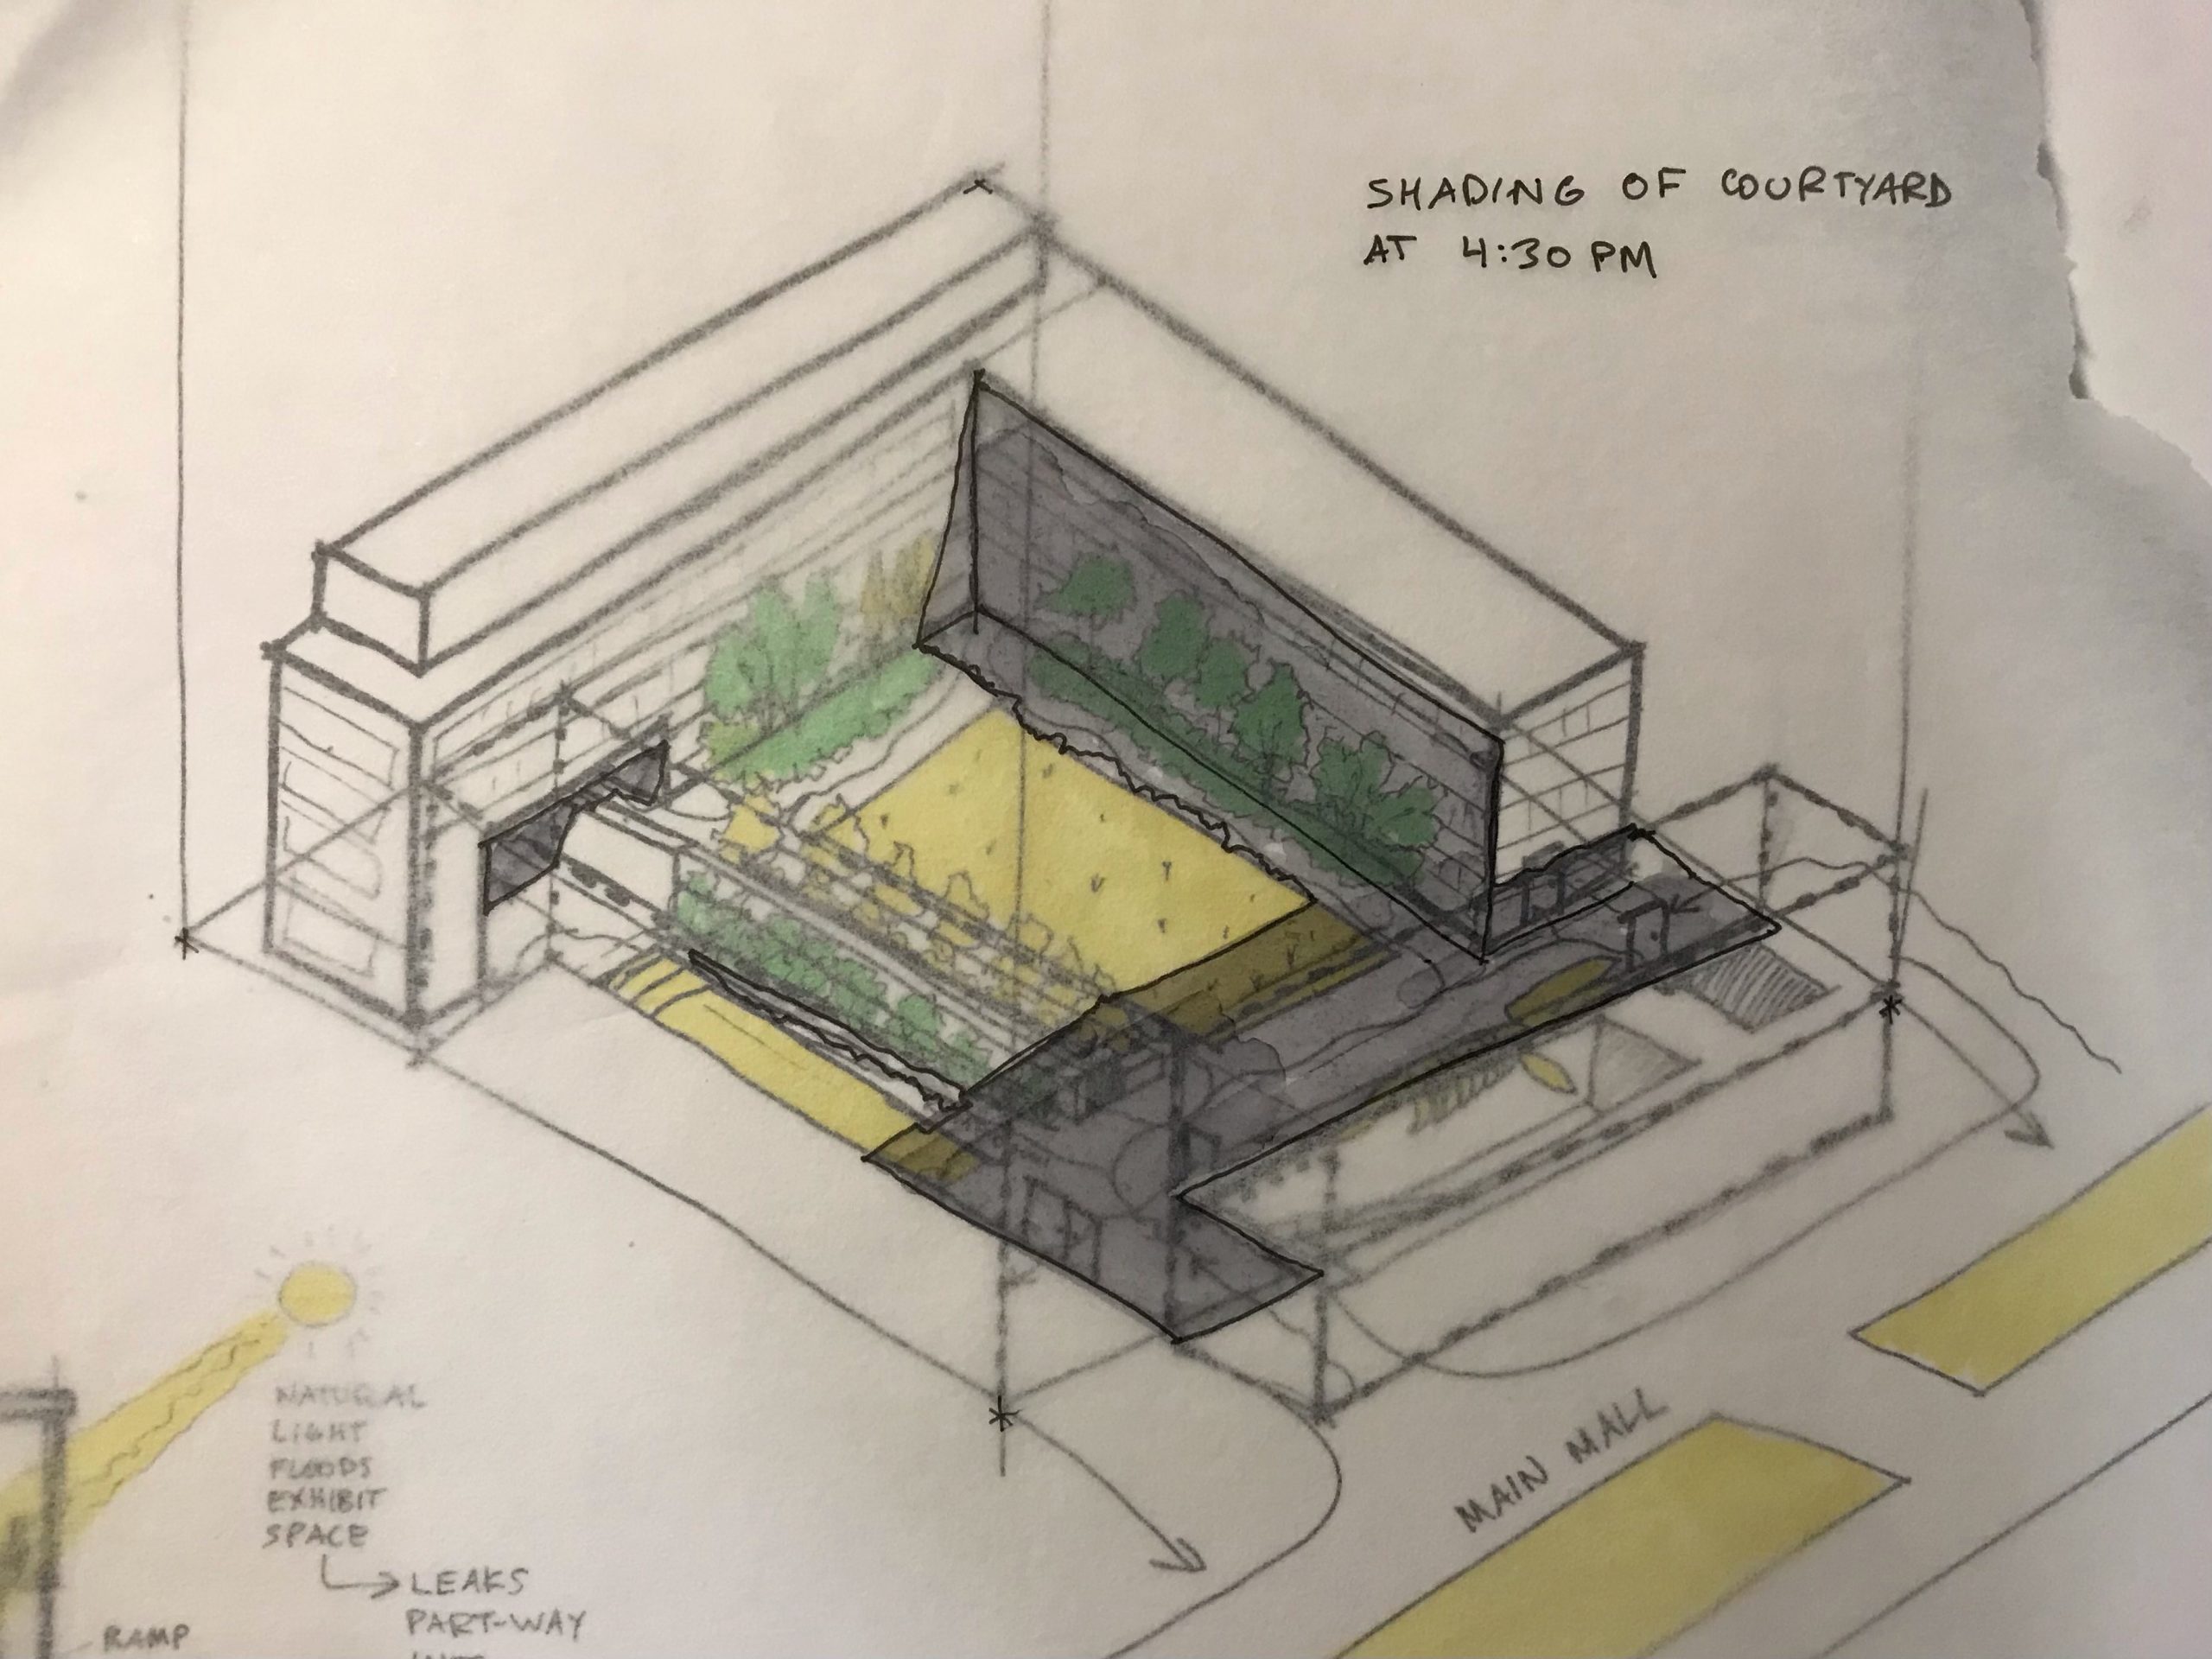
Views Down: Shadows Throughout the day
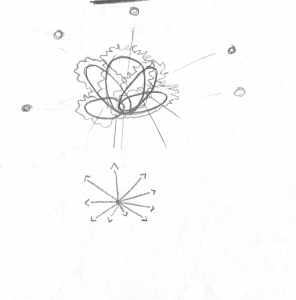
Movement of the birds and the bees
2 Hours of Clouds and Wind

People Moving Throughout the Roof
Sunflowers follow the Sun
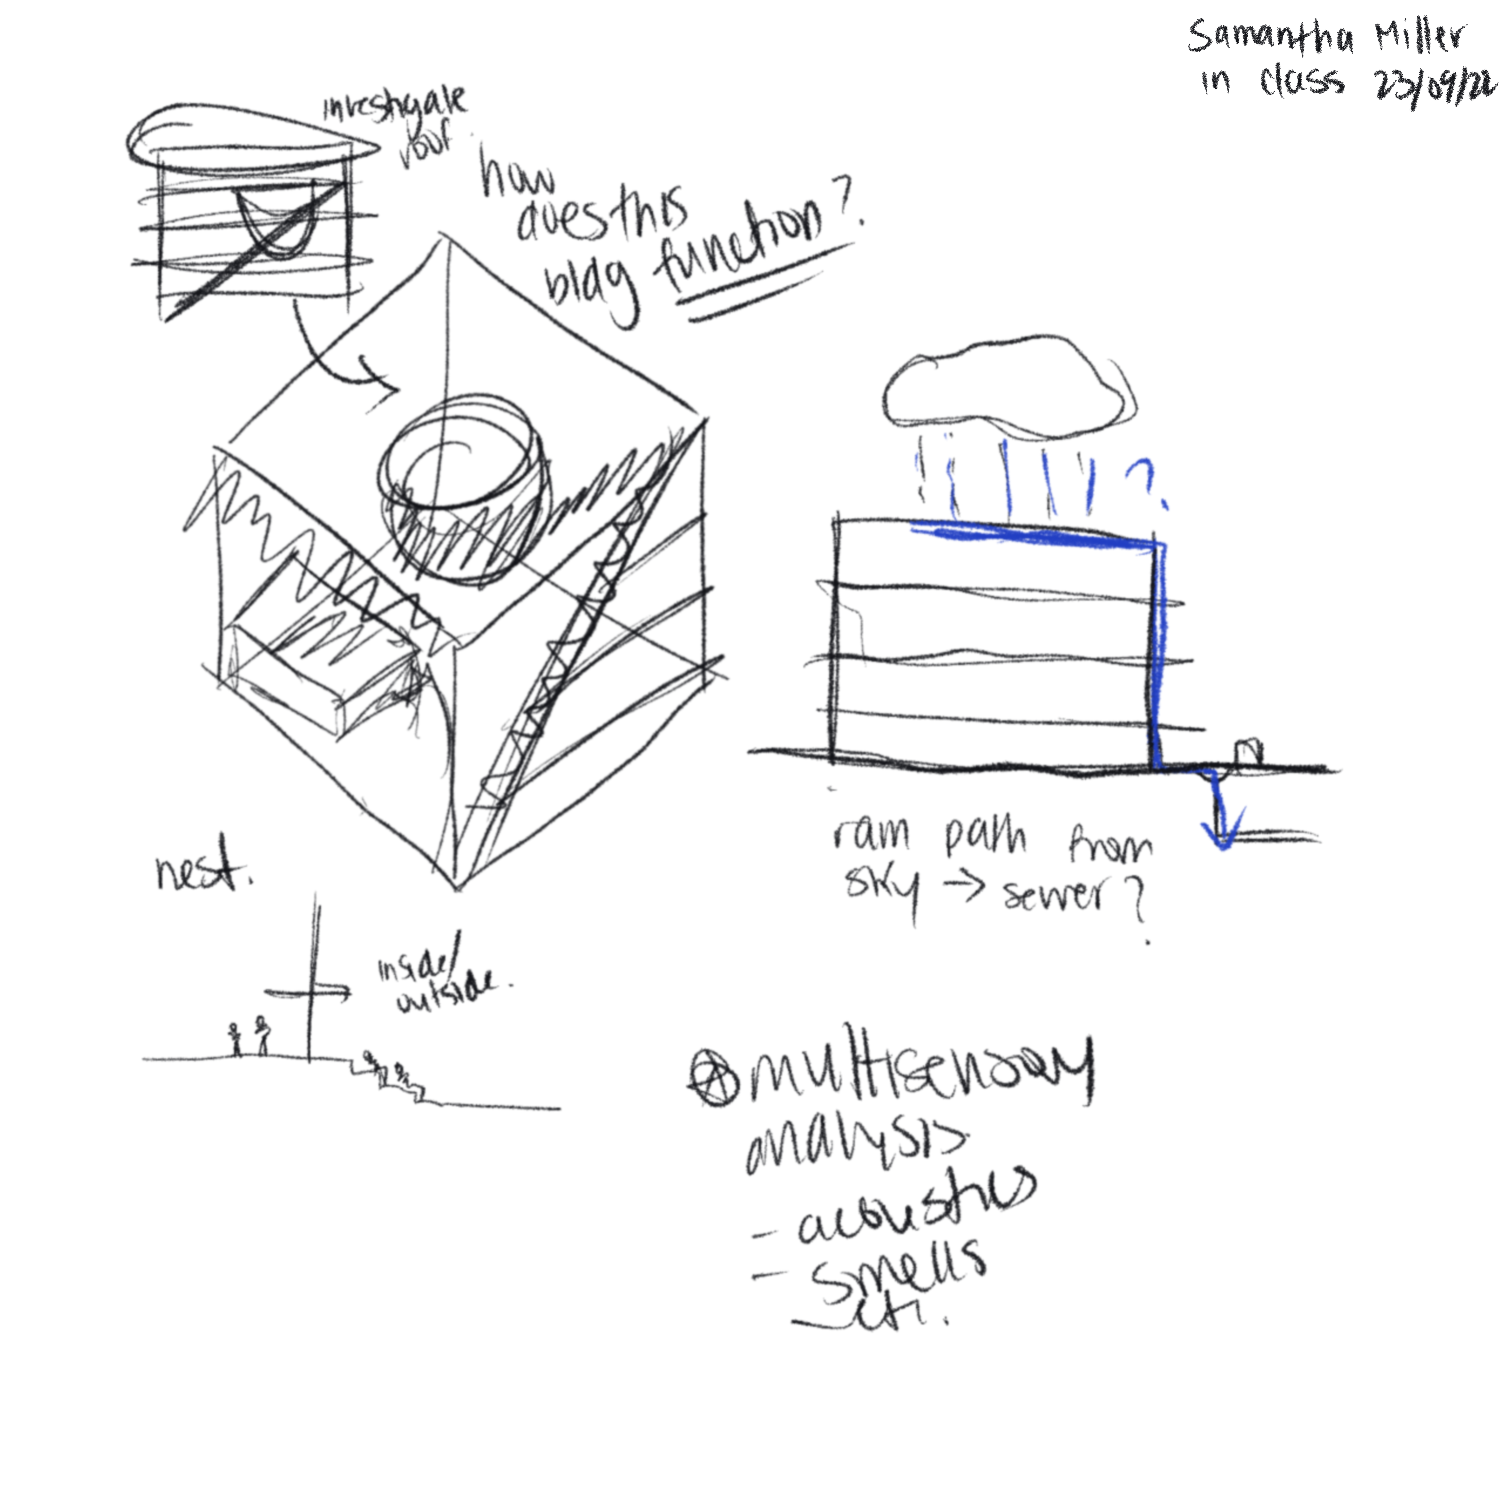
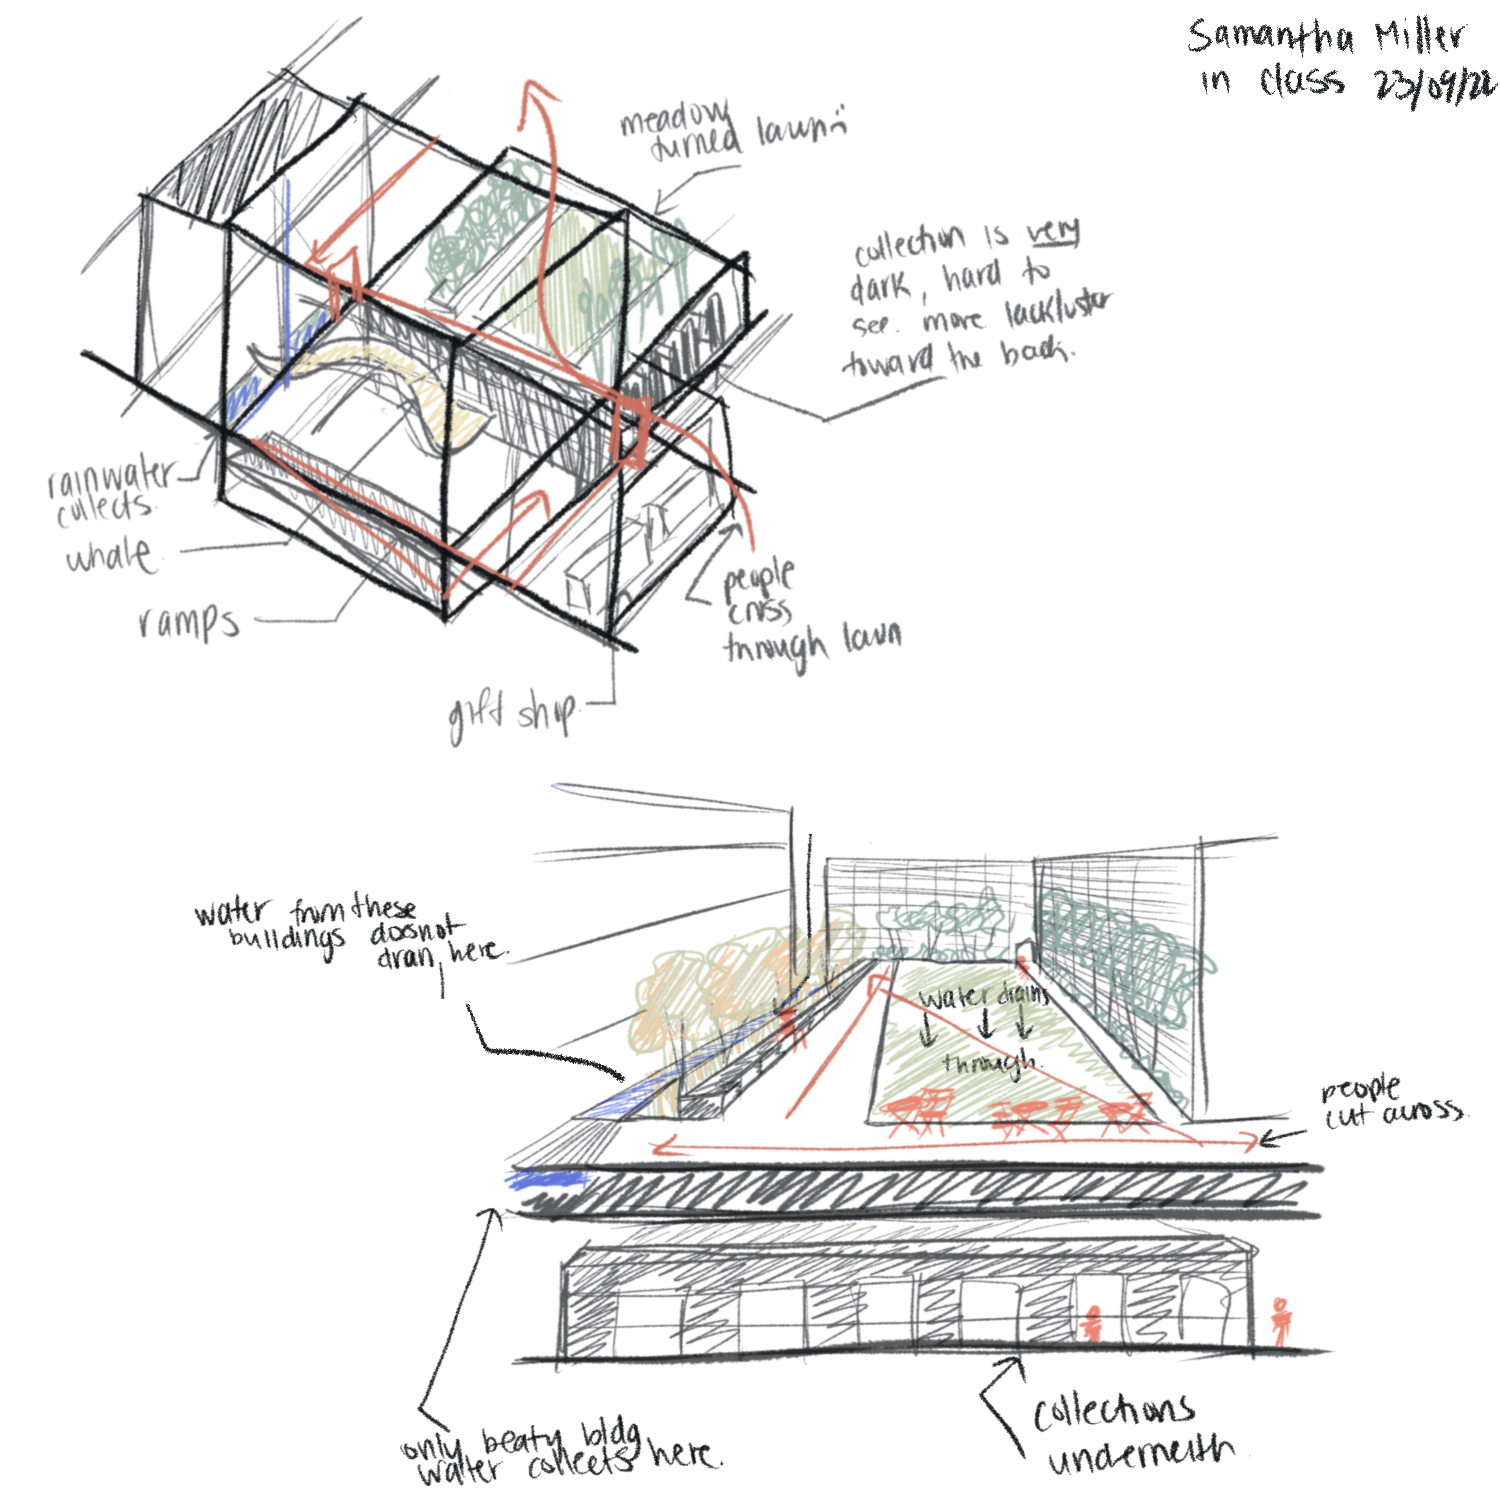
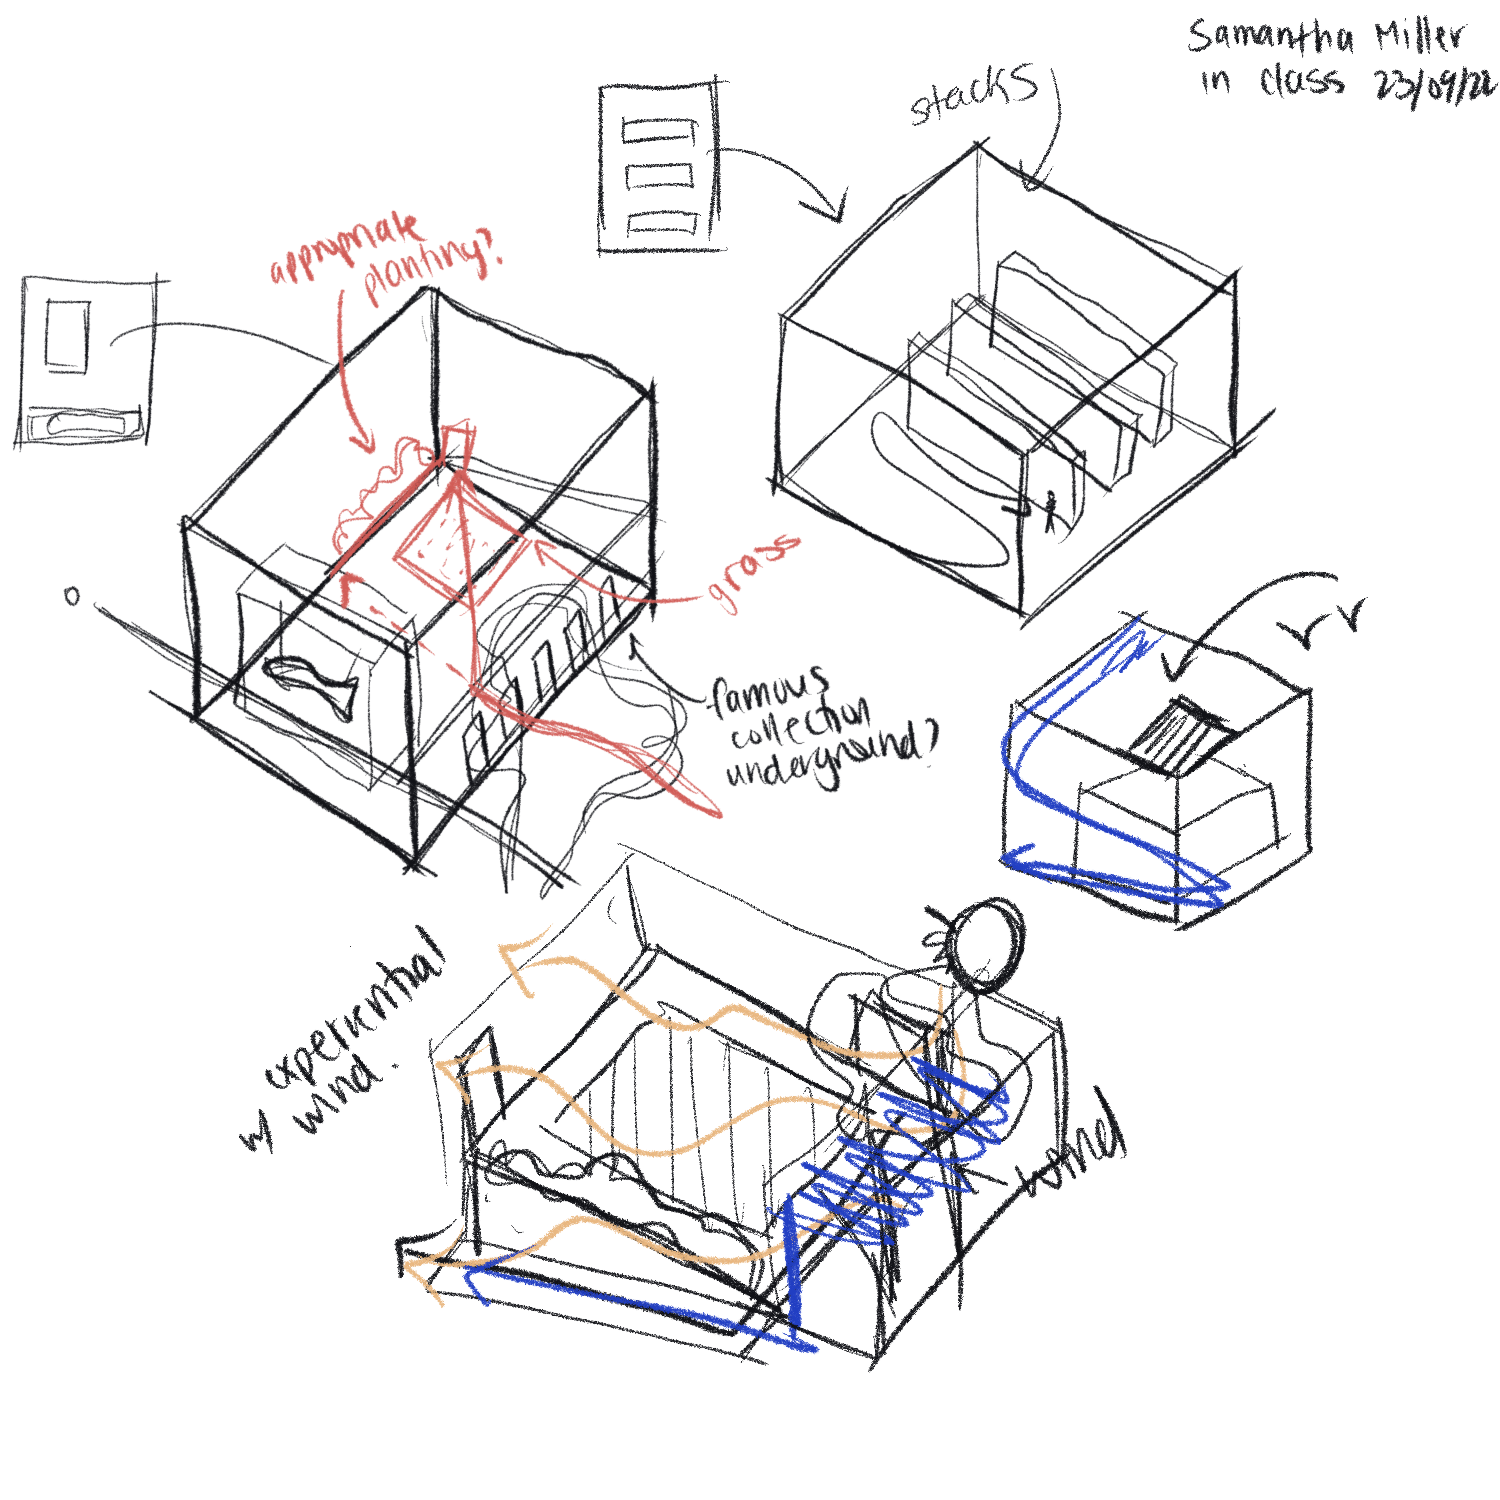
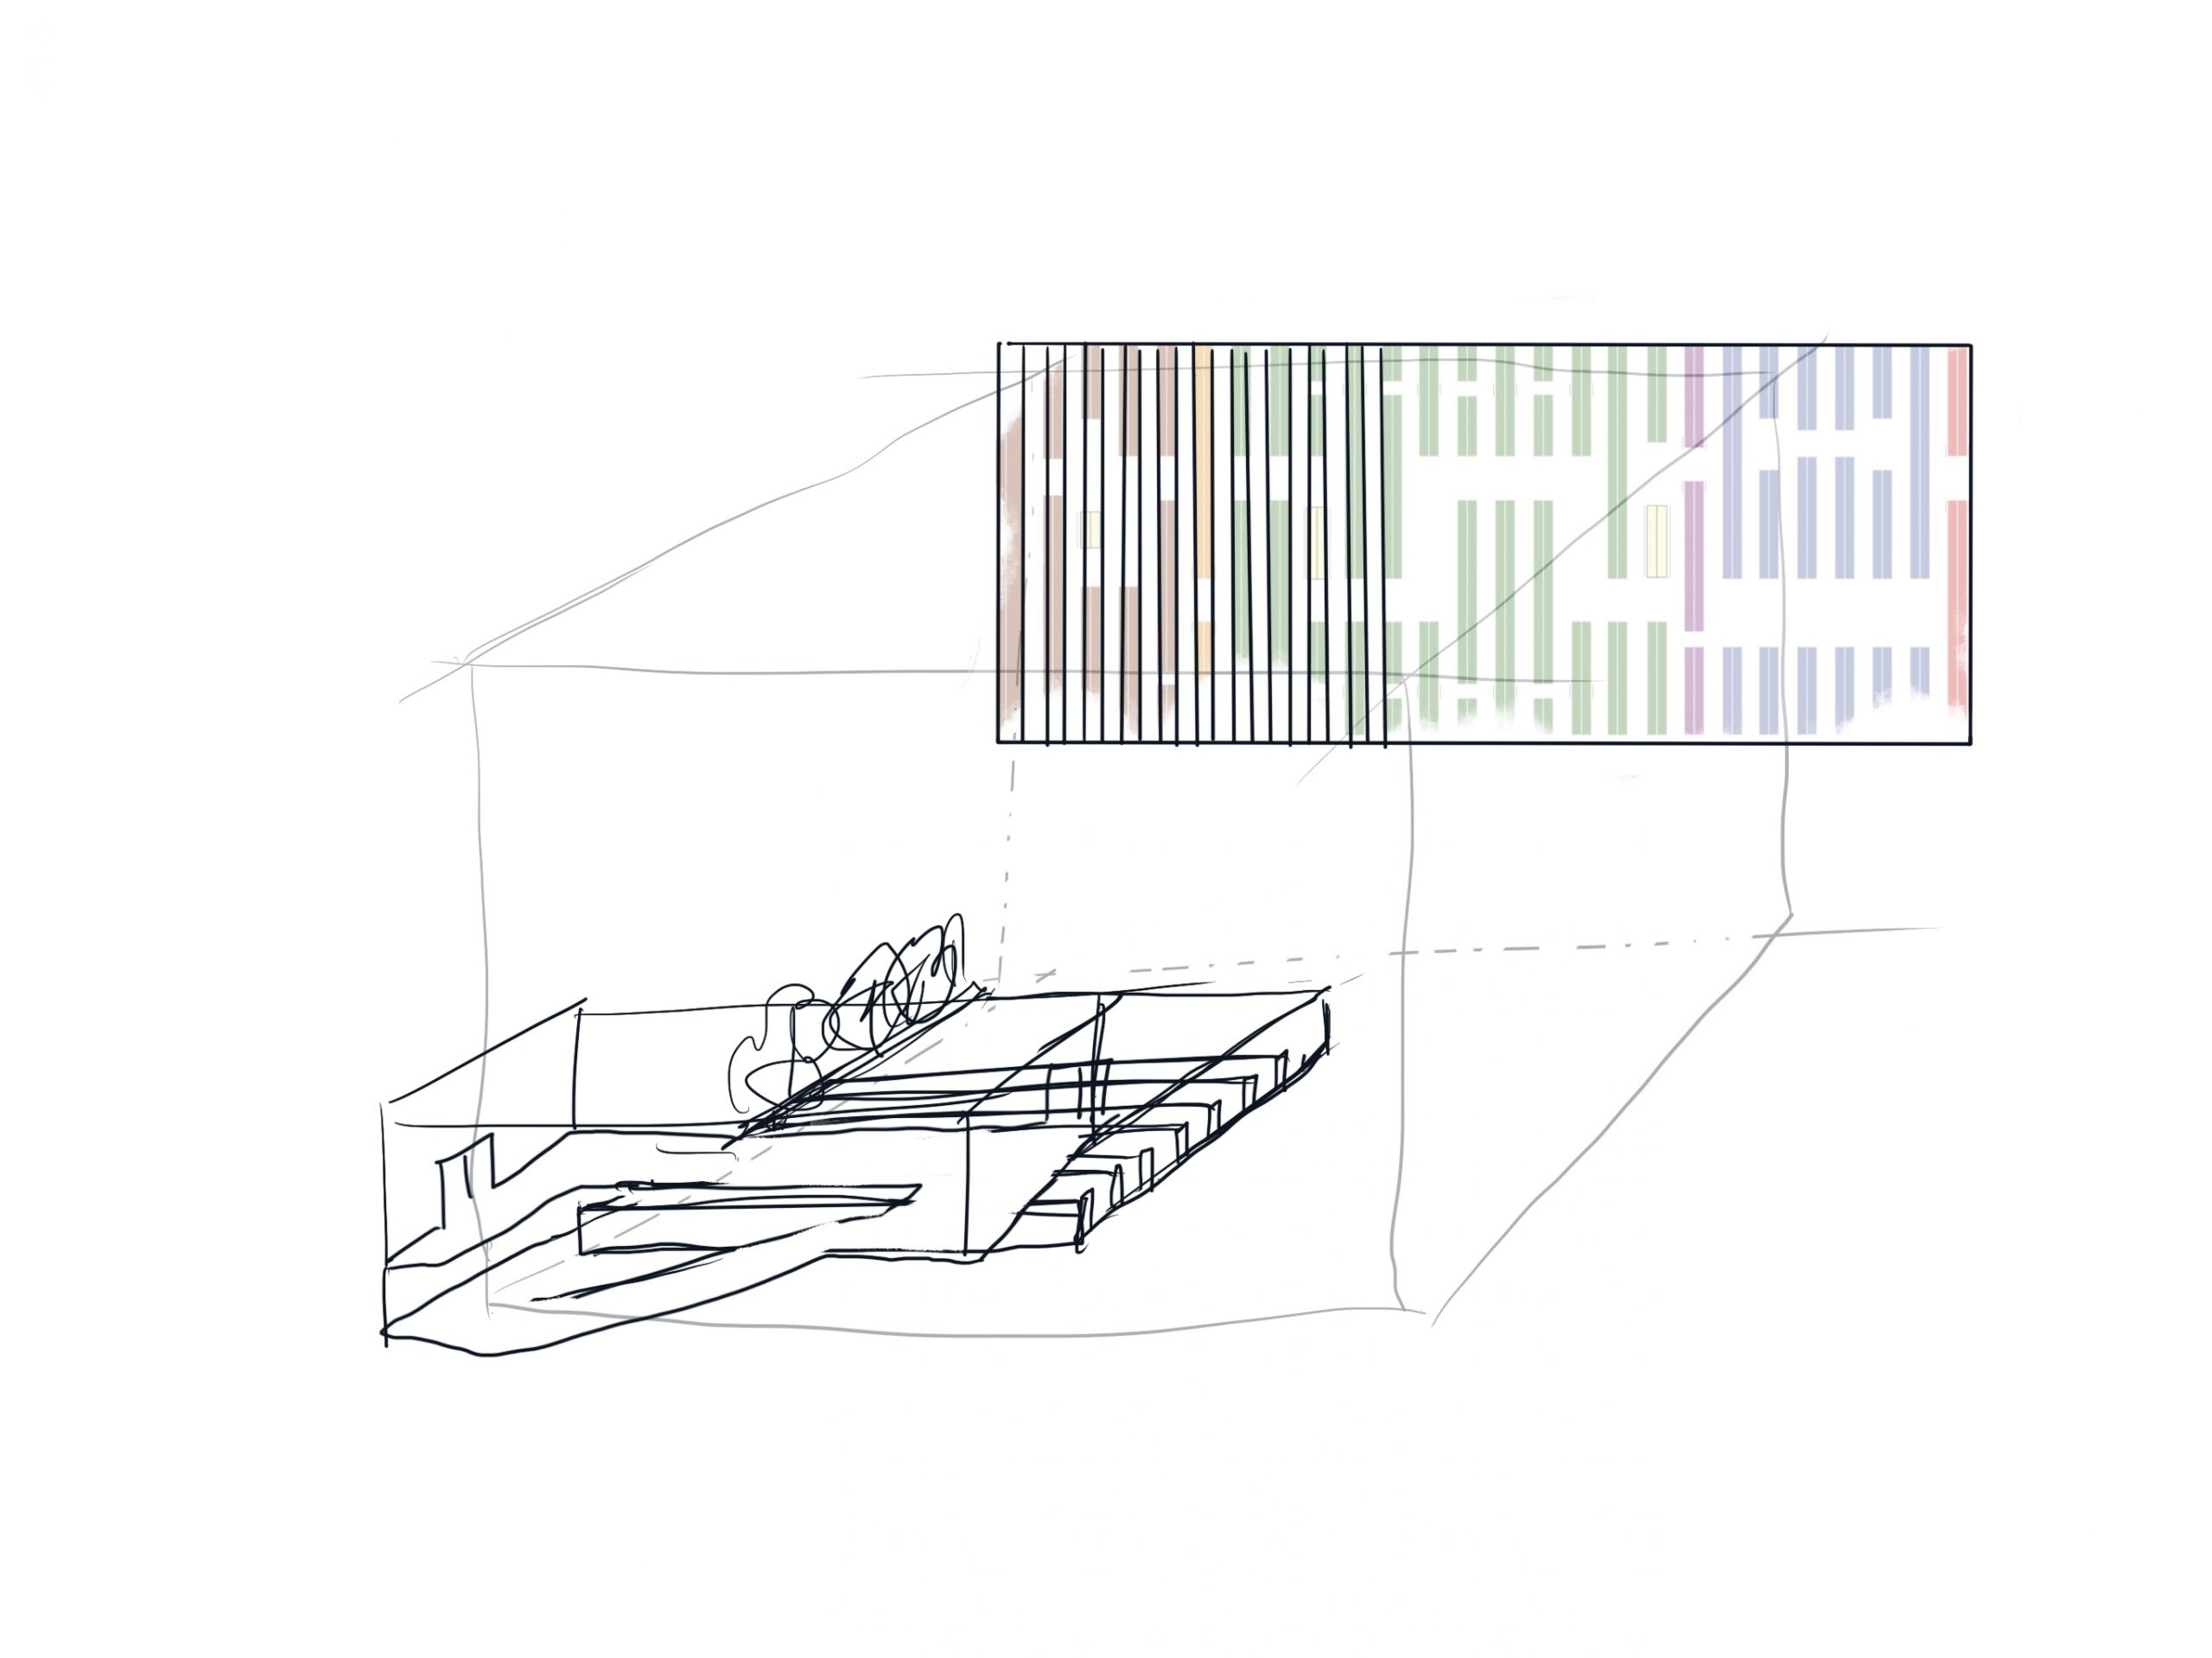
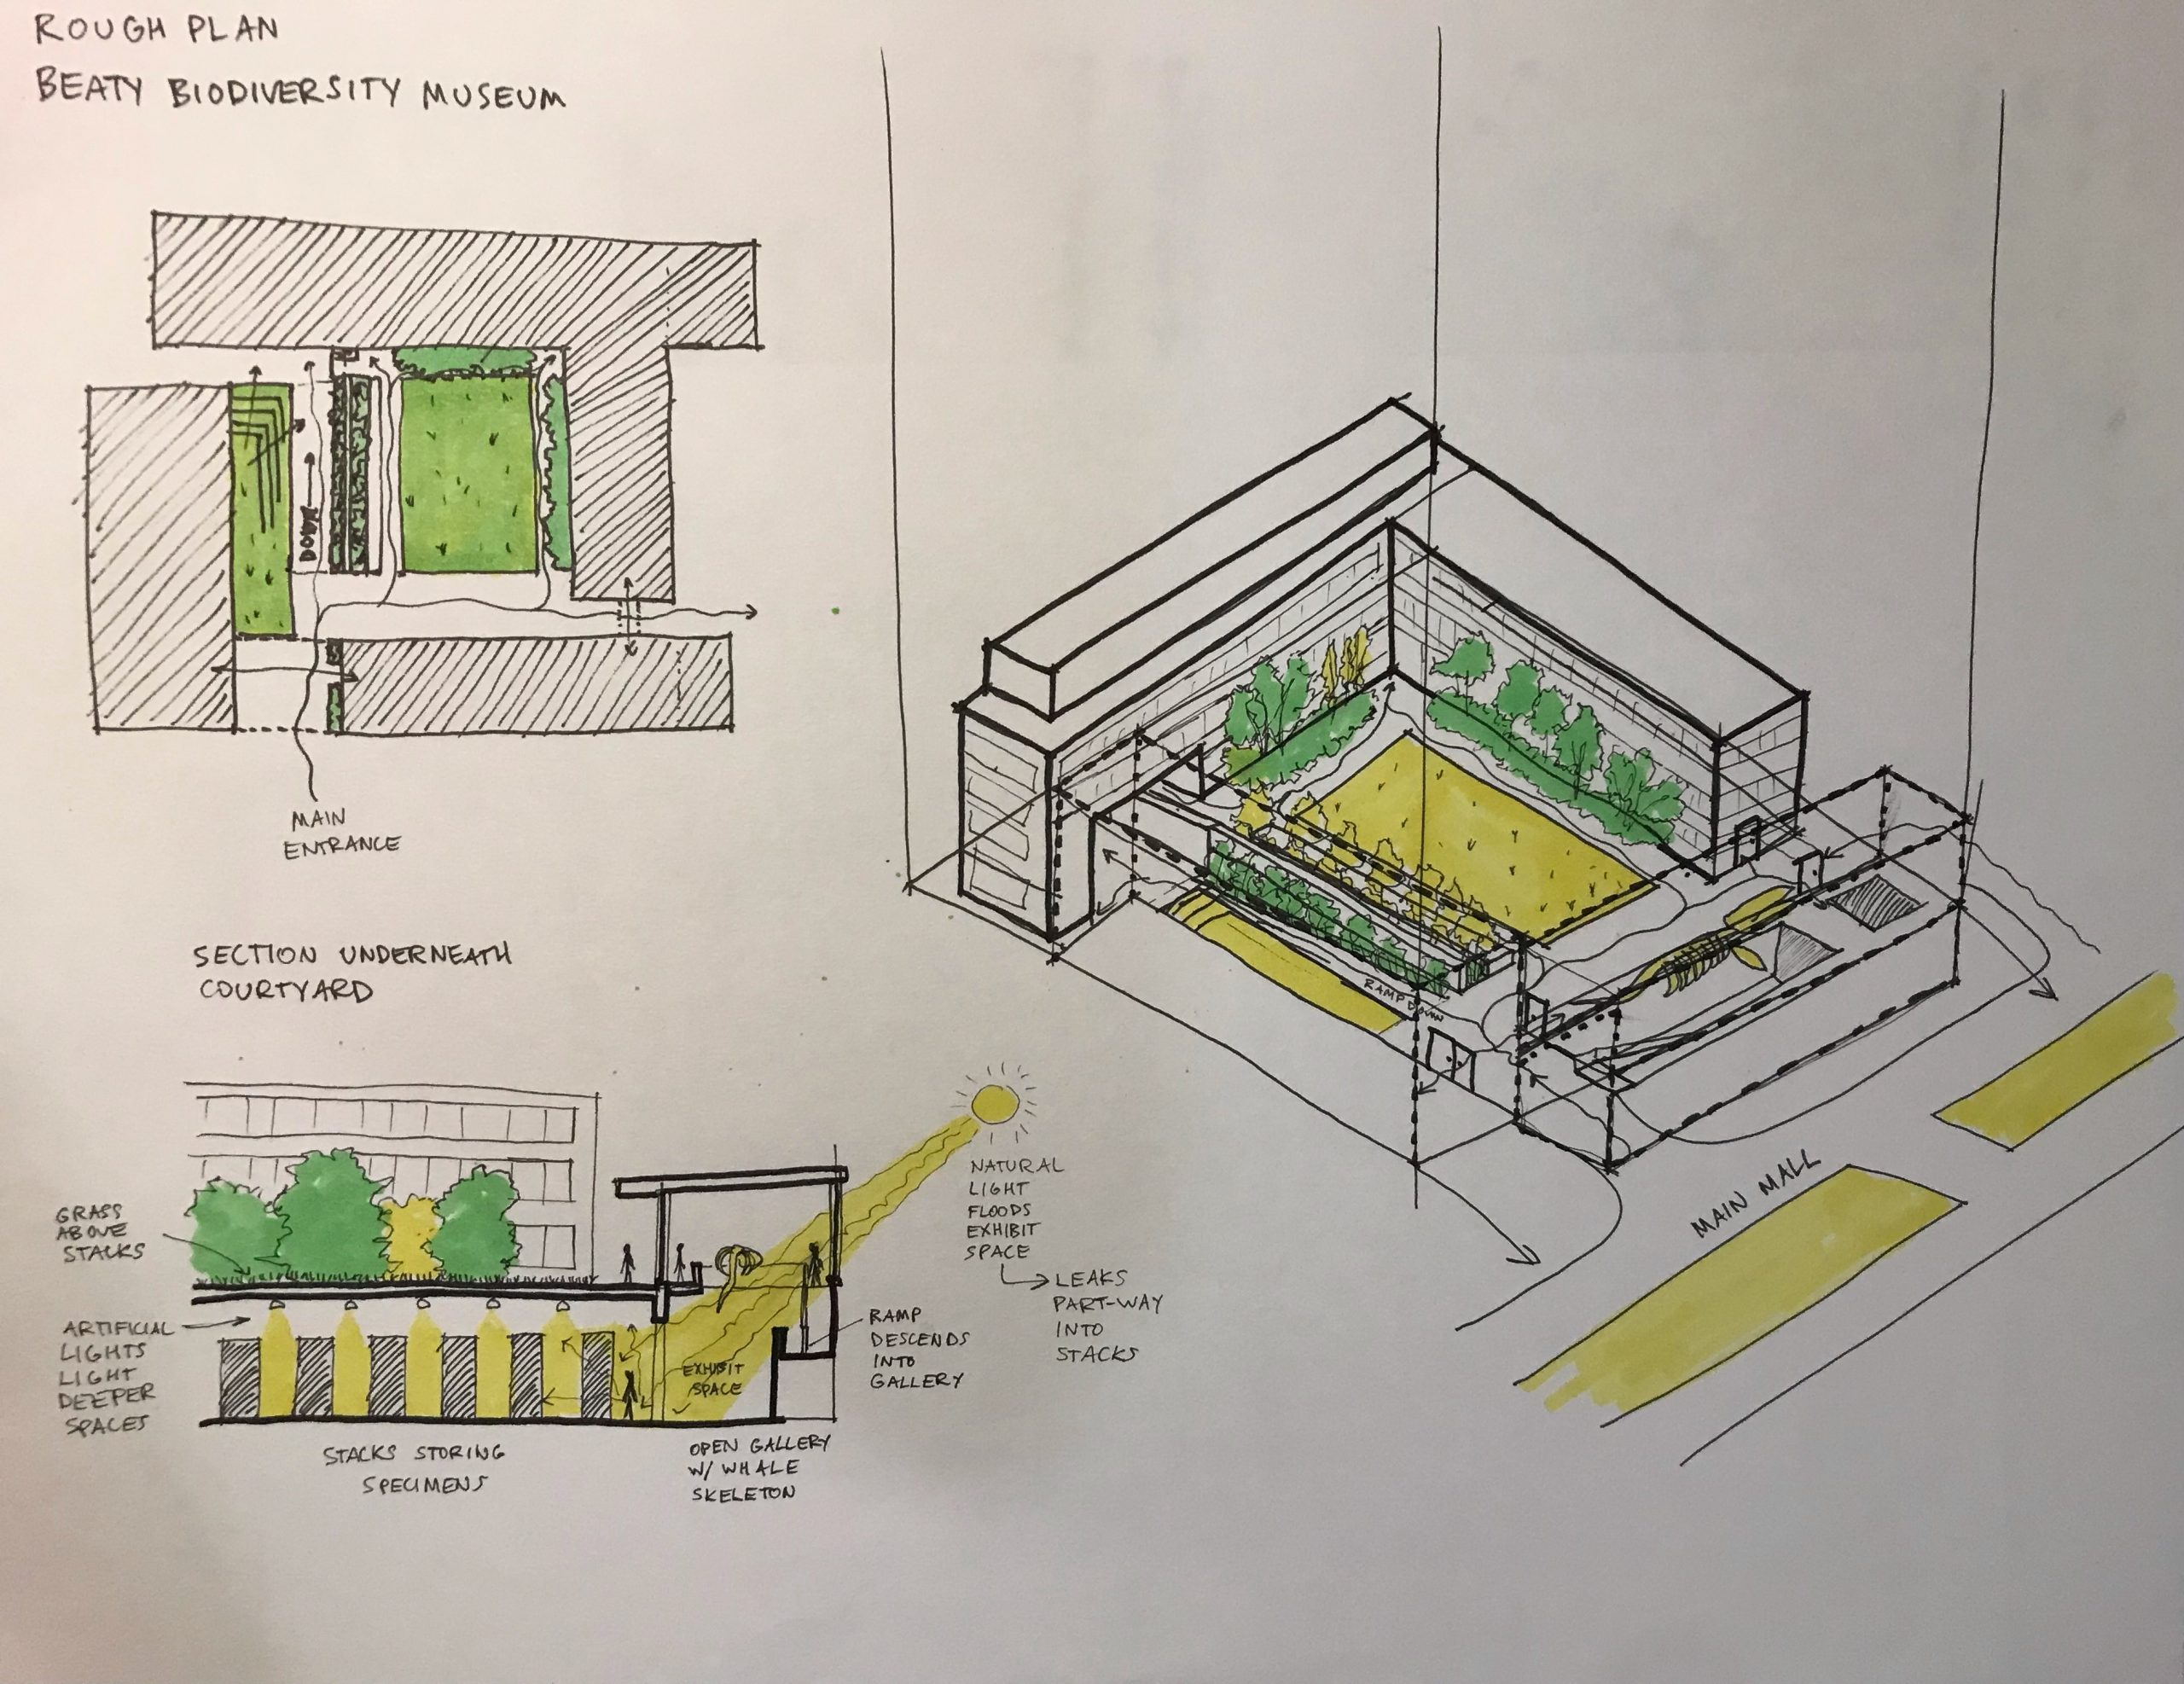
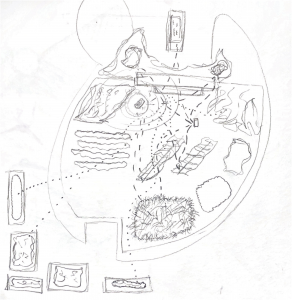
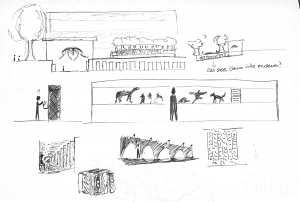
In Class Drawing from UBC Nest and Beatty Museum
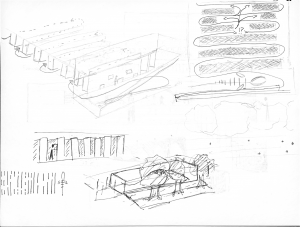

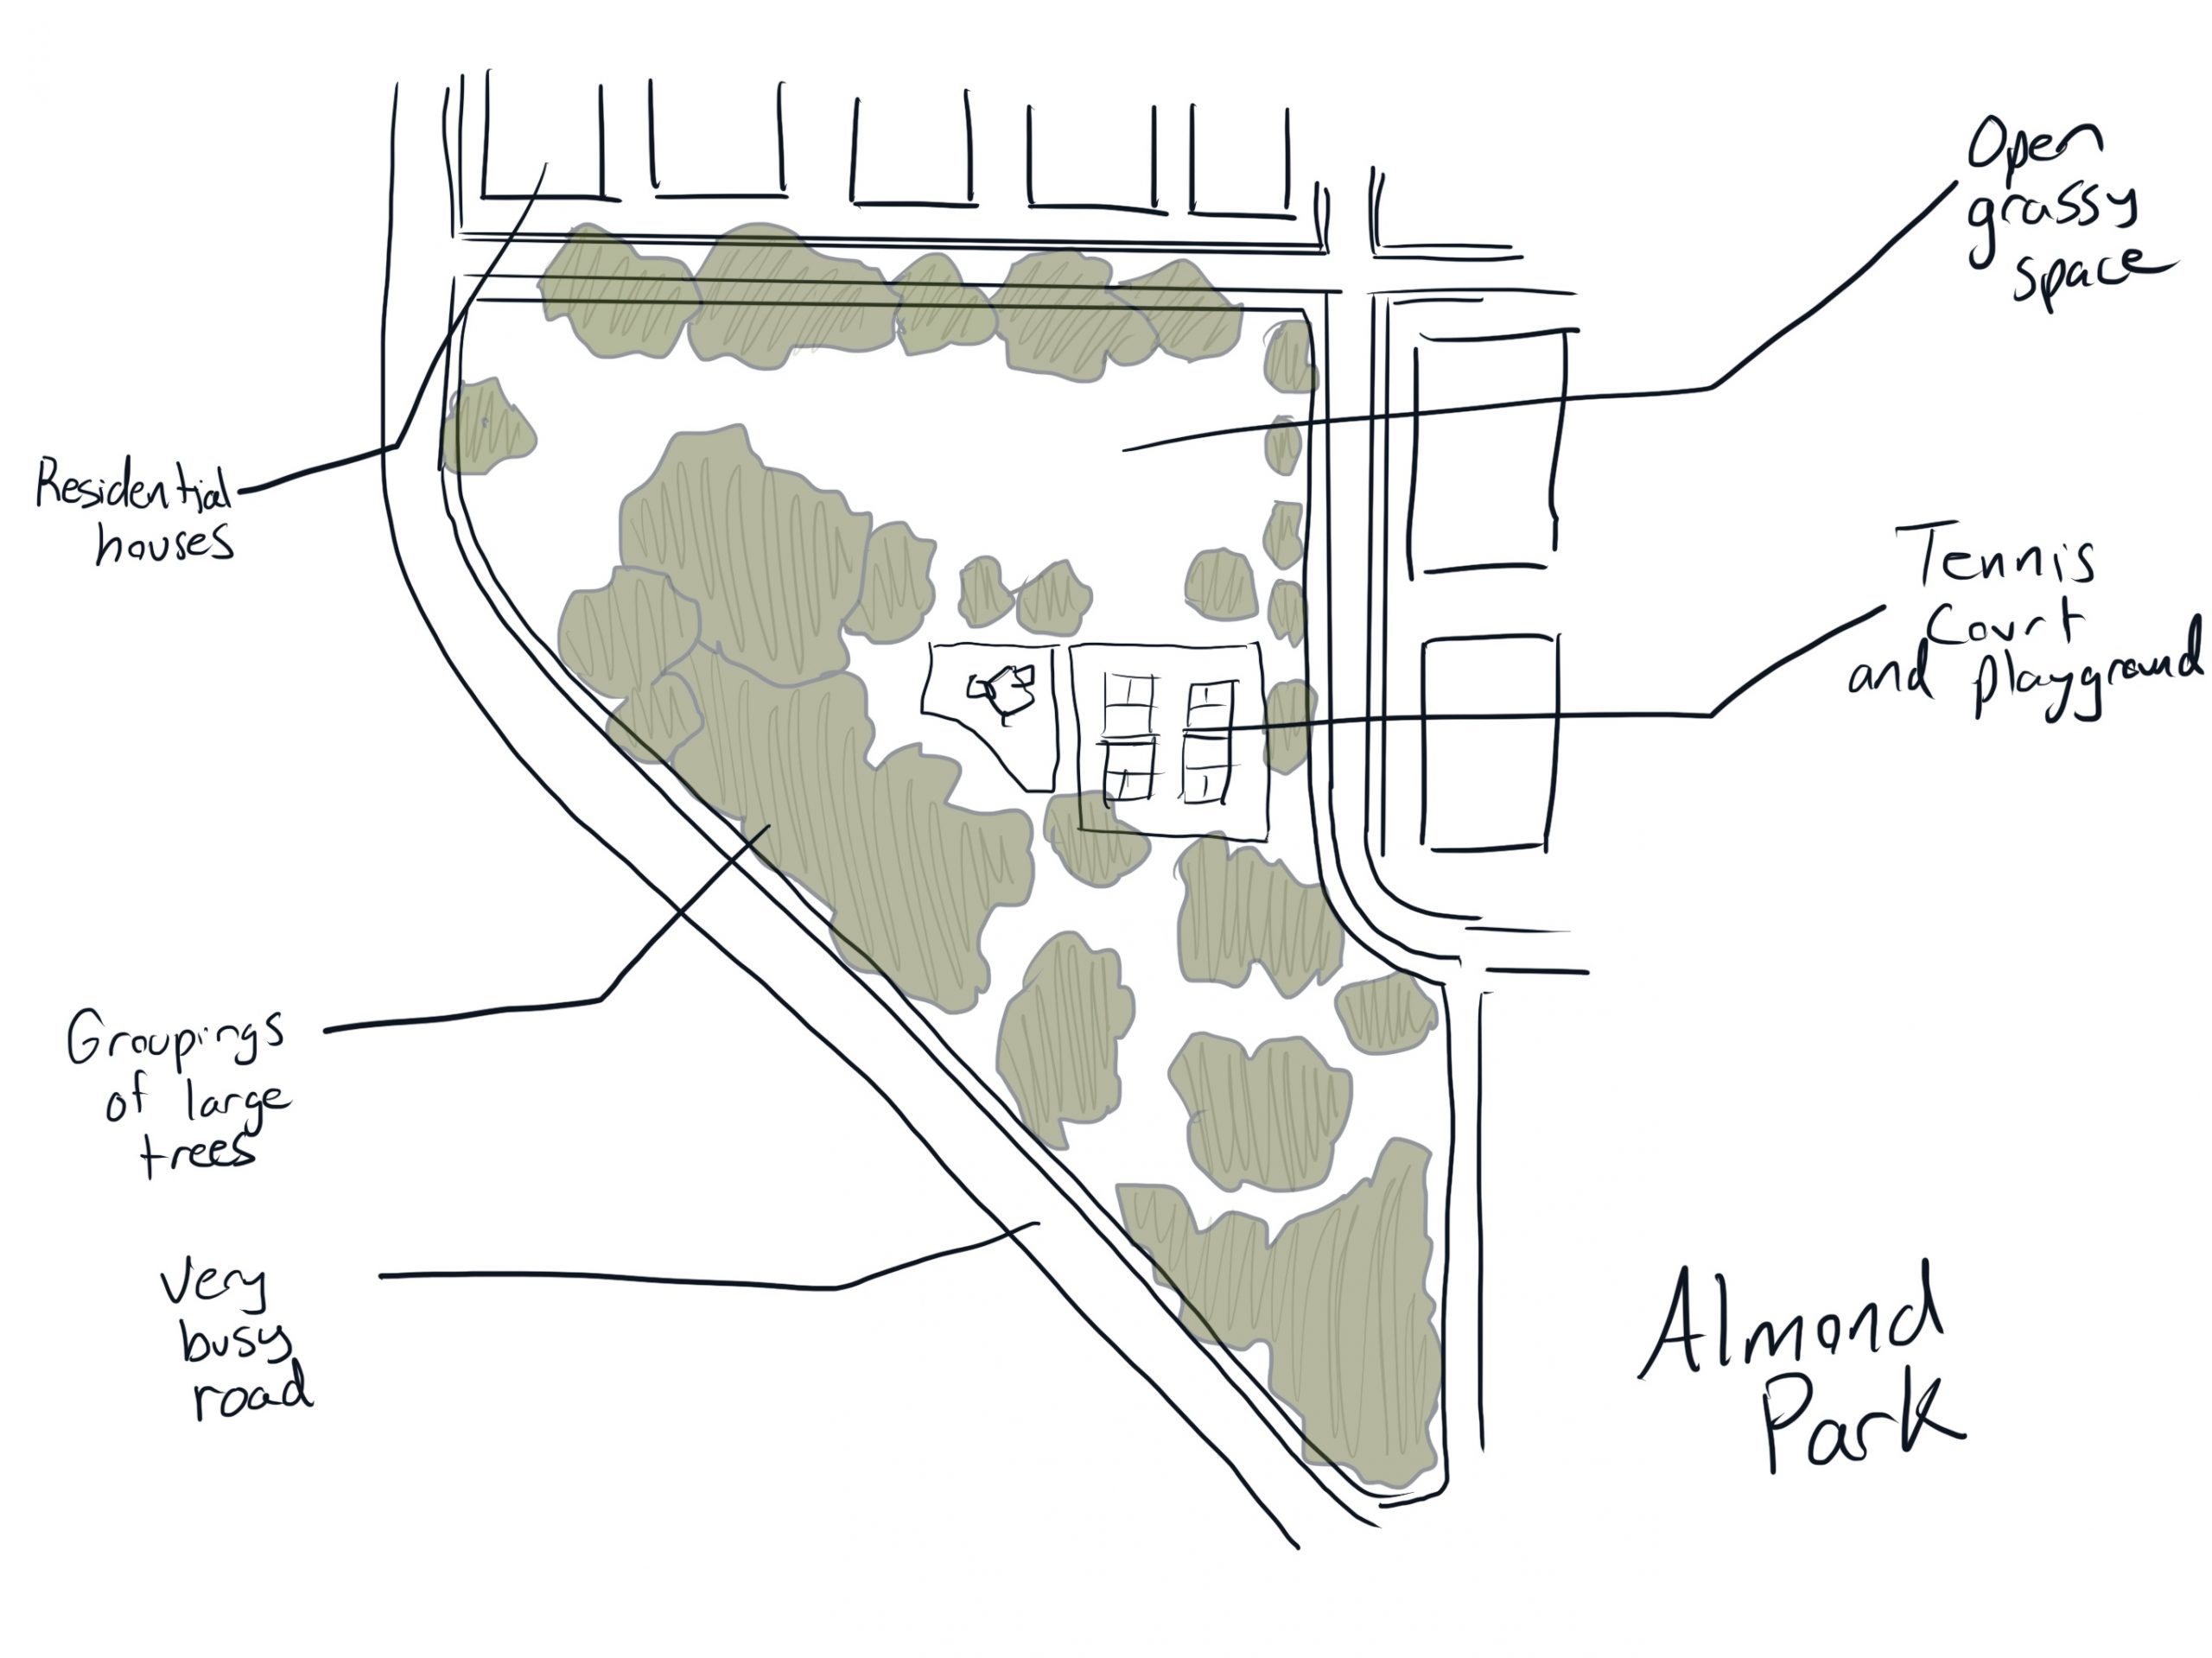
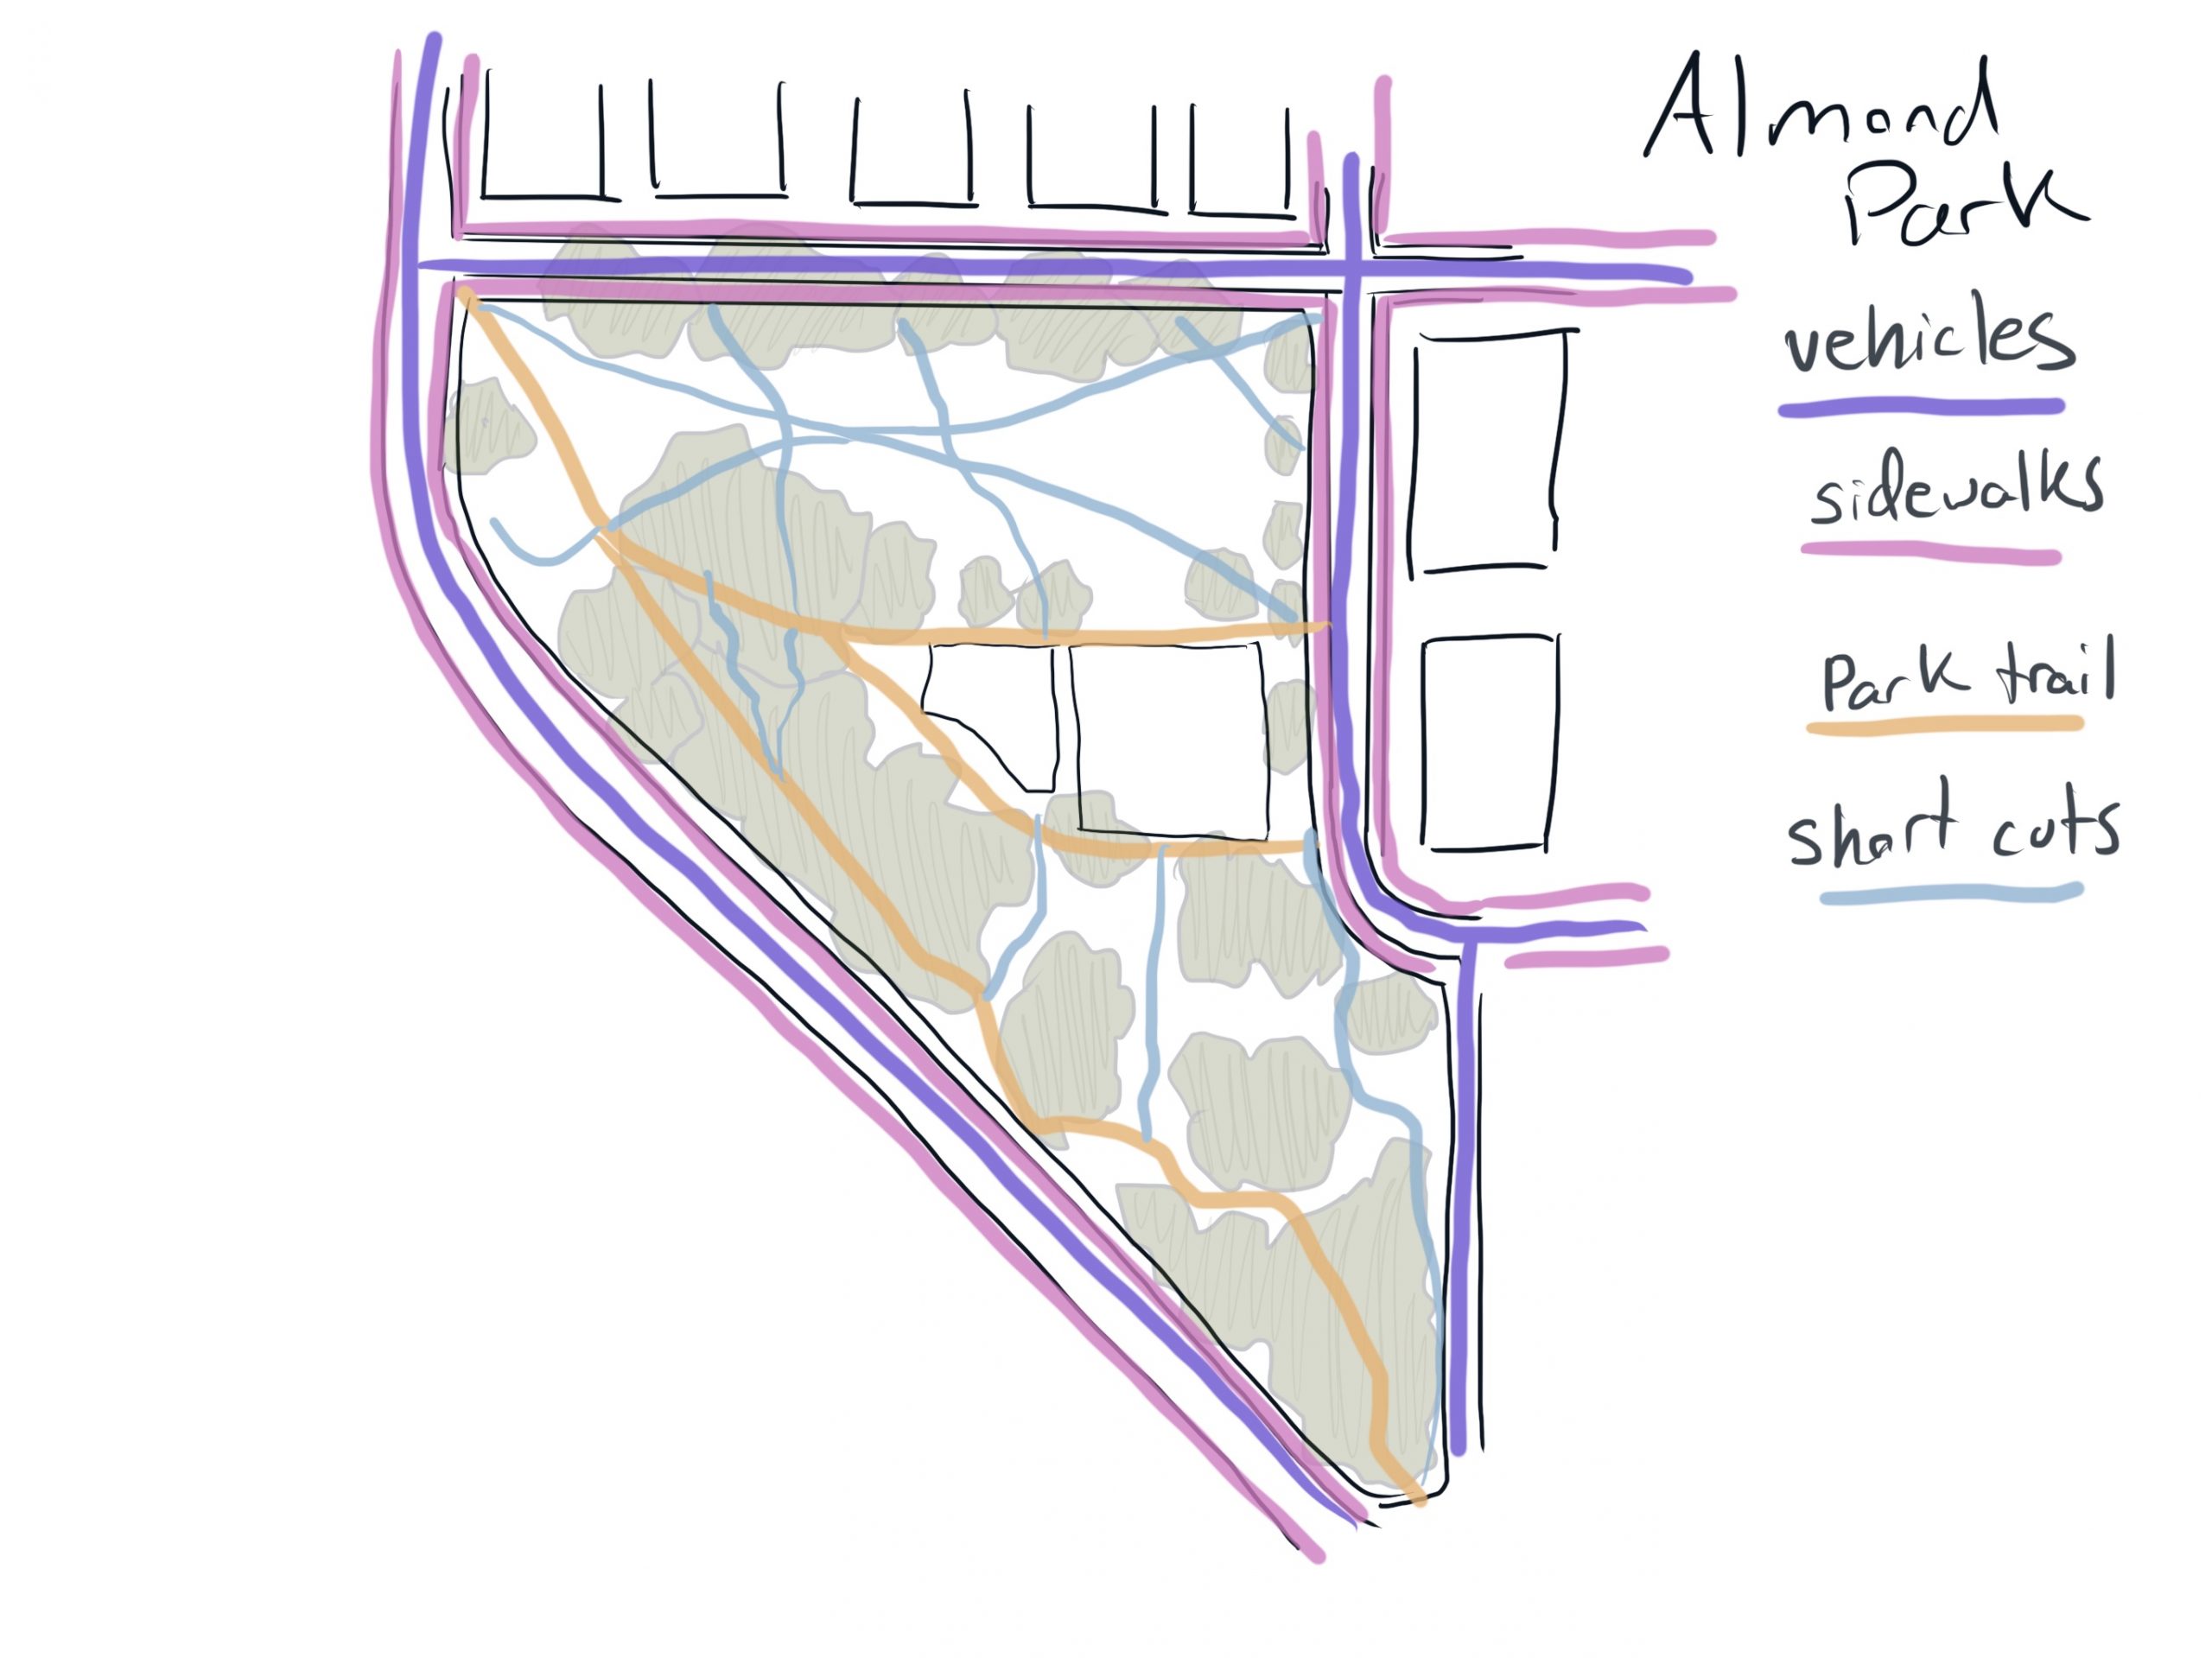
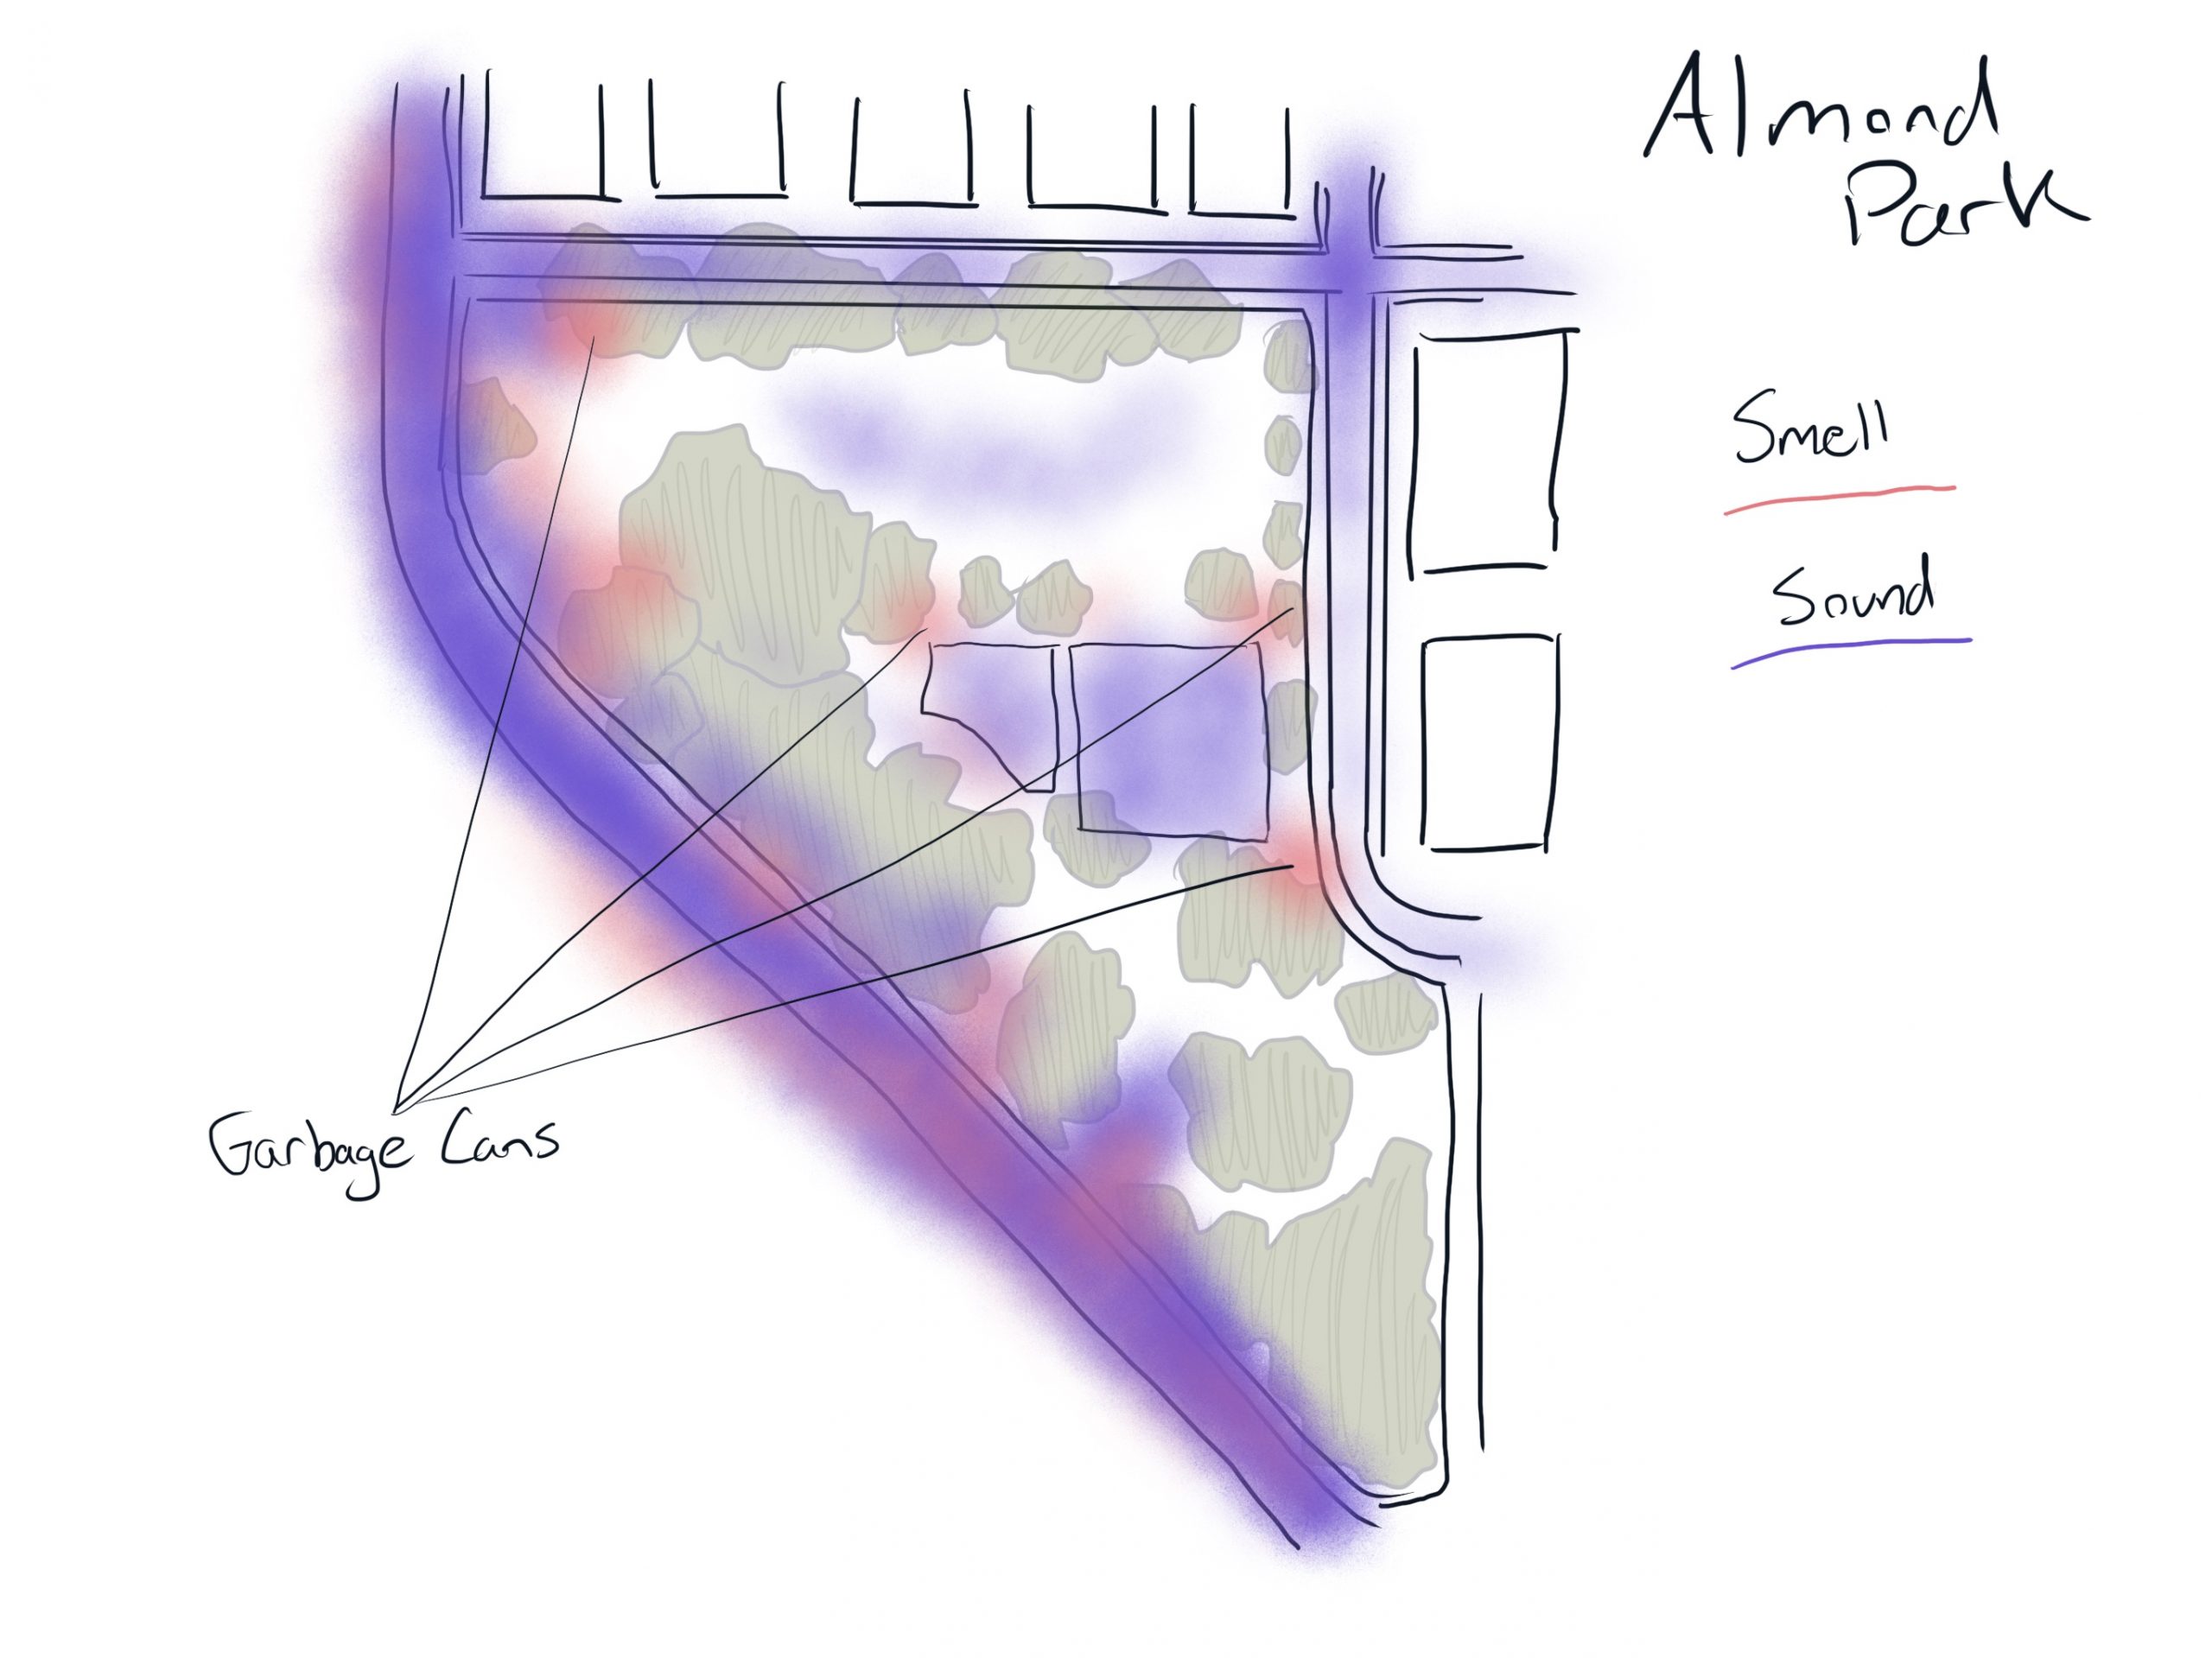
Beatty Circulation Networks
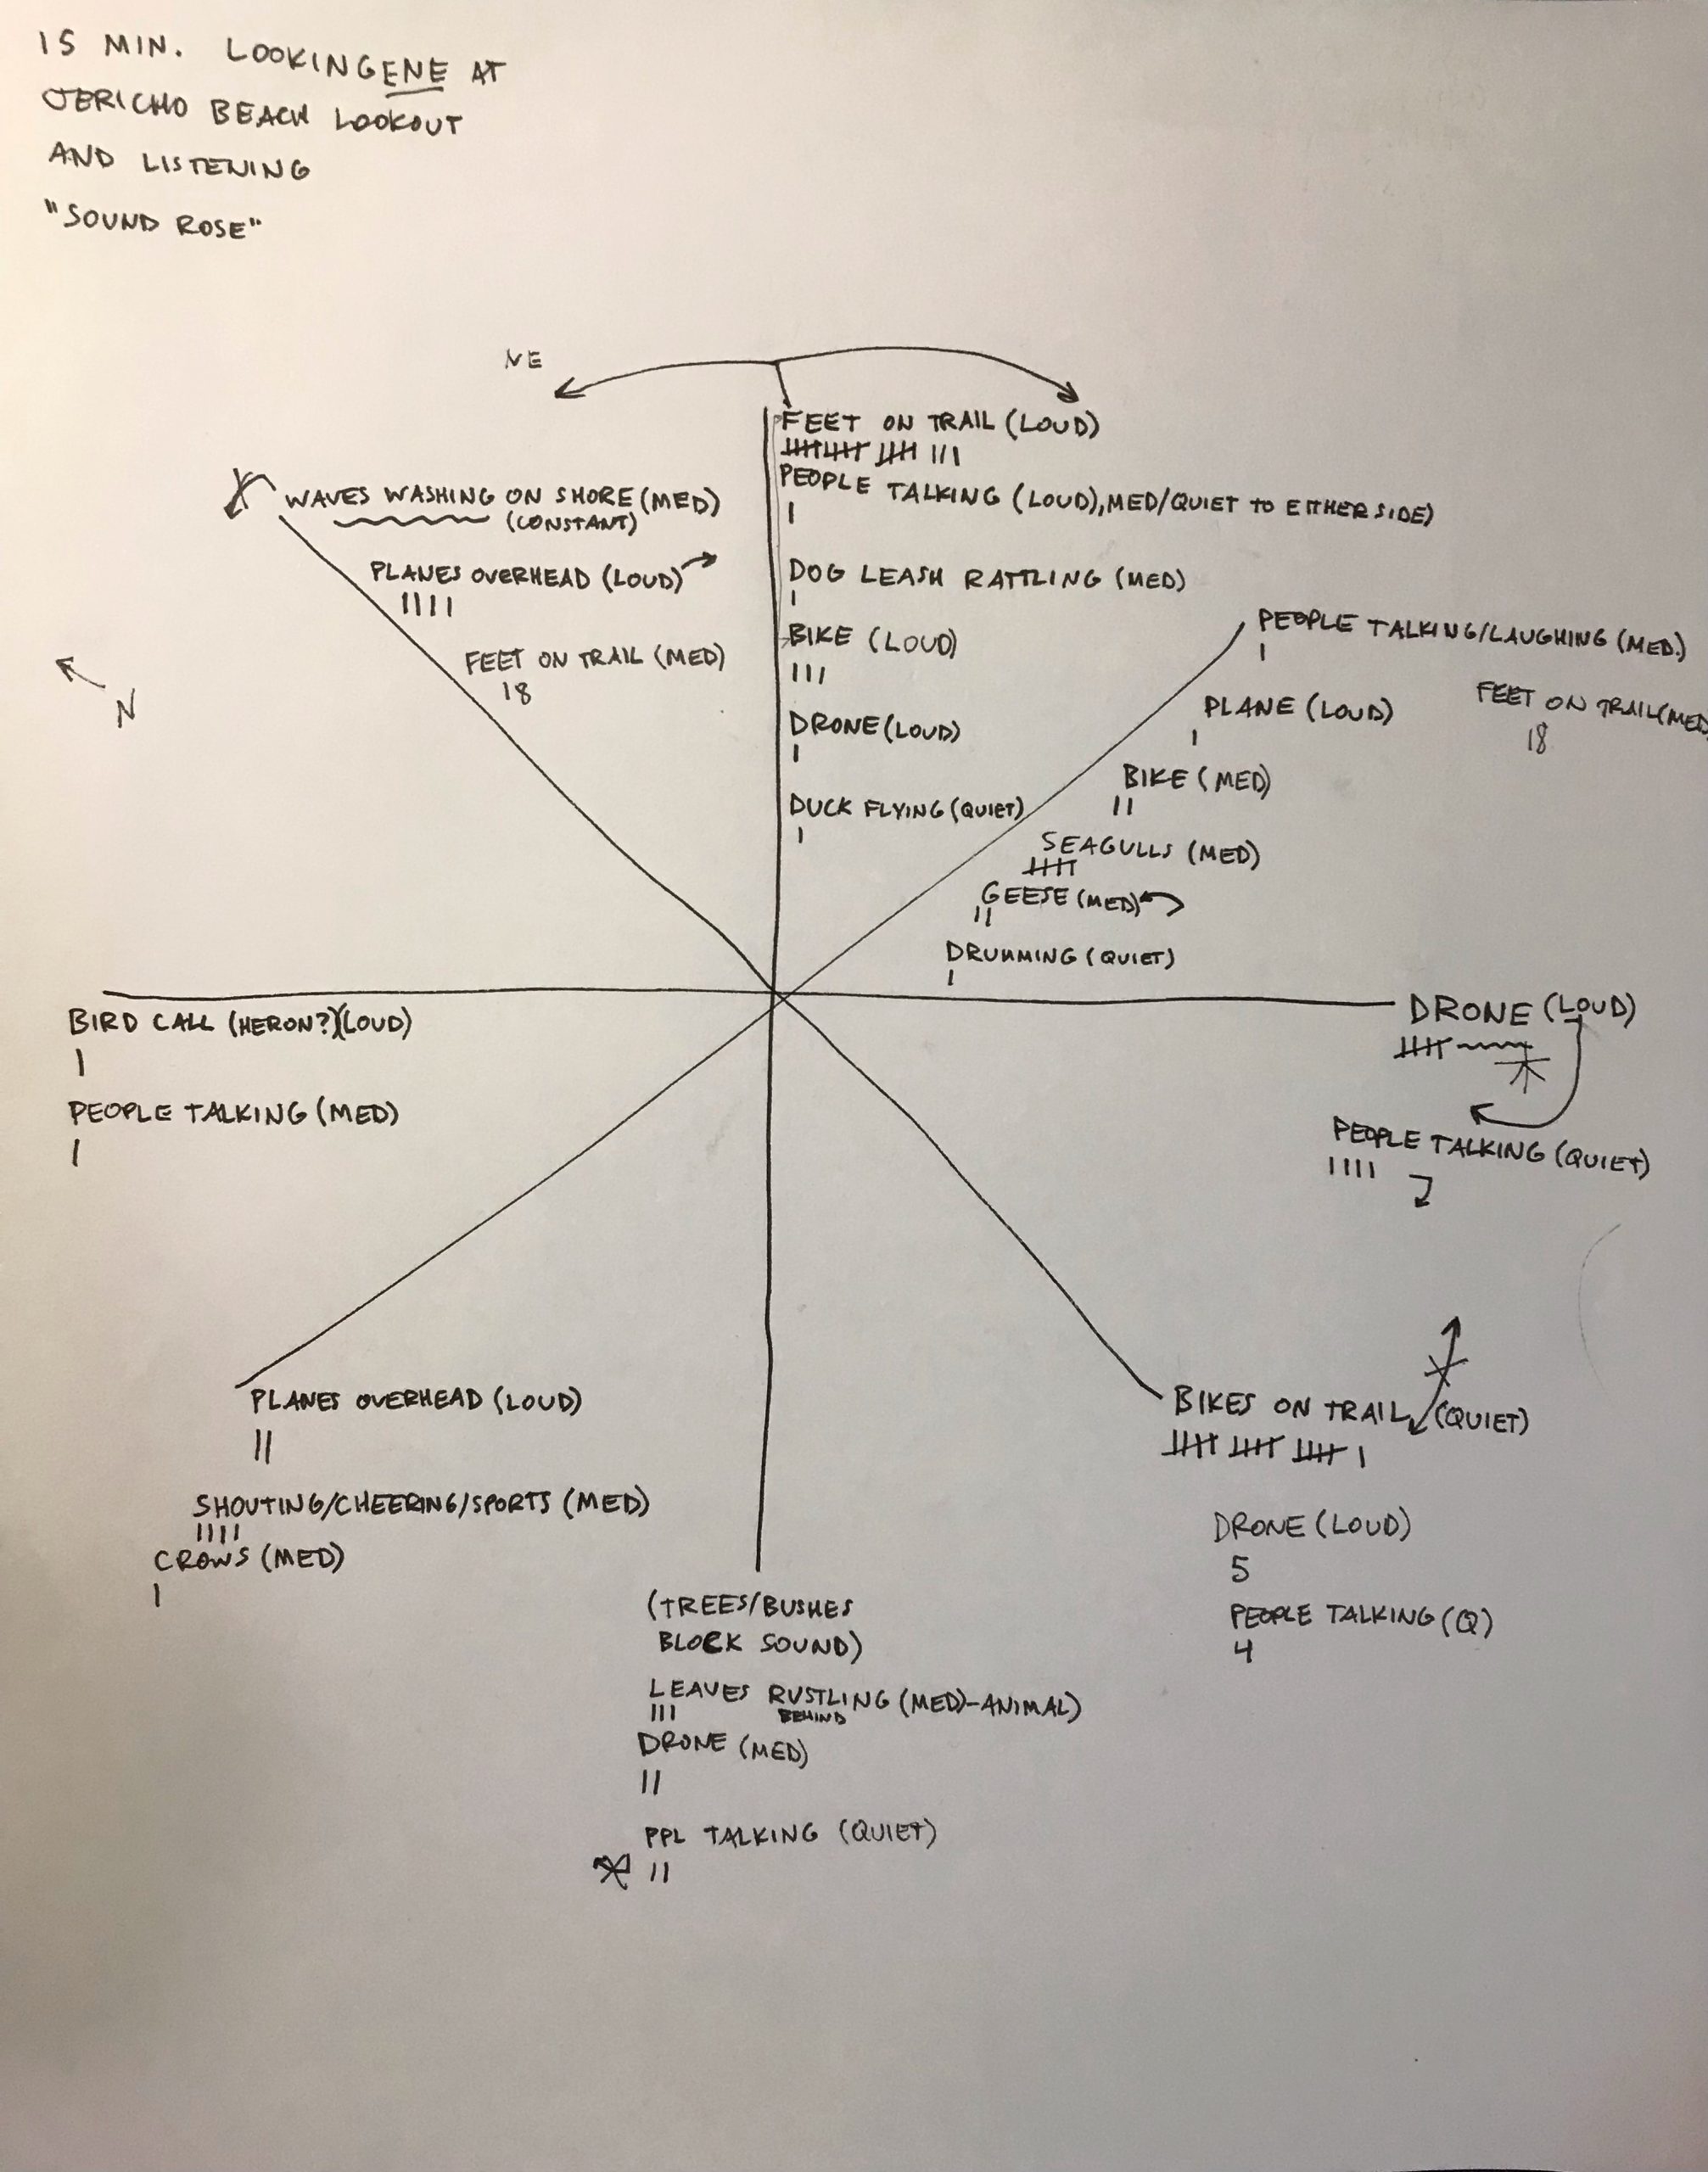
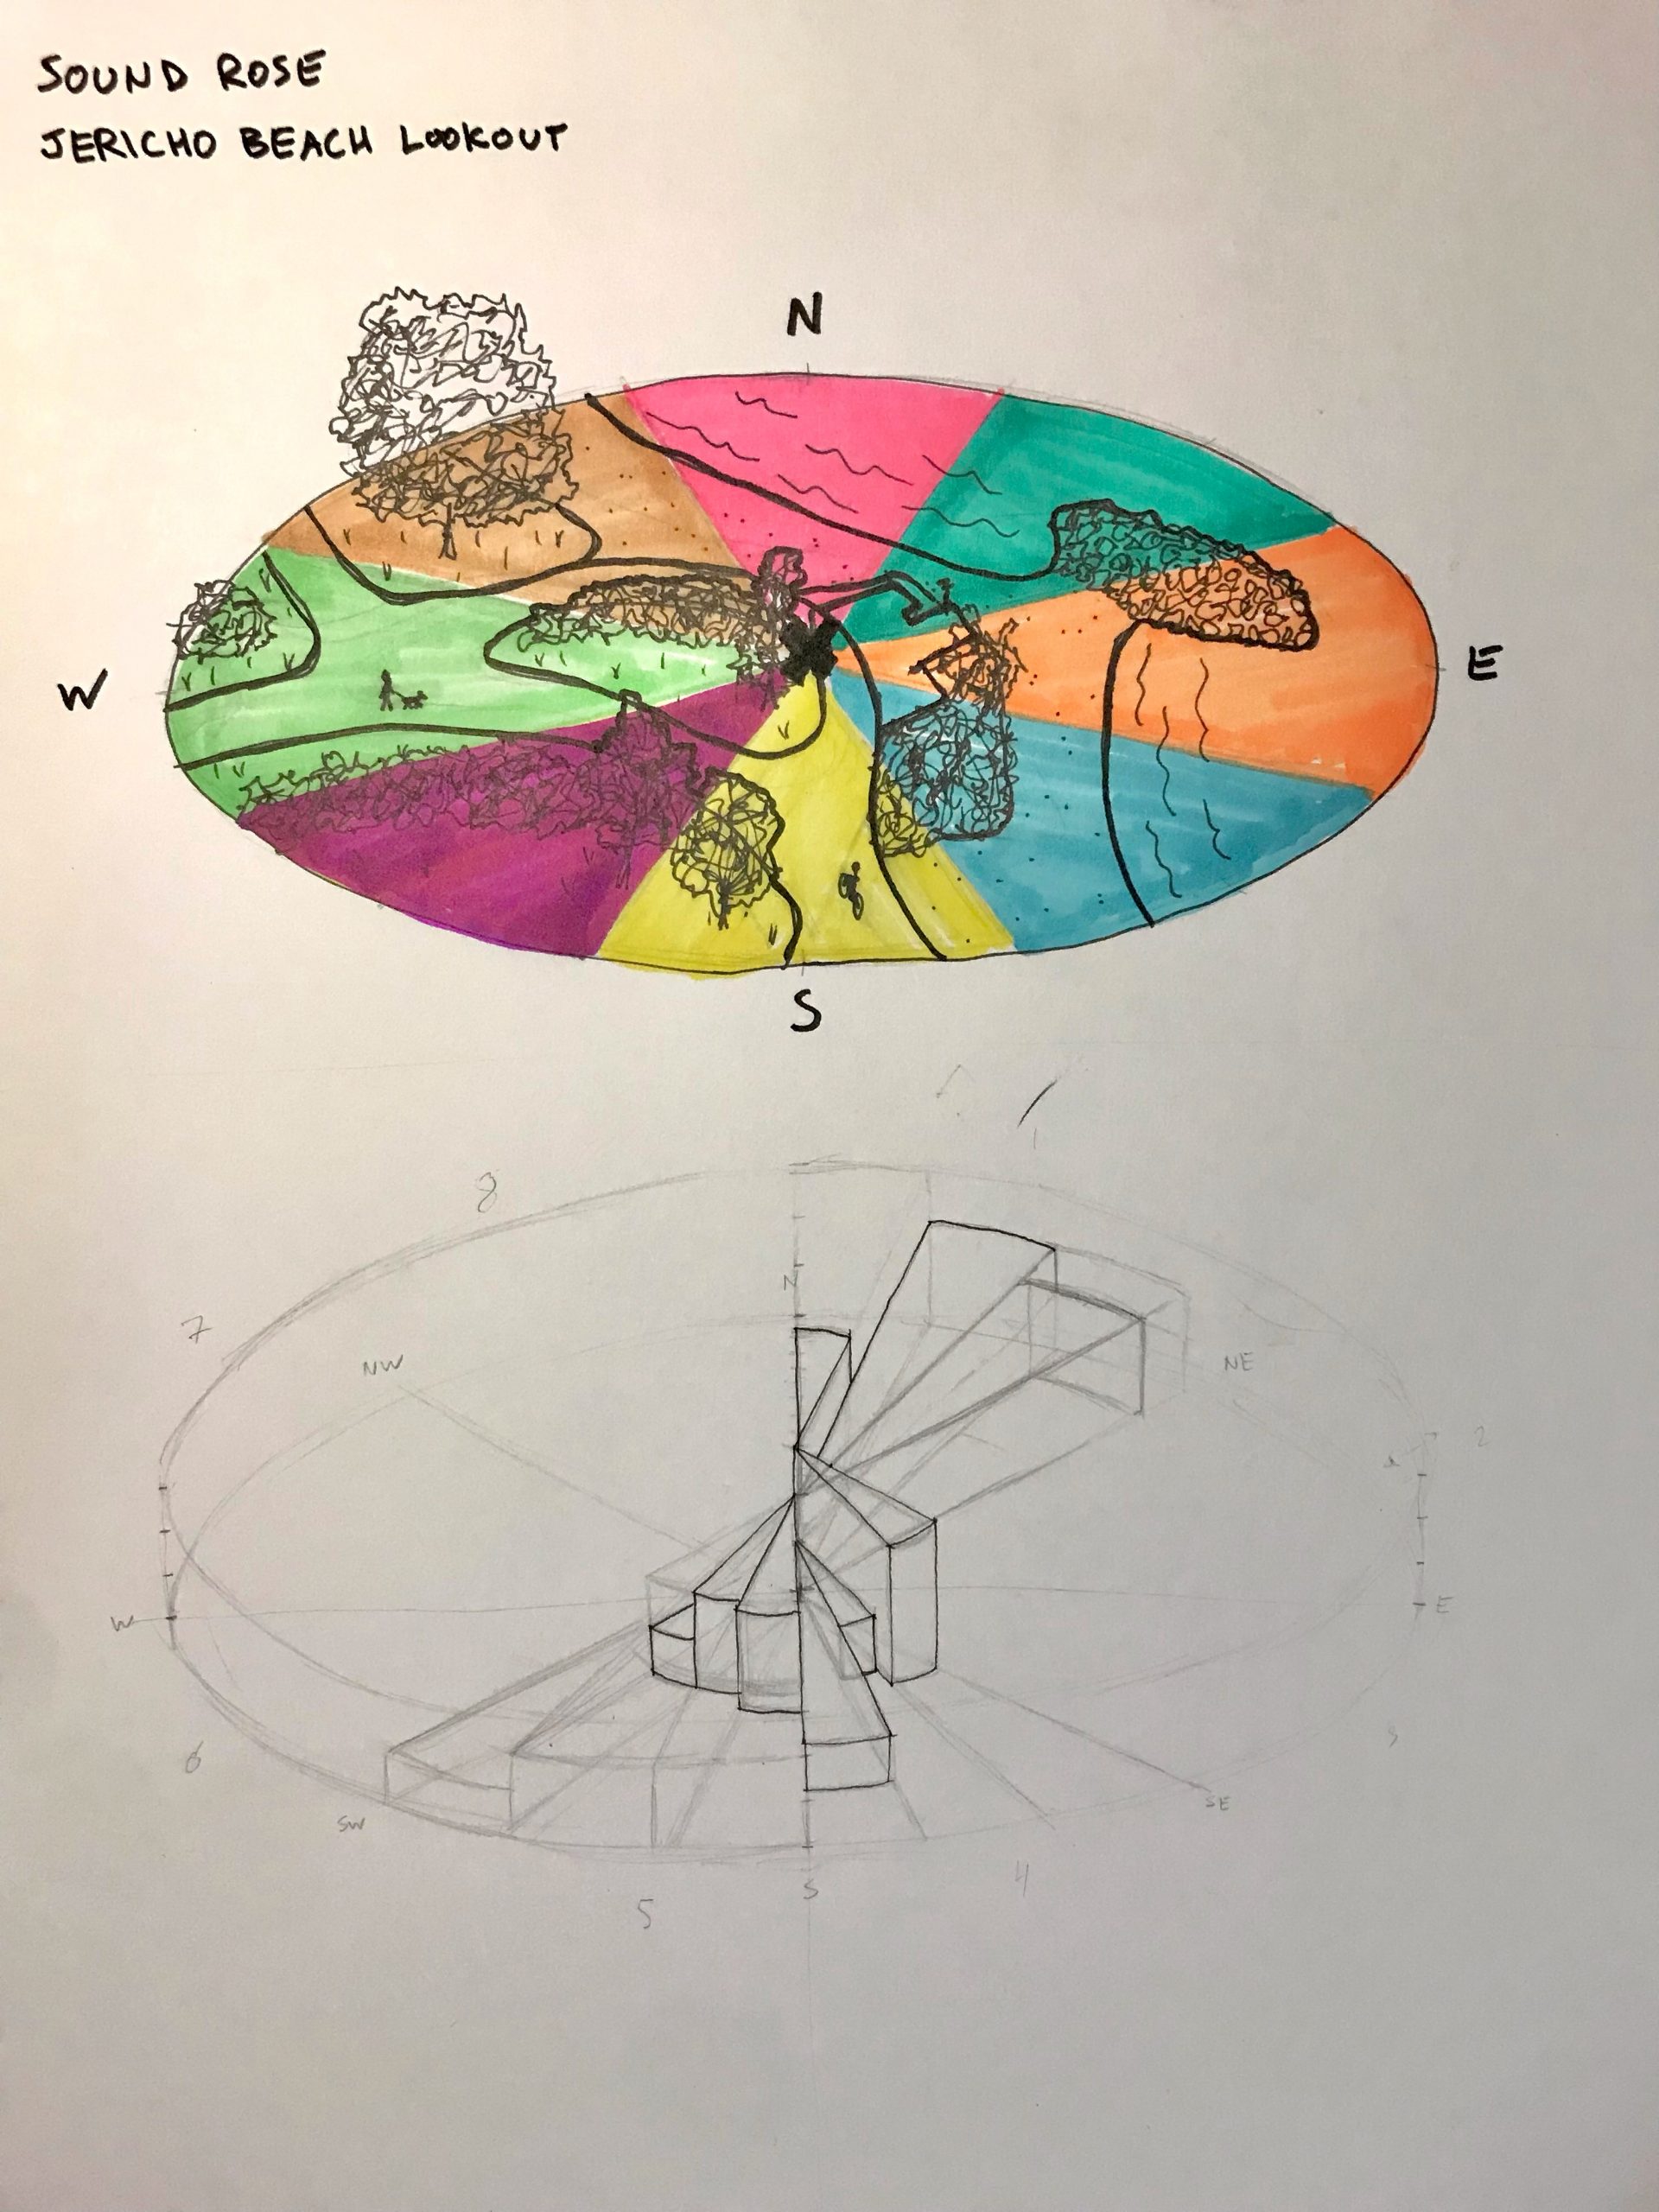
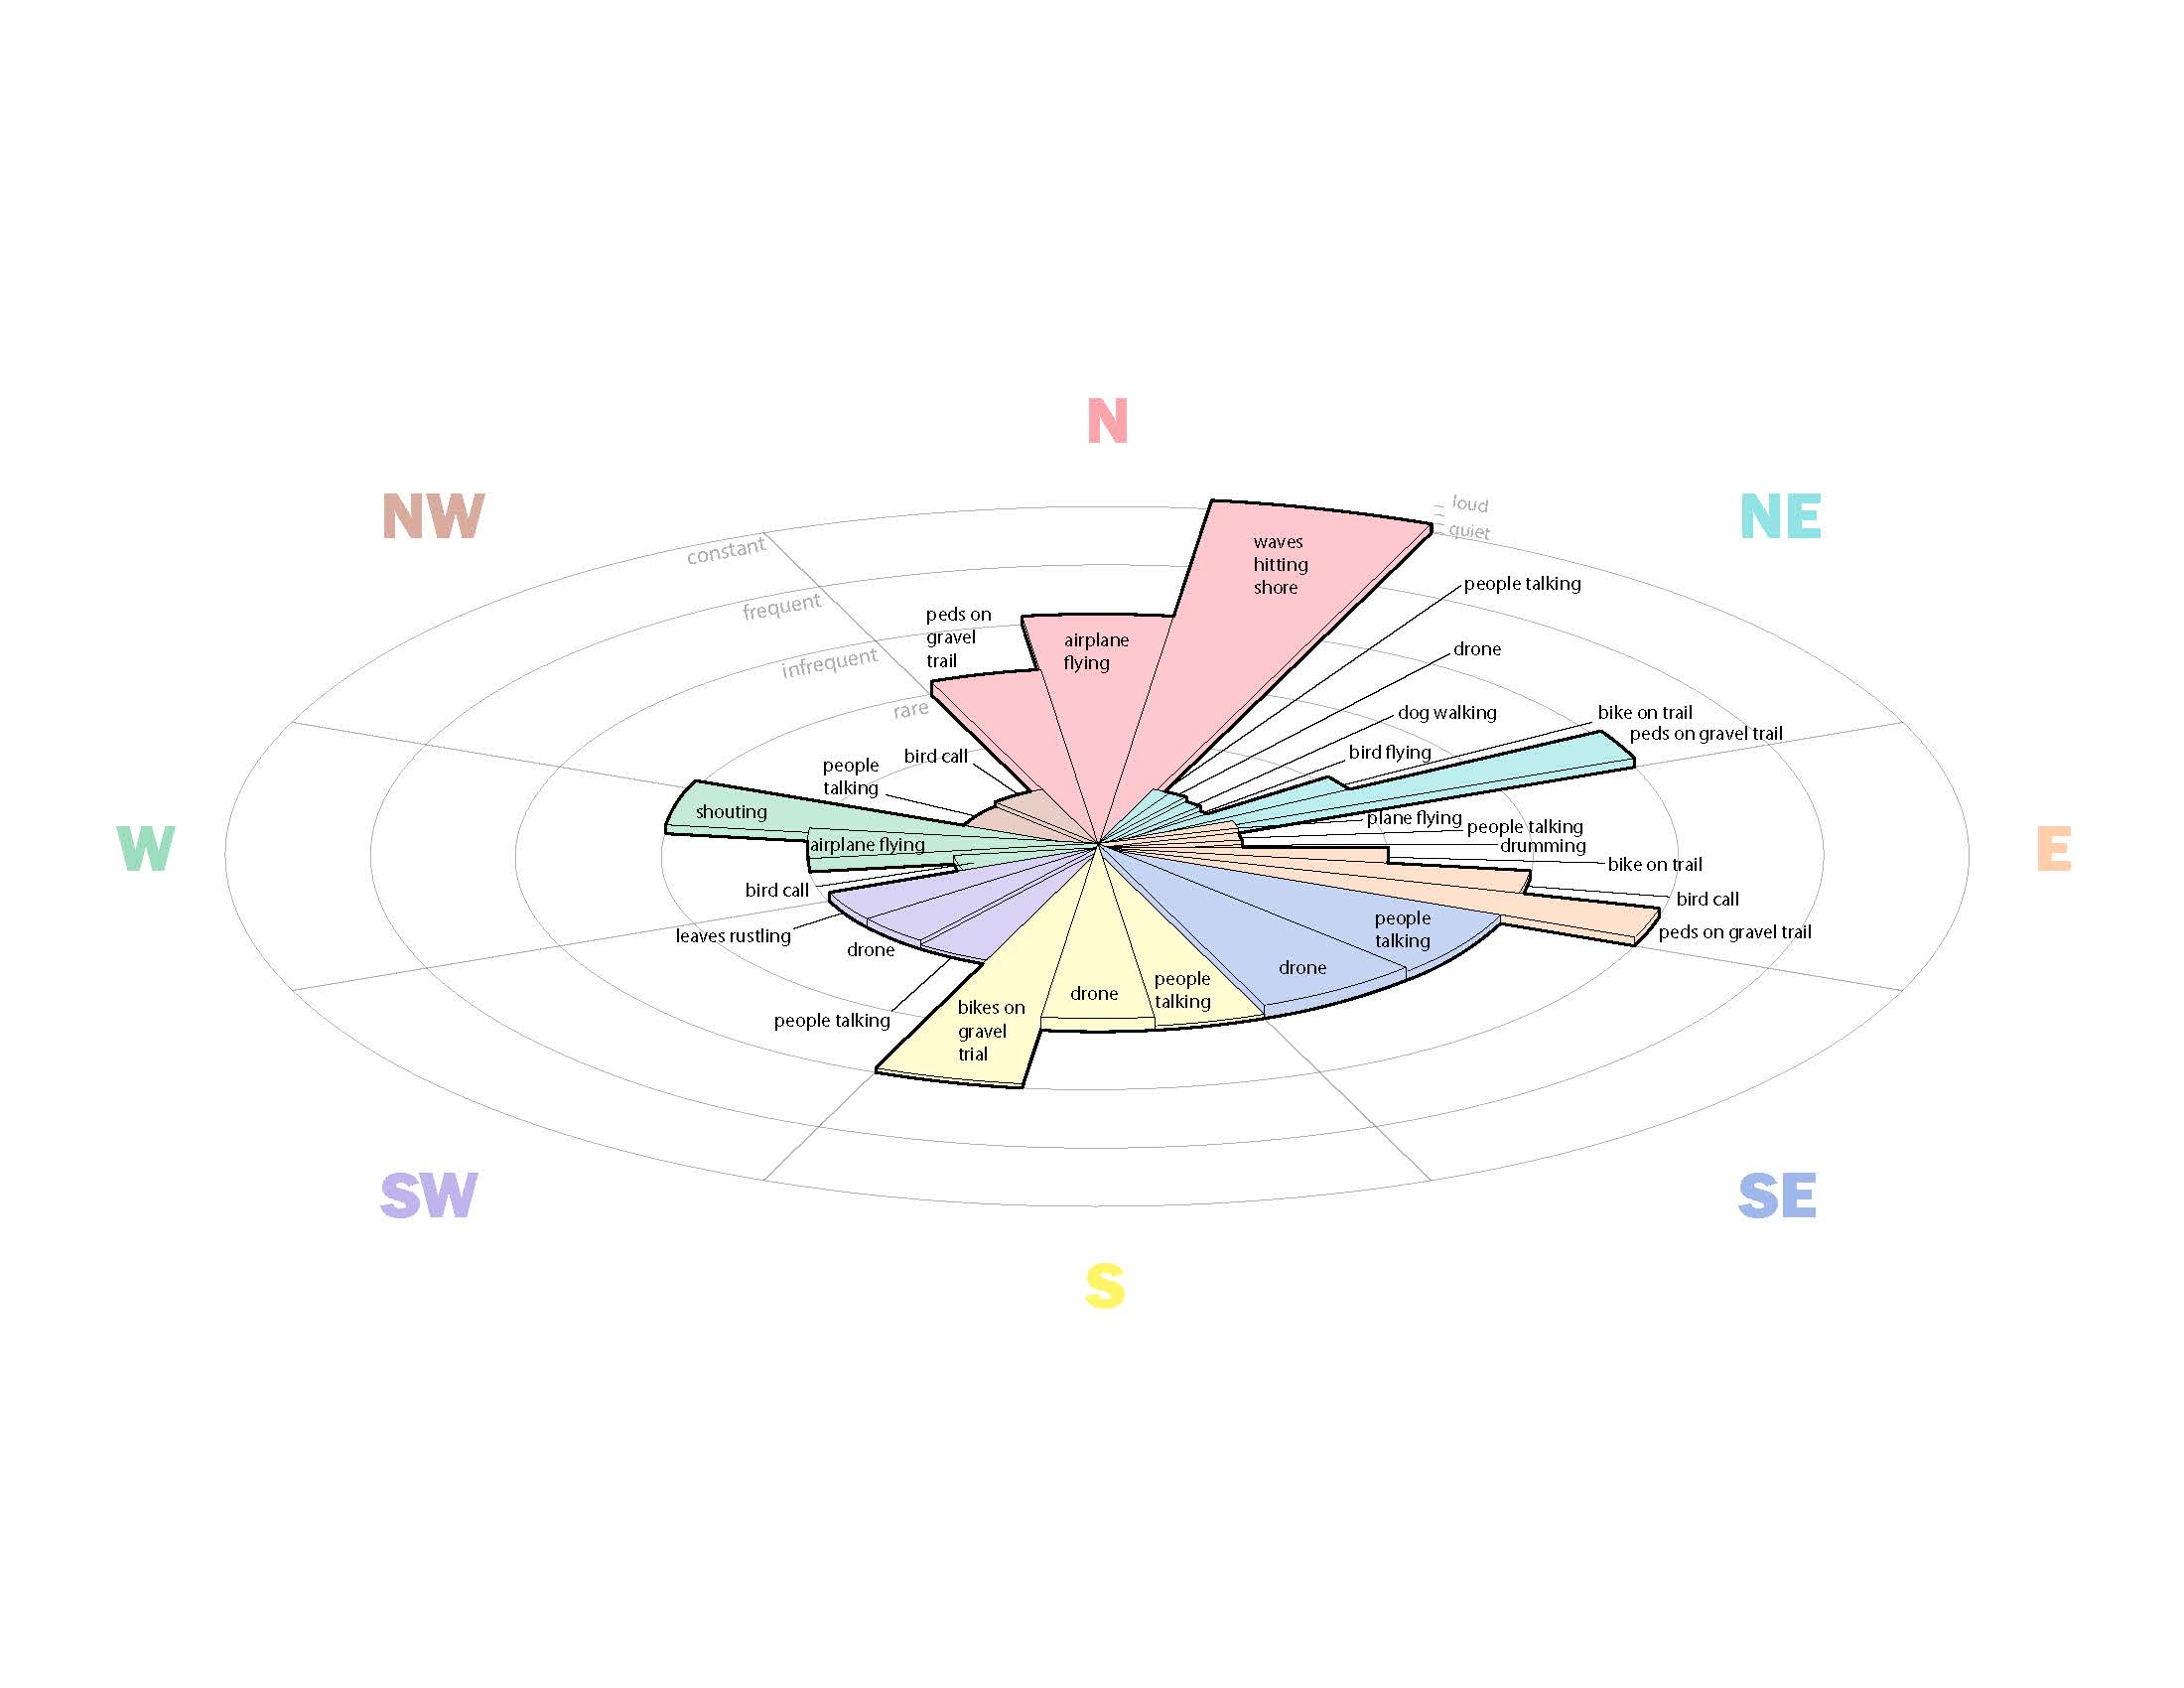
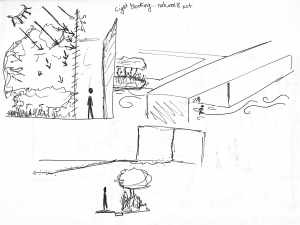
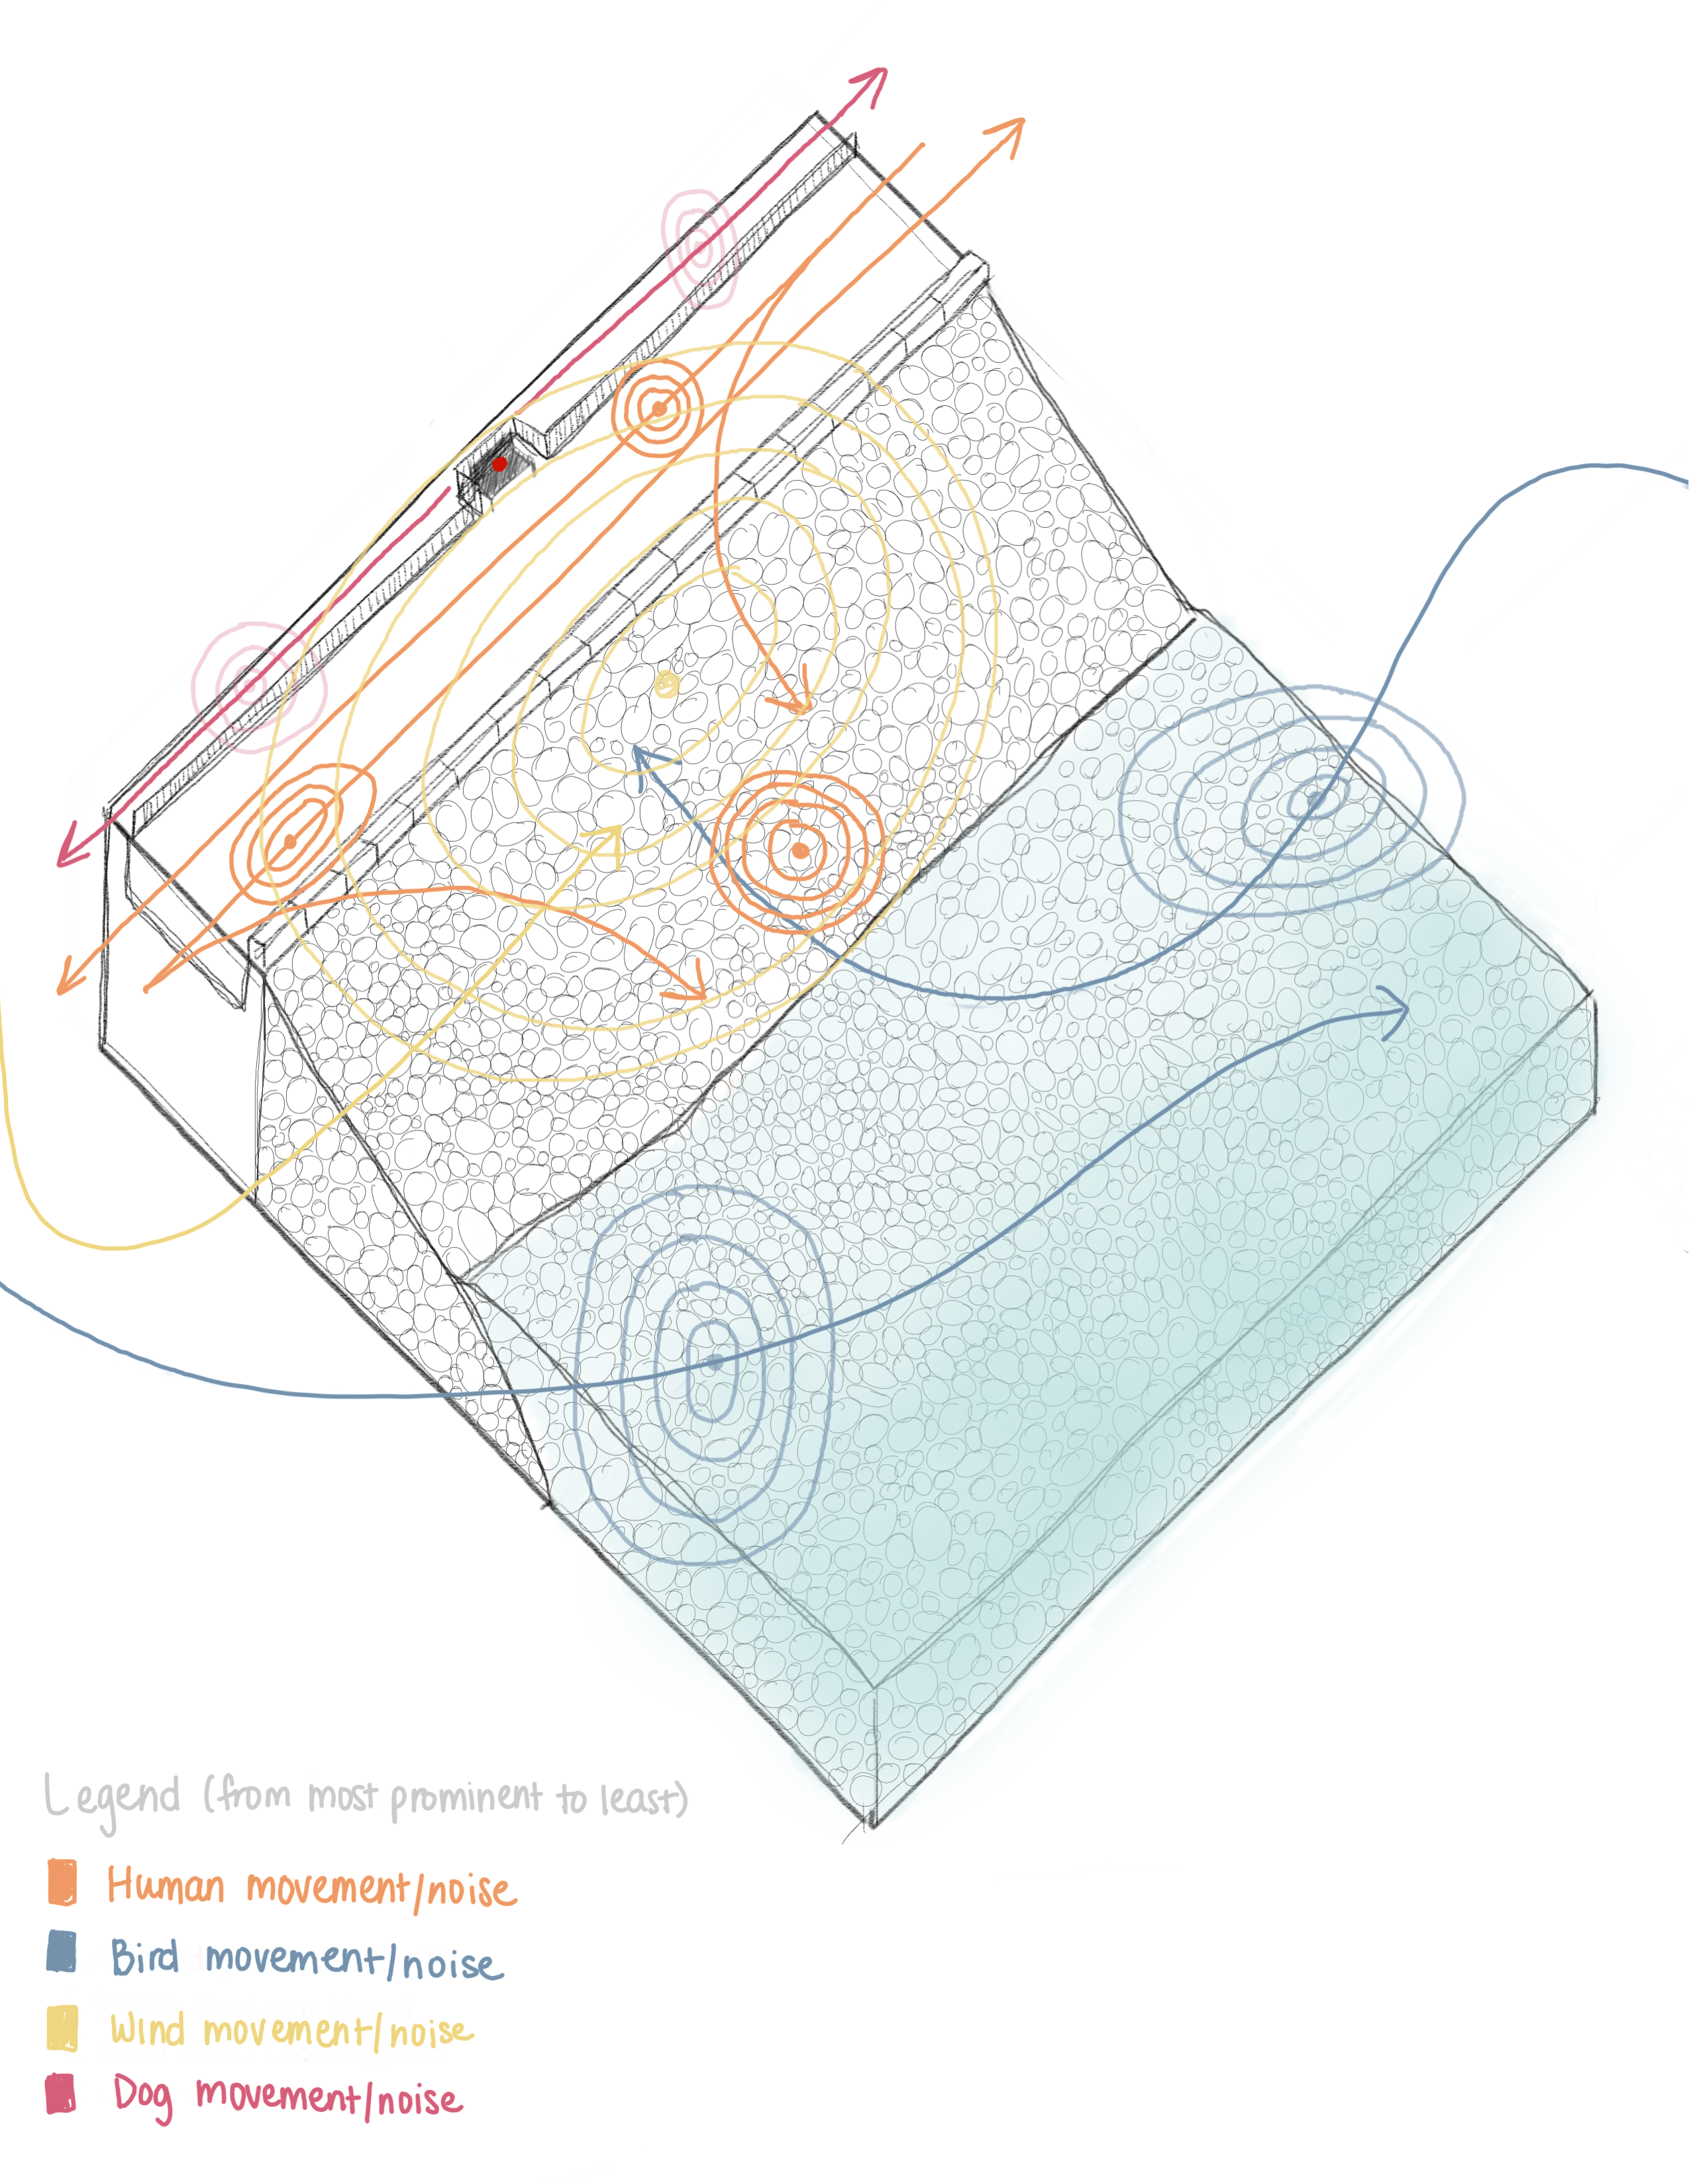
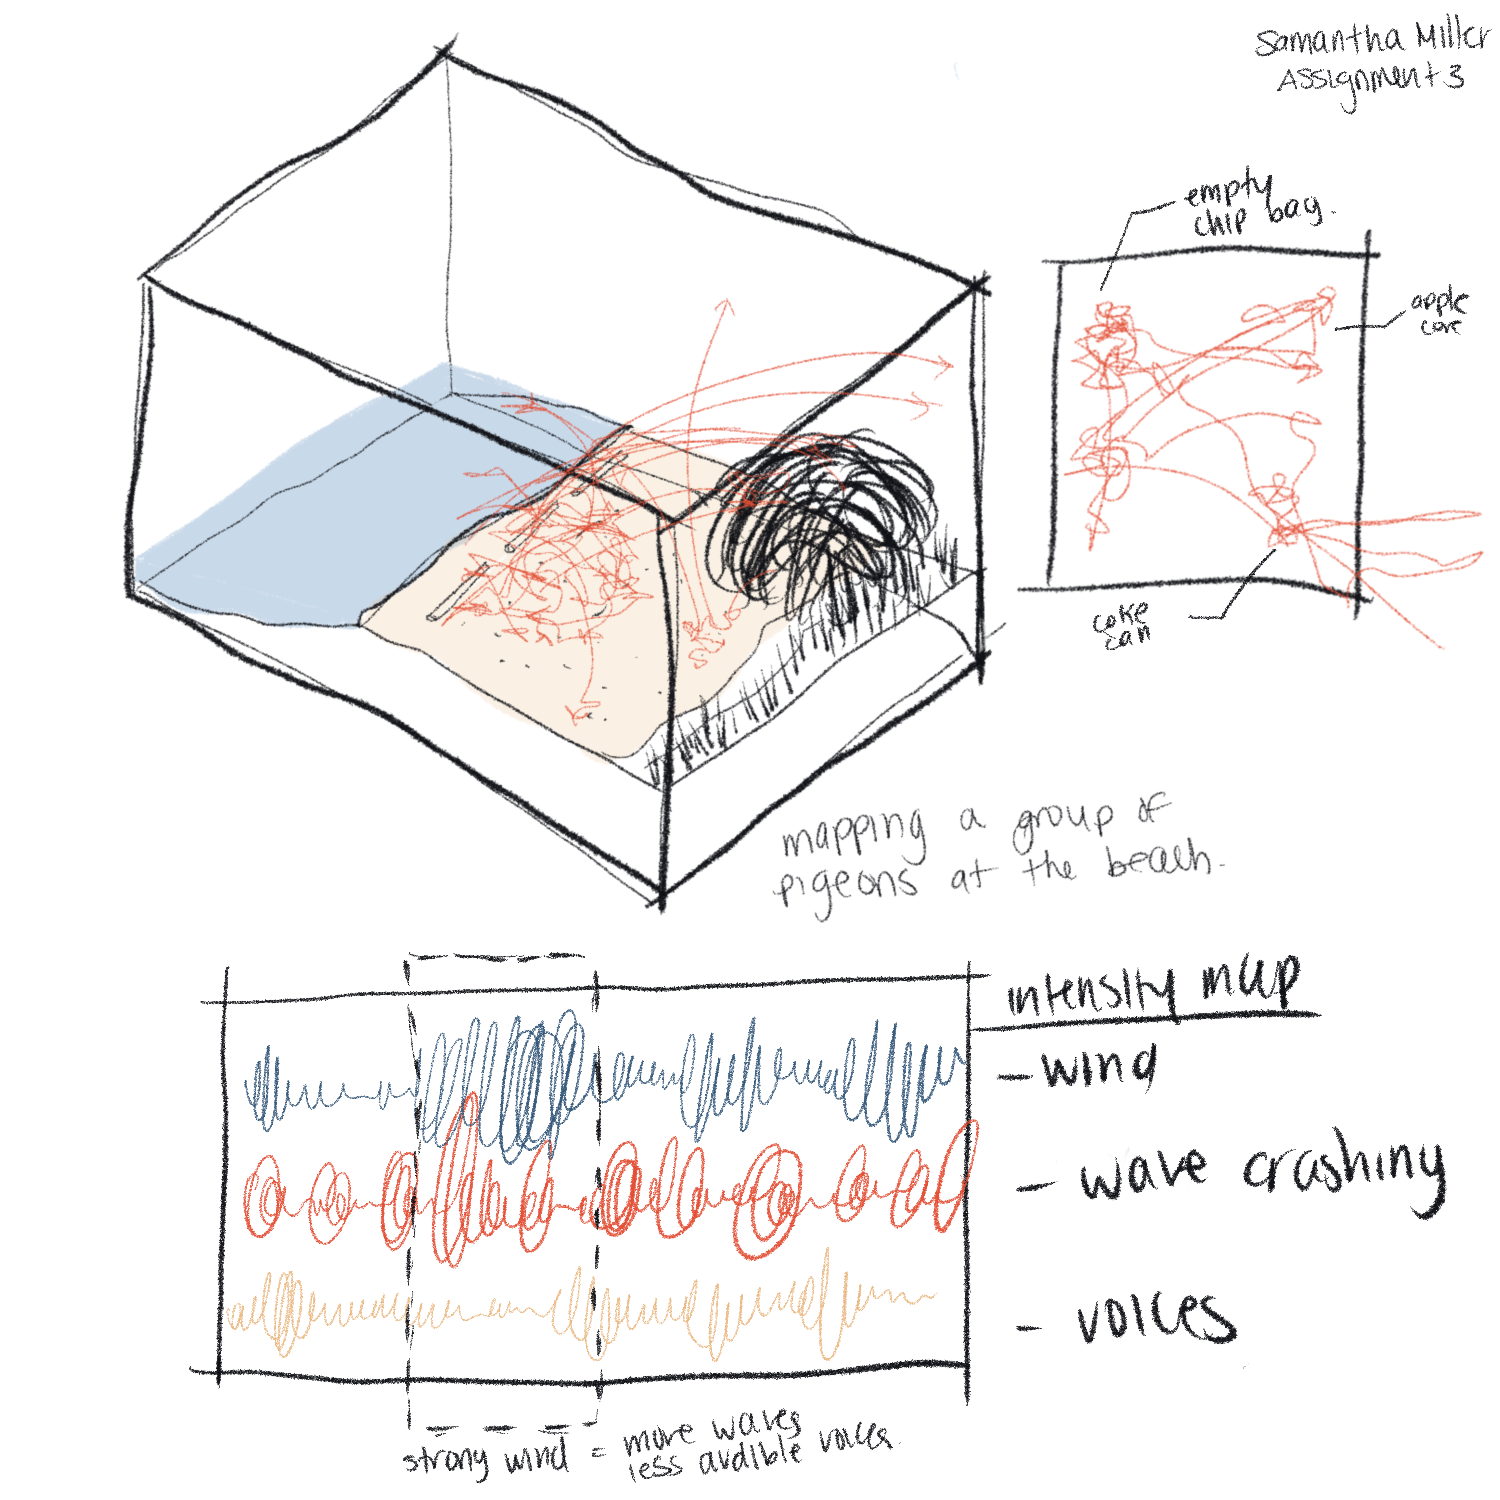
A3: Mapping – Birds, Wind, Waves, and Voices at Jericho Beach
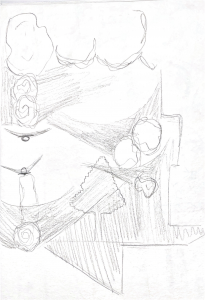
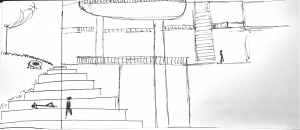
In-class drawing: