First of all, what even is a wetland? It seems there is not a universally agreed-upon definition; however, it is generally understood that a wetland is where a terrestrial ecosystem meets an aquatic one. If you think of a wetland you might imagine a soggy area with reeds or cattails, maybe some squishy peat moss and black muck and lots of birds singing. With this image in your mind, you can begin to realize which indicators might be useful for identifying wetlands: presence of water, type of vegetation, soil characteristics… if when you think of a wetland you picture dead trees and standing water rather than cattails, you are not wrong, this is also a wetland. Again, the terminology for these different types of wetlands are not consistent across the globe, but for our purposes we will follow the Canadian Classification System for wetlands: Bog, fen, swamp, marsh and shallow open water. Each one of these wetland types has different aquatic, vegetation and soil regimes (see image below). To keep it simple for now, let’s just focus on summarizing the fact that wetlands have a presence of water, certain types of vegetation and characteristic soil.

But how do you map a wetland? One way would be to go for a walk, stumble upon a wet area, pull out your GPS and map the perimeter of this soggy land. There are many inconveniences with this as you can imagine, particularly if you are interested in a study area of 15,000 square kilometers. A better way would be to look at a detailed aerial image and draw a circle around what you think is a wetland. Again, this is still going to take you a long time and you might miss small wetlands hidden in the trees or you might just have no clue what you’re looking for. Luckily, there is a third option. Technology has allowed for huge advances in remote sensing data collection and the recent push for open source data means that enthusiastic students like me can play around with enormous data sets and hope to make sense of them. Standing on the shoulders of giants, I will be using the latest and greatest mapping techniques to identify areas on the landscape where there is water, characteristic vegetation and characteristic soils. With some fine tuning, this is how we will identify the presence of a wetland on the landscape. The data I will be using for this includes: multispectral satellite data, radar satellite data, LiDAR and if possible a provincial soils database.
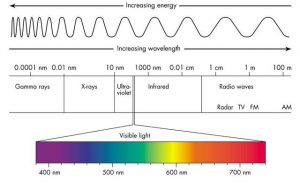
Wait. How does multispectral data/radar/LiDAR/soils database = wetland? The multispectral data is basically a fancy satellite image that captures wavelengths outside of the visible spectrum (vs a camera which is limited to red, green and blue) – some of these wavelengths are really good at identifying the presence of water and even certain types of vegetation. There are a number of calculations we can do that combine different ratios of wavelengths and result in better indicators for things like wetness or greenness. Radar is a bit different, it works by emitting an electromagnetic pulse (in the microwave portion of the spectrum) and measuring the reflected energy. It is sensitive to moisture content and surface roughness, is able to penetrate cloud and canopy cover and is not solar-dependent like the multispectral data.
Here I should mention that although this data is all very useful, it’s being collected from REALLY far away and thus, our resolution is at best 10-m… meaning that every 10×10 square area on the landscape gets summarized into one pixel, MEANING that we might miss some things. Never fear, LiDAR is here! The LiDAR (light detection and ranging) data is very special. Money was spent in the Okanagan to have it flown for floodplain mapping purposes, and secondarily for wetland mapping purposes. The LiDAR was flown from a plane, meaning the resolution is 1-m! The power of the LiDAR data is that it can give us a really great 3D image of the landscape so we can see where all the nooks and crannies are where water might like to pool. It also gives us a great detailed image of the vegetation structure, which as you already know is useful for classifying wetlands.
Lastly, the soils database should be pretty self-explanatory. We know that wetlands have unique soil characteristics and there just so happens to be a data set available from the Province of BC that shows different soil types. You can view the data here, where you can see some areas have more detailed polygons than others (we’ll see if it’s detailed enough for our purposes later on): https://governmentofbc.maps.arcgis.com/apps/MapSeries/index.html?appid=cc25e43525c5471ca7b13d639bbcd7aa.
That’s where I will leave it for now. In summary, how I aim to map wetlands begins with understanding what a wetlands is, the unique characteristics of a wetland and becoming familiar with a few different data sets.
Leave a Reply