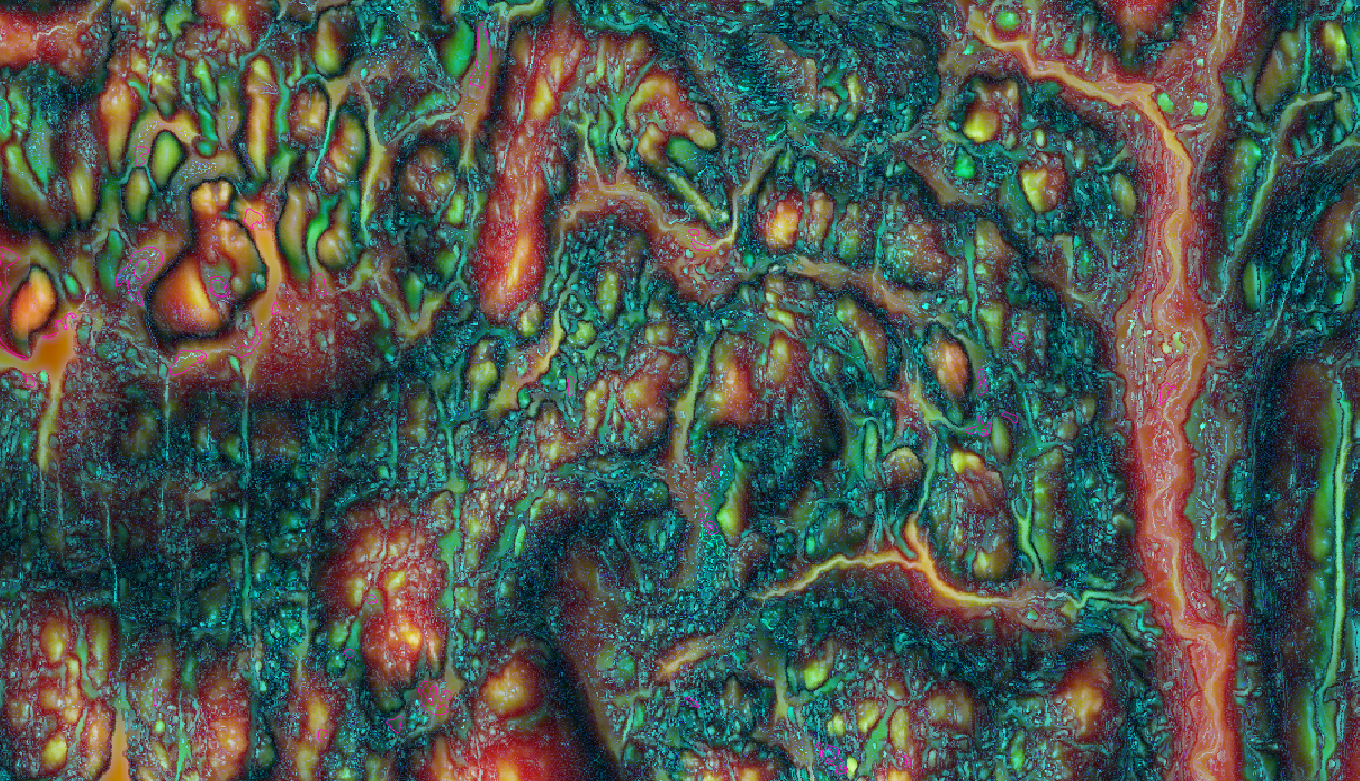

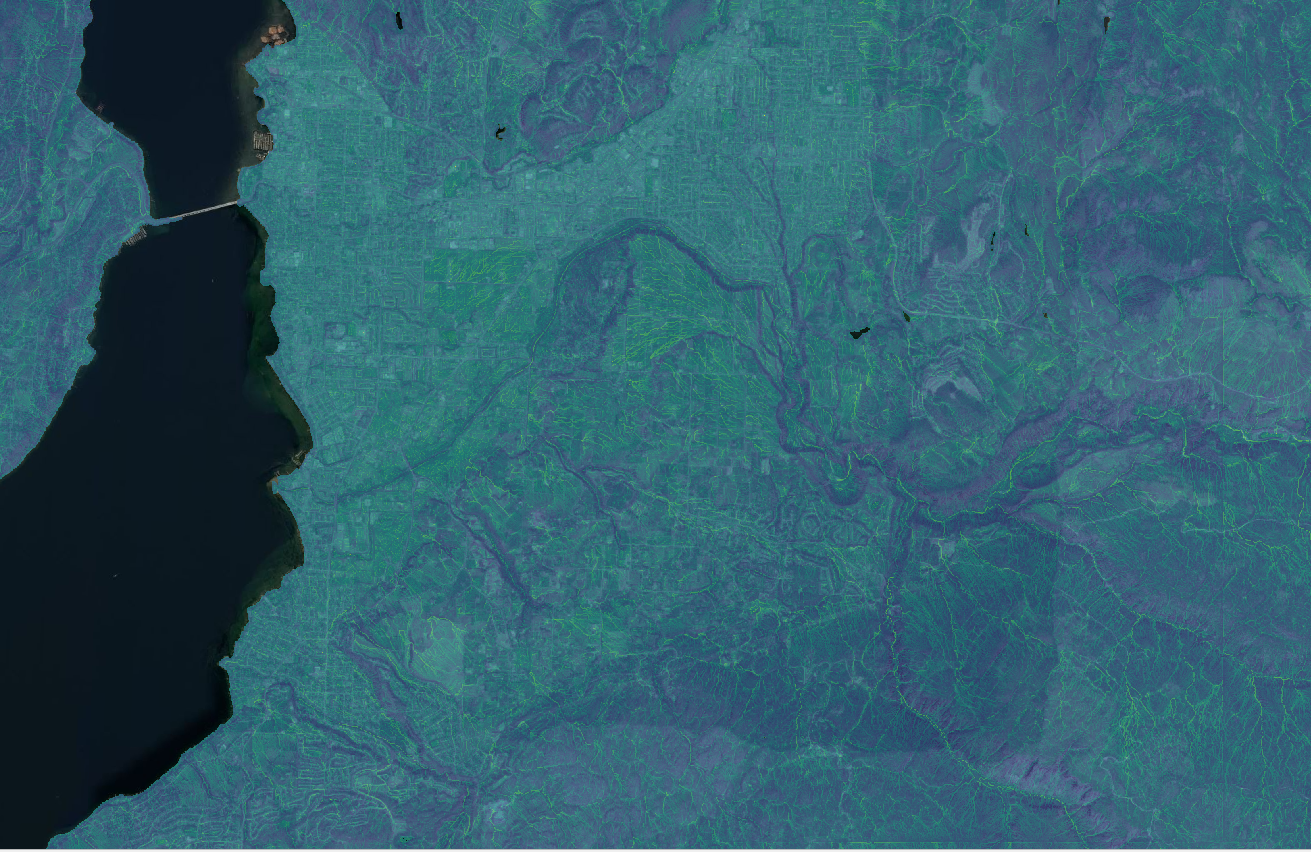
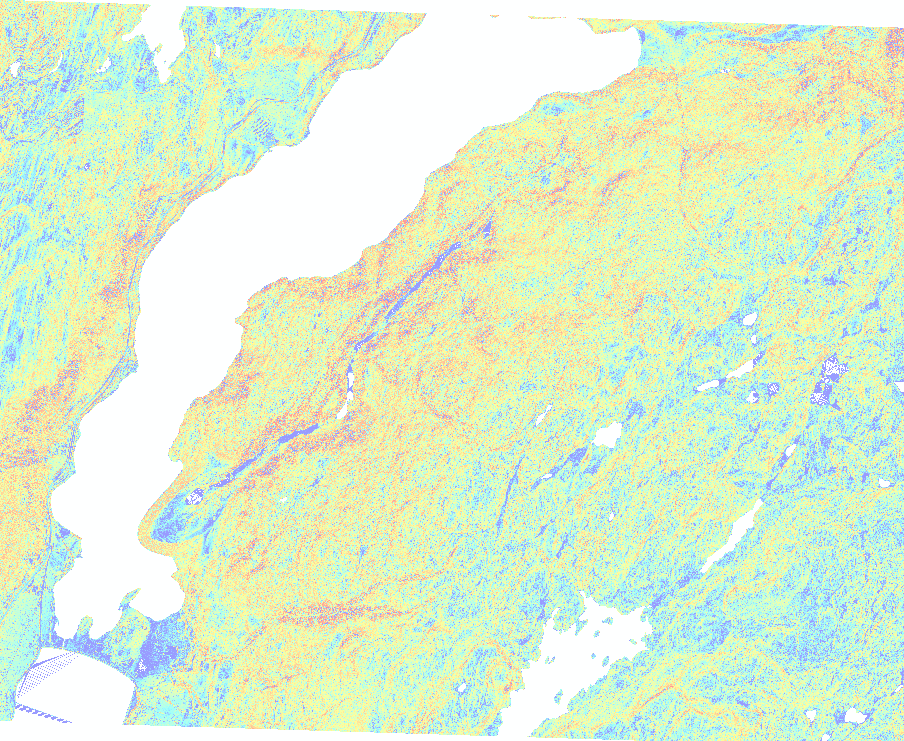
Multiscale Topographic Position (MTP) (Whitebox)
MTP is an image output that allows the viewer to visualize a landscape using various scales of topographic position. By utilizing a local-, meso-, and broad-scale topographic position, prominent features at each scale can be visualized at once (Lindsay et…
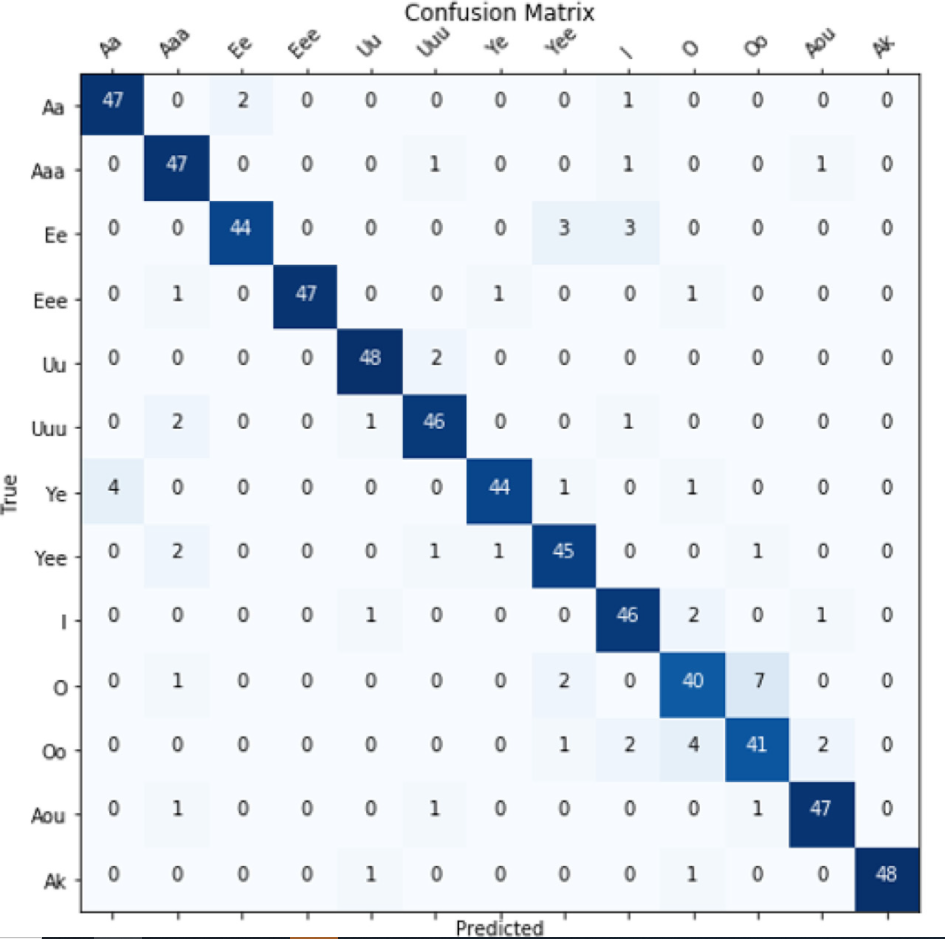
Confusion Matrices
A confusion matrix is a visualization tool used for machine learning outputs. It tells us how good our predictive model was by displaying the number of times a class was predicted as each option. For instance pretend we have 10…
Random Forest Modelling in R: Step by Step Process
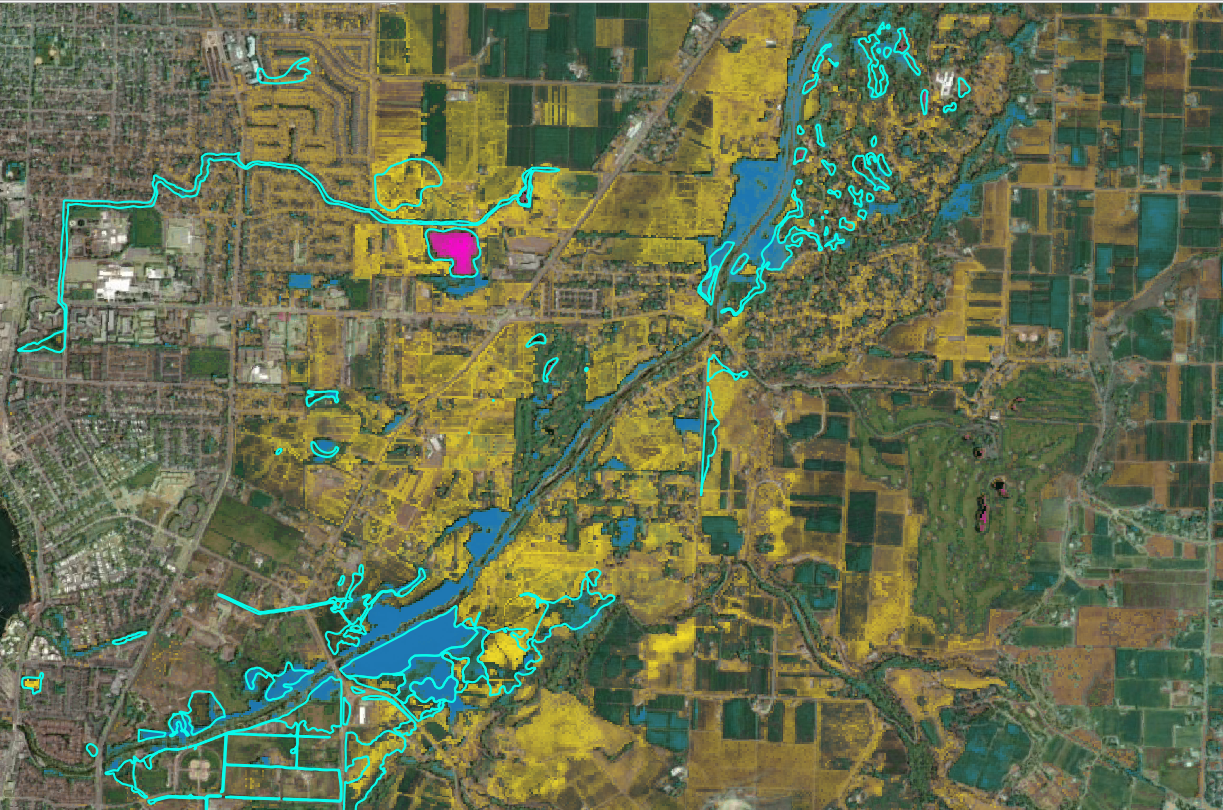
What you will need: A training dataset – this is either obtained from pre-existing data or by conducting field work to collect training points. In my case, there is an existing wetland database of over 6,000 wetland polygons throughout the…
The Importance of Wetlands
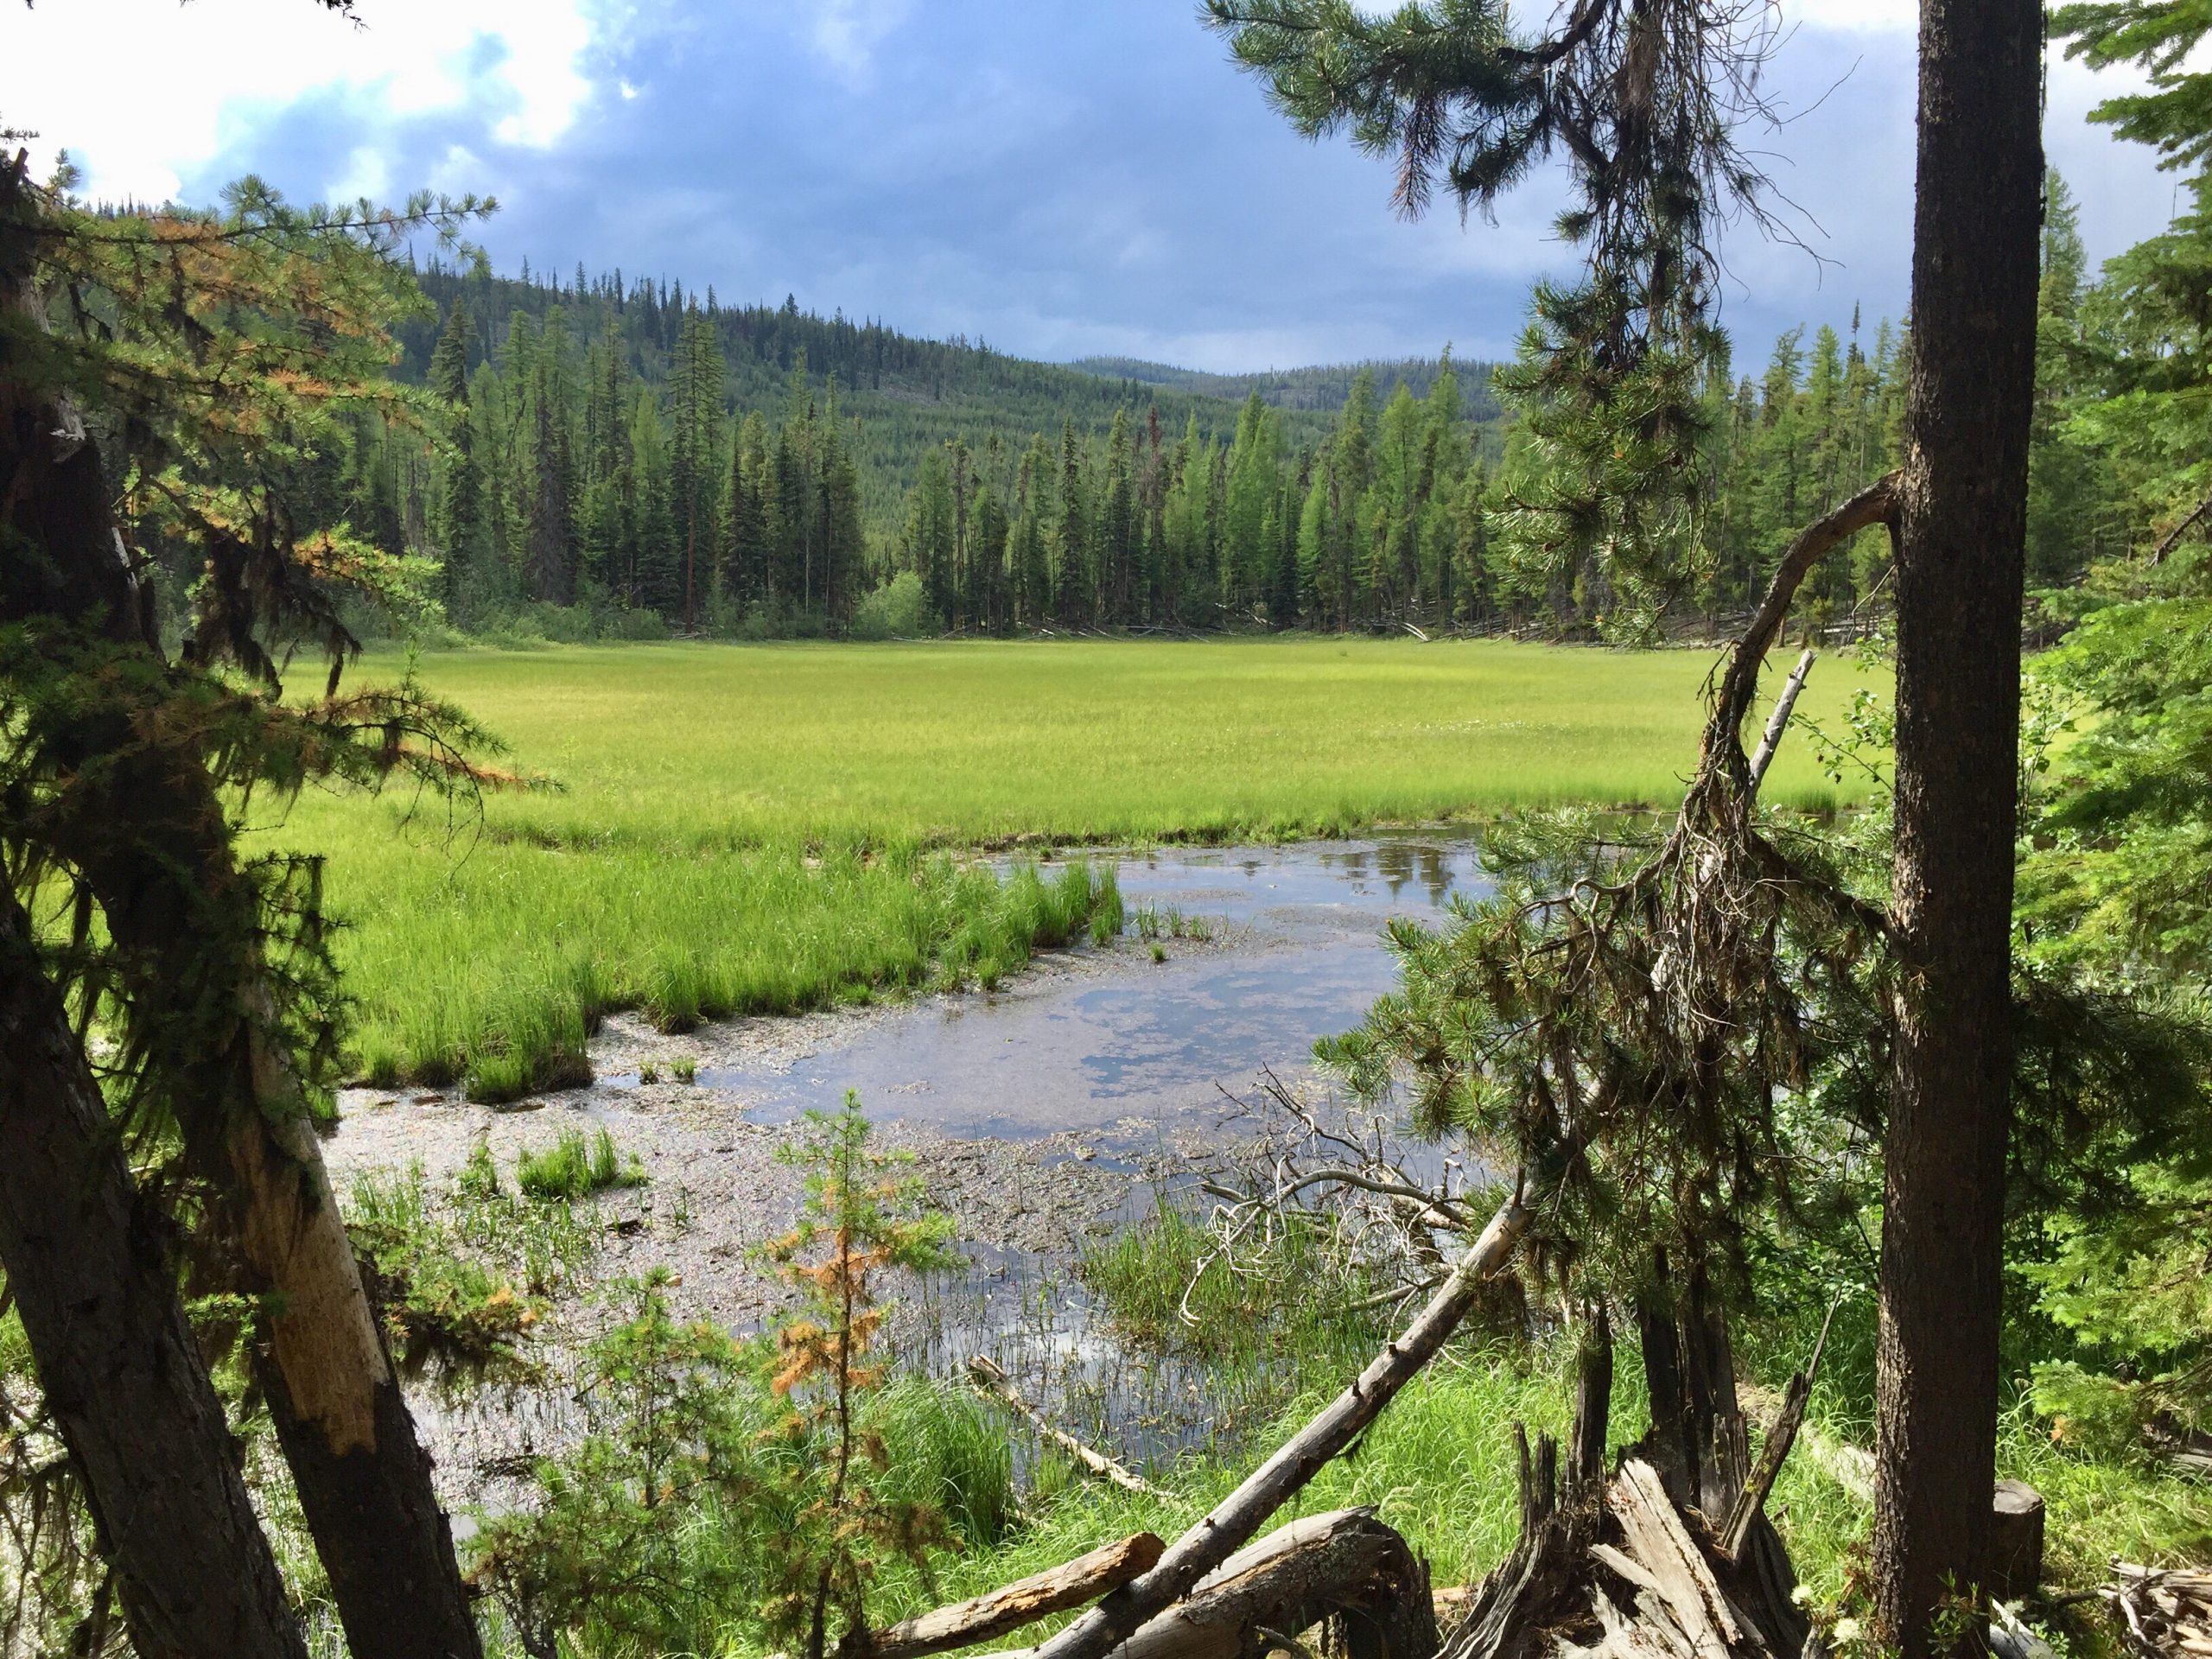
Wetland definition: Wetlands are the interface between terrestrial and aquatic habitats and are difficult to define due to their temporal and spatial variability. The Canadian Wetland Classification System (CWCS), established in 1997, defines a wetland as “land that is saturated…
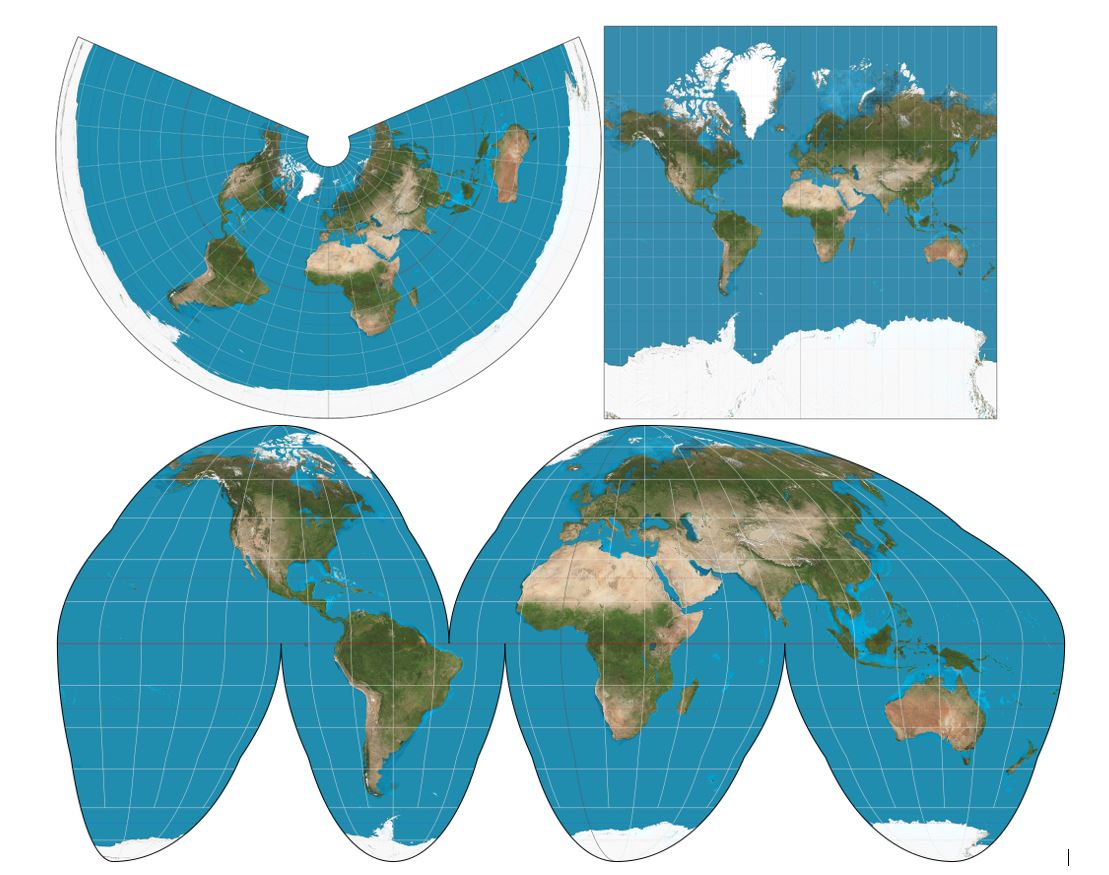
A quick lesson on projections
Geographic coordinate system vs projected coordinate system (Lat long vs UTM) Both vector (point, line, polygon) and raster (pixels) data rely on x, y values to situate the data in 2D space to represent where it is on the earth’s…
Introduction to Random Forest Machine Learning
Multiple recent studies have used random forest machine learning for classifying wetlands (Liu et al. 2011; Millard & Richardson, 2013; Corcoran et al. 2015; Franklin & Ahmed, 2017; Halabisky et al. 2017; Amani et al. 2019; Bourgeau-Chavez et al. 2017;…
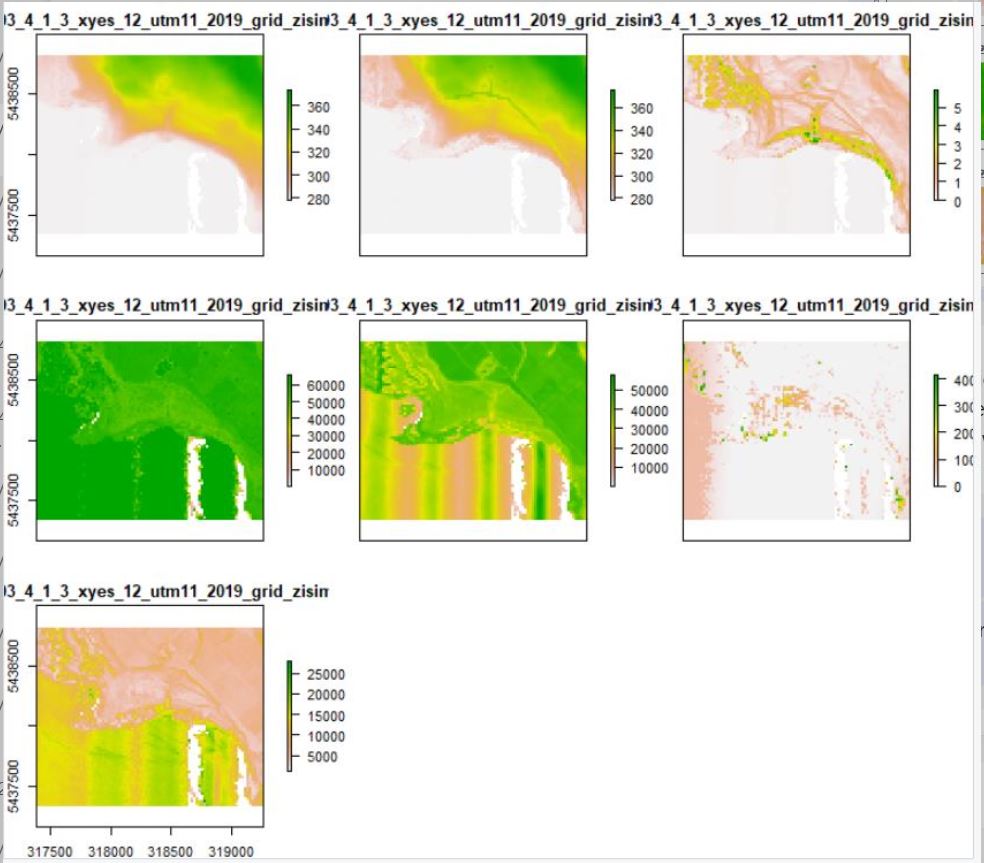
Calculating Grid Statistics with lidR
So far I have been working only with the LiDAR-derived DEM for calculating my topographic indices (TWI and TPI). For the Grid Statistics, I will be using the raw LiDAR point cloud (.las or in my case .laz files since…
Topographic Wetness Index (TWI) – PART TWO
Okay so I came back and looked at the recommended BreachLeastCostDepressions tool from Whitebox. When I ran it previously I did not understand what “dist” was. For a full explanation by Dr. John Lindsay himself, check out this post. In…
Topographic Wetness Index (TWI) – PART ONE
As a recap, I am currently making my way through a long list of parameters that I am interested in for mapping wetlands. These parameters are to be calculated from the raw lidar data (.laz files) or from the Digital…

Topographic Position Index (TPI)
What is TPI? The topographic position index helps us distinguish topographic features such as a hilltop, valley bottom, exposed ridge, flat plain, upper or lower slope. It is calculated by comparing the elevation of each pixel to its surrounding neighbours.…