
A confusion matrix is a visualization tool used for machine learning outputs. It tells us how good our predictive model was by displaying the number of times a class was predicted as each option. For instance pretend we have 10 known marshes, how many times were these actual marshes predicted as marsh, shallow-water, or swamp? It might be 7, 2, 1. This allows us to see whether or not the model is frequently confusing one class for another. In summary, a confusion matrix summarizes the performance of our predictive model.
Classification accuracy (number of correct predictions / total number of predictions) alone can be misleading if you have an unequal number of observations in each class or if you have more than two classes in your dataset. Calculating a confusion matrix can give you a better idea of what your classification model is getting right and what types of errors it is making.
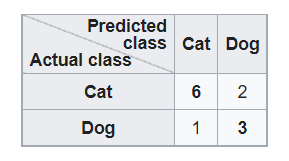
Rows represent actual classes while columns represent predicted classes.
Overall accuracy: # of samples correctly classified / sum of the total. Not a lot of info about class-level accuracy (i.e. which classes are being mapped well and which ones are being confused). Can be represented as a percent or a proportion.
Class-level accuracy: Two types
1) User accuracy (1 – commission error): Probability that a feature classified on the map actually represents that category. Based on row total. Incorrectly included.
2) Producer accuracy (1 – omission error): Probability of a reference feature being correctly classified. Based on column total. All the samples that were omitted from the sample class.
Kappa coefficient: takes into account random chance agreement. Represented as a proportion. Thought to be more robust than overall accuracy. Kappa has been called into question recently: Foody 2020, Pontilus and Millones 2011. Alternatives to Kappa include the Quantity Disagreement and the Allocation Disagreement. Overall Disagreement is the sum of these two.
How to create a confusion matrix:
1) You need a test dataset or a validation dataset with expected outcome values.
2) Make a prediction for each row in your test dataset.
3) From the expected outcomes and predictions count:
a) The number of correct predictions for each class; and b) the number of incorrect predictions for each class, organized by the class that was predicted.
Just a quick note on the OOB error. This is a type of bootstrap aggregating that allows one to define an out-of-bag estimate of the prediction performance by evaluating predictions on those observations which were not used in the building of the learner. In a study done by Silke Janitza and Roman Hornung, out-of-bag error has shown to overestimate in settings that include an equal number of observations from all response classes (balanced samples), small sample sizes, a large number of predictor variables, small correlation between predictors, and weak effects. The oob error also cannot tell you how well your model is predicting each class. This is where the confusion matrix is necessary.
Helpful videos and links:
Confusion matric calculations explained: https://www.youtube.com/watch?v=6XHyYh45PxA
Accuracy assessment in R: https://www.youtube.com/watch?v=ww8KWgT98Hw
References:
Janitza, Silke; Hornung, Roman (2018-08-06). “On the overestimation of random forest’s out-of-bag error”. PLOS ONE. 13 (8): e0201904. doi:10.1371/journal.pone.0201904. ISSN 1932-6203.
Leave a Reply