
I recently had the opportunity to give a presentation to the BC Water Supply Association, considering the economic impact of irrigation in the Okanagan. I subsequently added to the presentation and presented it at a professional development event for the BC Institute of Agrologists.

https://www.tourismkelowna.com/things-to-do/wineries/
We do not know the economic impacts of irrigation in the Okanagan. A 2017 study commissioned by the Canadian Vintners Association, the Winery and Grower Alliance of Ontario, British Columbia Wine Institute and the Winery Association of Nova Scotia reports that the wine and grape industry has a $9 billion impact on the Canadian economy, and a $2.8 billion impact on the BC economy. How much of this $2.8 billion would occur if there were no irrigation in the Okanagan? We don’t know.
Canada’s Wine Economy – Ripe, Robust, Remarkable
https://www.vernonmorningstar.com/
As part of the Kelowna airport expansion plan, SNC Lavalin was commissioned to estimate the economic impact of the airport. The airport is estimated to contribute $599 million in total activity to the economy, and catalyze $190 million in tourism activity. This is estimated to be $345 million in Gross Domestic Product (GDP) impact from airport activities, and $90 million in GDP impact for the catalyzed tourism activity. How much of this activity is related to irrigated agriculture? How many business trips? how much agricultural products as air cargo? How much of the tourism attractiveness is related to wineries? We can probably measure the direct expenditure shares, but how about indirect effects?
Airport Master Plan: Economic Impacts
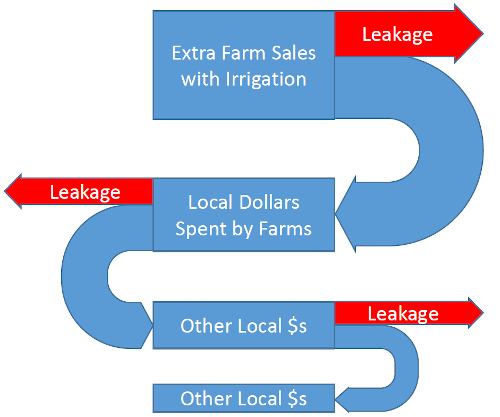
What are we trying to measure when we talk about economic impacts? Irrigation enables farmers to get more yield and/or grow a higher value crop. All of that extra sales goes somewhere. Some of it leaves the Okanagan, such as buying tractor parts from the US. Some of it stays here, such as the wages paid to the mechanic who used those parts to fix the tractor. Some of the wages earned by the mechanic might be spent on oranges imported from China, while some is spent on locally grown peaches. Those peaches and oranges were bought at a grocery store, and part of the price paid for that fruit are wages for the person stocking the shelves. Some of their income will be spent locally, more economic activity again. And so on, and so on, … In this way, the boost in revenue that irrigation enables on the farm swirls around through the local economy, generating more economic activity. How much more? That depends on knowing how quickly those extra revenues leak out of the area.
I don’t know of a good recent estimate of the economic impact of irrigation in the Okanagan. Statistics Canada reports that there are 186,234 hectares of farmland in the three regional districts that cover the Okanagan, 24,294 of those being irrigated. The reported total gross farm receipts for these same three regional districts is $431,027,968. We can play around with these numbers a little bit to get an idea of what the economic impact might be. To do that, we do need to make a couple of assumptions. First, how much more productive is irrigated farmland in the Okanagan, relative to land without irrigation? To get some ranges, I’m going to try 5:1, 10:1 and 20:1. This probably varies around the Okanagan, as you can’t grow the same things in Armstrong that you can in Osoyoos. These numbers are a place to start. The other thing we need is a multiplier that accounts for the local economic impacts of the extra farm revenues. The wine and grape industry study reports $9.04 billion of total impact from $1.24 billion of direct sales, a multiplier of 7.3. The Kelowna Airport study $599 million in total impact from $336 in direct sales, a multiplier of 1.8. For this back of the envelope calculation, I’ll assume that each extra dollar of farm revenue generates two extra dollars of economic activity in the Okanagan.
| Revenue Ratio | 5:1 | 10:1 | 20:1 |
| Revenue / Acre | |||
| Irrigation | 7,604 | 10,646 | 13,307 |
| Dryland | 1,521 | 1,065 | 665 |
| Difference | 10,460 | 14,602 | 17,525 |
| Without Irrigation | |||
| Lost farm revenue | 147,791,446 | 232,766,600 | 307,116,908 |
| Lost GDP (3:1) | 443,374,339 | 698,299,801 | 921,350,725 |
This quick, back of the envelope calculation suggests that irrigation in the Okanagan contributes, on the low end, almost half a billion dollars to the Okanagan economy, and on the high end closing in on a billion dollars.
This impact doesn’t include the value of the landscape irrigated agriculture in the Okanagan provides. That landscape has value. It attracts new immigrants to this valley, and draws the tourists. Much of this benefit is not connected in any way to farm revenues, and missed by the back of the envelope calculations above. How big is it? We don’t know.
Protecting the agriculture we have in the Okanagan and taking advantage of new agricultural opportunities created by the changing climate will require investment in irrigation. The benefits of this investment extend beyond the farm gate. How should we share the costs of making these investments?
 Follow
Hi, John. Really interesting piece. You nicely demonstrate the challenges and uncertainties associated with this type of economic analysis. But you also focus exclusively on the benefits that are likely generated by irrigation, implicitly arguing that the costs should be distributed more broadly within society (because there are societal benefits that are real albeit difficult to quantify).
Well, what about the costs of irrigation, both direct and indirect? A more revealing analysis would balance the benefits with the costs (which are admittedly equally difficult to quantify, if not more so). Surely, it is the net benefits/costs that we are interested to know, and more importantly to whom those net benefits/costs accrue.
In any case, thanks for a stimulating thought-piece for us all to ponder.
Hi Bernie. Thanks for your comments. You are of course correct that irrigation also has costs. Many studies, such as the two I describe in the post, and those I also consult in the presentation, document benefits only. To put irrigation in the same economic context as the airport, the wine and grape industry, motorized recreation (see https://atvbc.ca/wp-content/uploads/2019/03/2015-BC-Economic-Impact-of-ATVs-and-Side.pdf), etc., I think we need to start with an analysis that is comparable. Once we have a good measure of the benefits, comparable to these other benefit measures, we can then turn to getting a good measure of the costs, and apply that cost measure method to other things, like ATVs, and see what the net balance is.