Several years ago I supervised a research project that sought to measure how much central Okanagan residents were willing to pay to protect several different local environmental resources. A couple of years ago I presented a summary of the results to the Environmental Advisory Committee (EAC) of the Regional District of Central Okanagan (RDCO). I was strongly encouraged to develop some material that made the results easily available to people involved with local government. Assorted obstacles have finally been overcome, and there are now three fact sheets and a technical report available that I hope is consistent with the desires expressed by the EAC.
- Heterogeneity Fact Sheet.
- Deliberation Fact Sheet.
- Social Network Fact Sheet.
- So You Say You Value the Environment: Conversations, Networks, and Stated Values.
The Research Project
The Choice Experiment
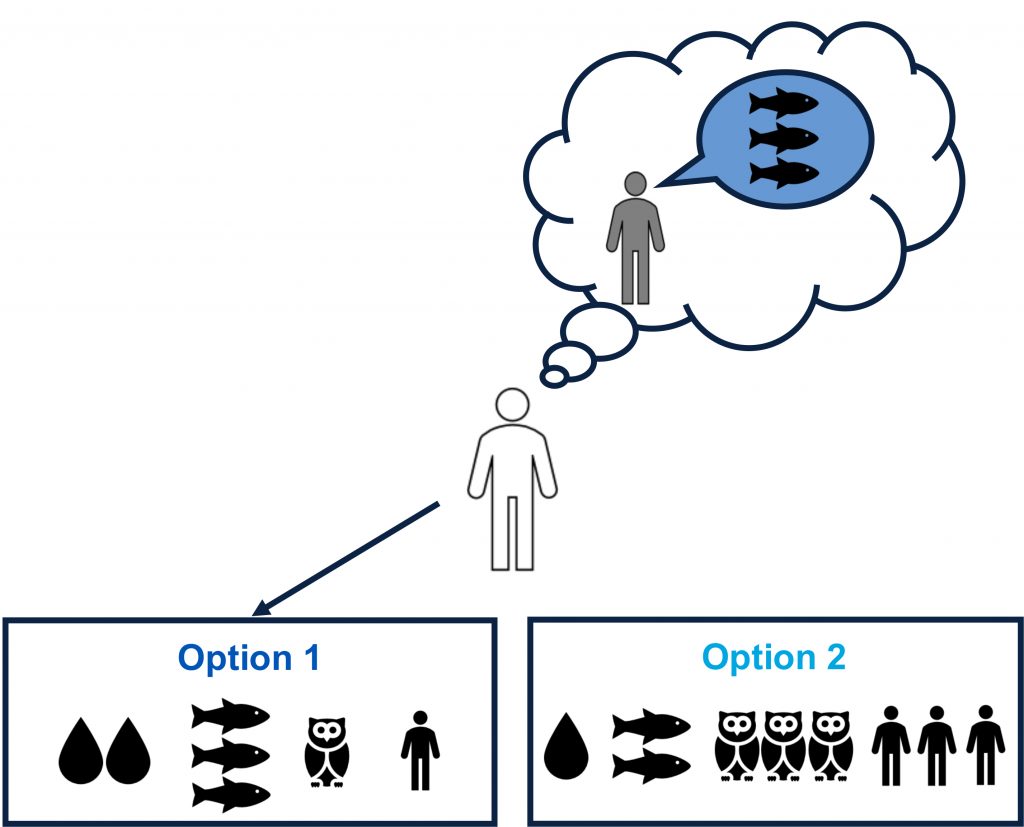
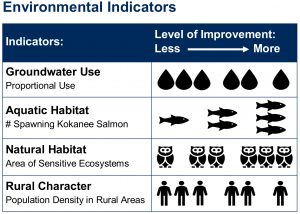 The core of this research project was a choice experiment. In a choice experiment, people are given sets of choices to compare. In this experiment, the choices were between different ways the Central Okanagan could be in thirty years, where those futures were described using four indicators:
- Share of total water use coming from groundwater,
With surface sources largely tapped out, we saw increasing the share of water use from groundwater as increasing the total amount of water being used. - Kokanee salmon spawning returns,
Kokanee are a landlocked salmon species that spawns in tributary creeks and some areas of lakeshore. Land use change threatens the habitat necessary for the Kokanee. - Square kilometers of natural habitat lost,
Much of the most valuable natural habitat is at lower elevations, and privately owned. With continuing development, such land continues to be lost. - Rural population density.
Rural areas in the Okanagan reflect the agricultural heritage of the region. Increasing development in these areas is changing their character.
Survey participants were offered six sets of three choices, where each set included a ‘status quo’, reflecting our opinion about how these indicators will change without any further intervention, and two alternatives that reflected improvement in at least one indicator. These improvements need to be paid for, and each of these alternatives had an associated increase in property taxes to pay for it.
The Deliberation Experiment
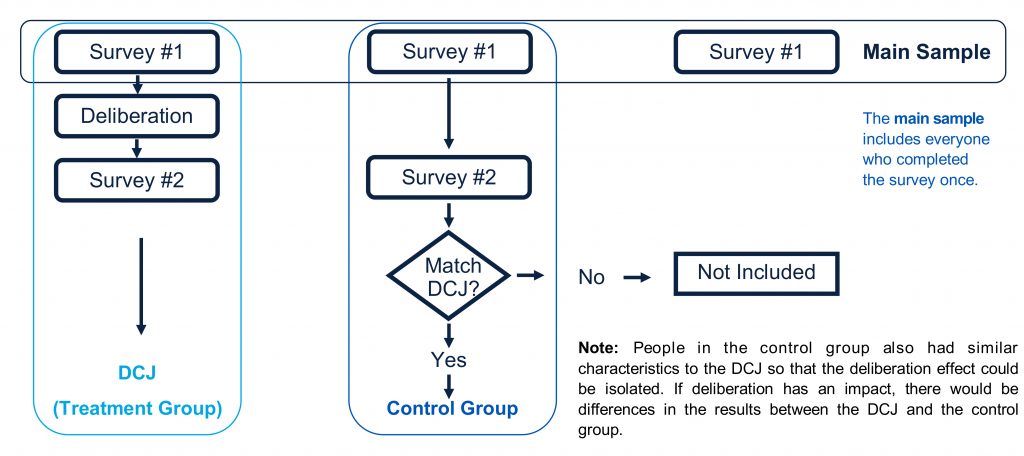 We are social beings, and our opinions and values are likely shaped by our interactions with others. One way we chose to include this in our experiment was with a deliberation exercise. Each participant in the original survey was invited to partake in a pair of sessions where they would engage with a group of other participants in an exercise inspired by the issues at the heart of the choice experiment. After the deliberation, all participants in the survey, whether they were part of the deliberation again, were asked to complete a second, shorter version of the same choice experiment they had originally completed. This allowed us to see if deliberation changed how people responded to the choice experiment.
social network measures
Where deliberation gave people an opportunity to talk with others who completed the survey about survey issues, people may have other circles where they talk about development and the environment in the Okanagan. We added a set of questions to the first choice experiment that collected information about the network that respondents engaged with about development and environment issues. We then included measures that reflected aspects of these networks in our statistical analysis of the data.
Results
heterogeneity
One set of results are summarized in our Heterogeneity Fact Sheet. The fact sheet explores some aspects of the analysis and implications. One important result is that people are quite different in how much they are willing to pay for improvements in the future environmental situation in the central Okanagan.
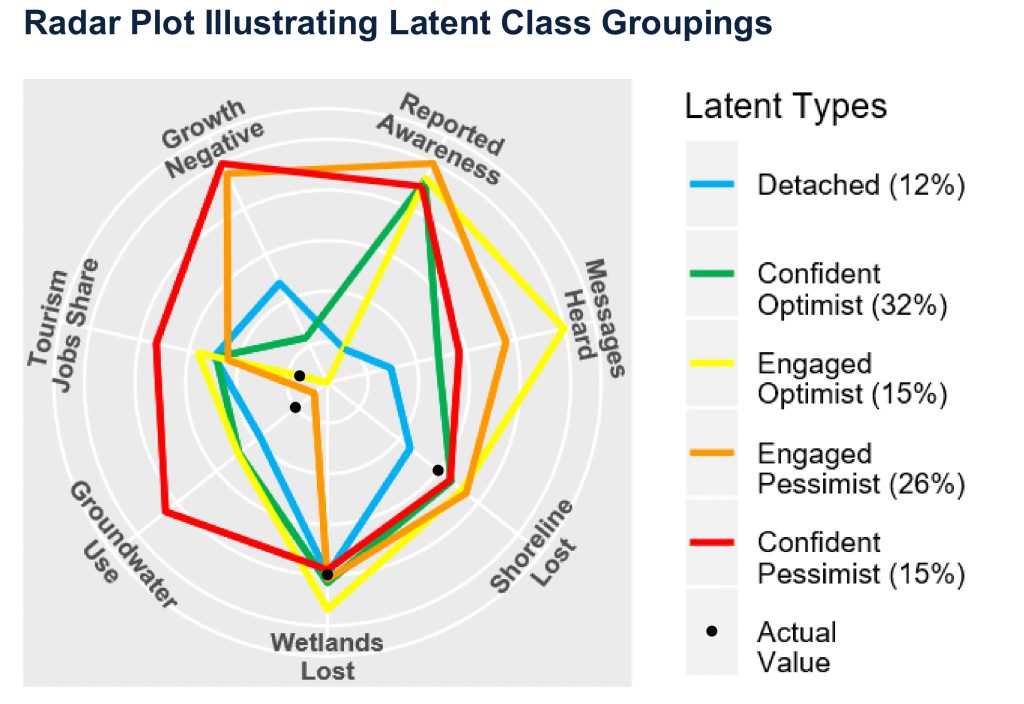
One way to look at this variation between people is by dividing people into groups that are somewhat similar. When we group people into five such groups, we find a few striking differences between the groups. For example, peoples perspective on whether the benefits of development had, on balance, outweighed the damage to the environment distinguished two groups that we labeled as ‘pessimist’ from the other three. Another thing that stood out was the fact that most people substantially overestimated the importance of tourism as an employer in the central Okanagan.
Overall, the survey results enable us to say that for those who participated, there was broad agreement that protecting natural habitats and promoting aquatic health was important. There was less agreement that it would be good to limit the growth of groundwater use and that keeping population densities in rural areas at their current level is a worthwhile goal.
deliberation
Our second fact sheet describes our Deliberation Experiment Results. Three results stood out.
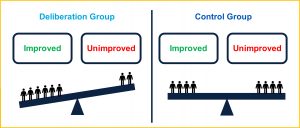 First, people who volunteered to be part of the deliberations seemed to be more concerned about the environment in the Okanagan than the average for the entire sample.
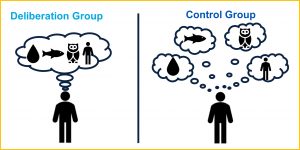 Second, people in the deliberation groups seemed to think about the environmental indicators in a more integrated way. They thought about the relationship between the environmental indicators.
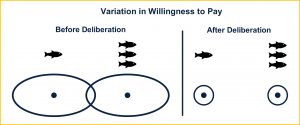 Third, people who participated in the deliberations had less variation between themselves in how much they were willing to pay to see improvements in the environmental indicators. Talking together lead people’s perspectives to converge.
social networks
Our third fact sheet describes our Social Network Analysis. We found that social networks matter! Survey participants with ‘tighter’ networks, networks where the people involved were more connected to each other, were more likely to make choices in the choice experiment that would result in better future environmental outcomes.
Implications
- There is a lot of variation in the amount people are willing to pay to see improvements in the environmental indicators we used. Any approach we choose will therefore have critics who say it has not gone far enough and others who say it has gone too far.
- There is broad agreement that protecting natural areas and enhancing aquatic health is worthy of spending money on. However, there is a wide variation in the amount people think should be spent.
- Engaging people in conversations about the environmental costs of development in the Okanagan tends to build a greater consensus around the desired future.
- Developing relationships within which people talk about the impact of development on the Okanagan environment may increase the amount people are willing to pay to protect that environment.
 Follow