Vancouver Public Bike Share Program Proposal
VANCOUVER PUBLIC BIKE SHARE PROGRAM PROPOSAL
By Annie Fang, Aashmali Patel, Tyler Mark, Nicholas Uleryk-Carvalho
Abstract
This upcoming summer (2016), the City of Vancouver will be implementing a public bike share (PBS) system, enabling individuals to rent and ride bikes within Vancouver, for a fee. They will be installing various bike share stations around the city, in order for accessibility to be “convenient, comfortable, flexible, and affordable to get around,” (Public Bike Share System, 2016). In 2008, Translink began investigating the PBS systems in Metro Vancouver, and concluded that this would benefit the population, establishing a great connection between public transport and cycling, (Public Bike Share System, 2016).
This GIS project maps potential bike share stations within the City of Vancouver based on population density, viability, accessibility of public services, parks and other main tourist attractions. In relation to these categories we created a point based hierarchy system. Features of this hierarchy include pre-existing bikeways, central transit options, top tourist attractions and parks, post secondary institutions, shopping, and roads, in relation to population density. We organized each data set into 3 different categories based on its relevance to city of bike share system objectives. Our map therefore is a representation, based on said point system, of where Vancouver should place 50 of its proposed 150 bike share stations.
Description of Project, Study Area, and Data:
The City of Vancouver is planning to implement a public bike share system in the upcoming months. A bike share is a public service in which individuals may rent bicycles on a short term basis and return the bike to any of the available share stations. We aim to determine the best locations for these bike share stations based on a hierarchical ranking of relevant criteria. We will be classifying specific bike share station points based on levels of importance to public services as referenced in our methods and Figure 1.2. The city of Vancouver is prioritizing the (1) extension of transit and walkability of approximately 20 meters, (2) the reduction of personal vehicle trips, (3) and to trigger a greater interest in cycling and ridership (Public Bike Share System, 2016). We have assigned a value of 1 to 3 (least important to most important) based on the category of each data set, which is referenced in Figure 1.2.
We will be following the budgeting proposal brought forth by the official Vancouver bike share program, which allots for 150 solar powered stations (Public Bike Share System, 2016). We will be focusing only on the City of Vancouver, therefore our share project will be scaled down to one third, or 50 bike shares. Our area of study is a combination of urban planning (Vancouverism), with emphasis on more sustainable transportation options (City of Vancouver, 2012). To do so we drew upon the data as listed in Figure. 1.1.
Methodology of Analysis:
We first began our analysis by collecting and screening our data. We downloaded our data from the sources as referenced in Figure 1.1. We then parsed the data for the exclusive clip of the City of Vancouver, and for the exclusion of areas like Richmond, Burnaby, and Surrey. The result was the base base map of the City of Vancouver, including downtown Vancouver, the basis of our study. With said data, we manually added layers– post secondary institutions and tourist attractions, as there were no shapefiles available. Post secondary campuses are represented as as polygon areas, while tourist attractions are depicted as points. These discrepancies are discussed in our error and uncertainty section.
Once our data was collected, parsed and clipped, it was then organized into a 3-point hierarchy. To measure the level of importance of differing potential bike share locations, we created this hierarchical system to find the ideal locations within the City of Vancouver. As mentioned before we organized each data set into 3 different categories based on its relevance to city of Vancouver’s bike share system goals (Public Bike Share System, 2016). The city of Vancouver is prioritizing the (1) extension of transit and walkability, (2) the reduction of personal vehicle trips, (3) and the triggering of a greater interest in cycling and ridership. In categorizing each data set, we have assigned a value of 1 to 3 (least important to most important) to our spatial data, therein by locating the most important areas. Areas with the most overlap of relative data, and therefore highest score (most importance), are considered for a bike share location.
Once our base map was clipped we added each data layers in conjunction with a buffer range of 20 meters to account for walkability. Population density was not buffered to avoid double counting and instead a separate value hierarchy was implemented. The buffered areas were assigned a value range of 1 (yellow), 2 (orange), and 3 (red), from low to high priority respectively. This bracket is in relation to a 3 tier population density bracket of the same value, ranging from light to dark grey (see Figure 1.2). Each value category was then intersected into one exclusive layer for clarity and to highlight the most prominent areas for PBS. We then calculated which areas had the most overlap, and therefore highest value score. These areas were then designated as one of our 50 bike share stations. (Refer to maps in the appendix for further clarification)
Discussion and Results:
In our discussion, we will outline our resulting observations of our analysis of our data frame. In our process of data collection, input, and editing, we excluded a substantial amount of redundant spatial data. Moreover, observed several implications of our hierarchy system. In our observation of the spatial distribution of the data, most ideal bike share locations were found to be downtown, and revealed several “Hotspots” of potential locations in isolated areas outside of the downtown neighborhood. Furthermore, potential bike share locations naturally created a network of stations connected by bike lines. Finally, we outline the economic, political, and social implications of our proposed bike share system.
Most of the highest scoring potential bike share stations were located in Downtown. This area contained a high number of “Most Important” features in close proximity to one another. In particular, this area had a high density in land features, as well as the largest number of high density enumeration areas. We prioritized placing most of the bike share locations precisely on the “Most Important” (red) areas that also had higher population density. There were other areas outside of Downtown that ranked high in “Most Important” land features, but not in population density. Conclusively, population density was shown to be the most important indicator of potential bike share locations.
Upon creating the final map, we discovered “hotspots”, or highly scoring areas based on our hierarchy system, that were located in isolated areas further away from the Downtown core. However, the decision making process for placing bike share locations required further research and data sourcing of soft data. In particular, our current dataset did not consider demographic information about prevalent lifestyle habits or interests of individuals these neighborhoods. A public survey, where citizens could vote for their favorite specific bike share locations would further improve our study.
We prioritized placing most of the bike share locations precisely on the “most important” (red) areas, with higher population density. We tried to make sure there were more bike share locations closer together for popular areas, particularly if there was clustering of “most important” spots. Because we defined “Walkable” to be a smaller distance of 20 m, many of these red dots did not directly overlap, but we took clustering into account and generally considered those areas as higher priority.
Based on our objective data, most bike share locations were consistently plotted along existing bike lane paths, creating a cohesive network of lanes between each bike share location. However, spatial distance between potential bike share locations were not consistent, and some locations needed to be manually inputted in between distant locations to increase connectivity and flow, thus improving the network.
Some proposed bike share locations did not follow our framework. In the final bike share location selection process, we decided to place a few bike shares in certain locations that did not necessarily rank high, but we considered necessary. As stated early, some bike share locations were placed to reduce spatial distance between stops. We also removed some from isolated hotspot locations, as there was not enough connectivity between locations.
During our spatial data editing and manipulation process, we excluded as much redundant data as possible, to normalize and streamline the information so we could better analyze the final database based on our proposed hierarchy system framework. We had initially proposed more bike share location criteria, but in the process of analyzing the map features and re-evaluating our main objectives, this process resulting in the elimination of a significant amount of redundant information.
For example, upon creating the bus stop layer, we observed that this layer had created spatial data points spread out throughout the entire city. In mitigation of this problem, we researched which bus routes had the highest ridership, and selectively placed priority on the top 15 bus routes. We considered this distinction important, because by placing bike shares in higher traffic areas, this would achieve our objective of increasing bike share use and ridership. Furthermore, the roads layer proved to present a similar problem as the bus stops layer: This layer also contained an excess of spatial information spanning throughout the entire city. Initially, the roads layer was ranked as “Most Important”, but was later changed to “Less Important”. Our rationale was that although we wanted to improve accessibility, we wanted to encourage the use of bike lanes to improve safety. Other layers from our initial proposal, like traffic flow, intersections, and Vancouver public elementary and high schools were also entirely excluded in the final database. Upon further research of City of Vancouver’s proposed bike share, we learned that bikes were adult sized and not suited for children. Therefore, we removed this dataset from our final database analysis.
To improve our analysis, we created a hierarchy system to improve our assessment of potential bike share locations. Our hierarchy system was only one possible framework; however, another type of hierarchy system may have yielded different results. There were limitations in our process of creating our algorithm, because our study was limited by our resources and skill set. For example, we were limited by our inability to code and technological resources to create an algorithm that would more accurately choose bike share locations. Consequently, these locations were visually interpreted and chosen. Manually adding up the scores of each point improved our selection process. Upon intersecting layers to join layers of highest importance, it merged the layers of polygons together. Intersecting the layers also created a loss of data. To exemplify this, if two “most important” ranking bus stops were in close proximity to each other and less than 20m apart from each other, they would overlap. If the layer was not intersected, then the overlapping part of the 2 areas would have a value of 6. However, upon intersecting the layers, the same spot would have a value of 3.
Following our hierarchy system framework, we reclassified population density into three classes. Downtown Vancouver is a highly dense but small area. This means it is highly susceptible or sensitive to changes in the sizes of each class. A slight change in the range of a class, may increase in range for the “Most Important” category. Resultantly, this could create a drastic increase of potential bike share locations downtown and a significantly reduced number of potential areas outside of downtown.
There were several economic, political, and social implications that we were able to observe in our analysis. In our study, we considered the objectives posed by the City of Vancouver’s Public Bike Share program to improve the practicality of our proposal. In particular, we aimed to encourage walkability and increasing public modes of transit, to reduce private modes of transit. We also aimed to maximize accessibility and ridership by placing the bike shares in highly dense locations of features of interest. In high traffic areas like downtown, the implementation of our proposed bike share system would encourage the use of bikes over private transit, effectively reducing traffic levels. Although we tried to maximize walkability to bike share locations, accessibility may be limited to the economic income of those living or working in proximity to the stations. There was a limitation on attaining data on demographics on economic income of individuals based on their location of workplace. However, by increasing walkability to bike share stations, it may incentivize individuals to use public transportation systems over personal modes of transit. This meets another goal, “reduce the need of personal trips”, outlined by the City of Vancouver’s public bike share system objectives. The implementation of a bike share system, in highly dense and walkable and accessible areas, will be more effective in encouraging a more sustainable lifestyle. Thus, reducing human impact on the environment through the reduced production of carbon into the atmosphere. Bike share system were placed in areas that also had high tourism traffic, so it’s implementation could have economic implications on the local economy. In particular, as the downtown location contained the most bike share locations and tourist attractions, we expect increased ridership in those areas. Some areas, would require more data analysis that we did not include in our research. For example, the social implications of including a bike share in downtown east side. Our data does show a DTES location as a higher ranking location, however, it may not be safe or economically feasible to be implemented.
Error and Uncertainty:
We encountered several issues with the collection of our data. The shape files for data such as roads and bikeways were only available as lines. As such, there there maybe be some issues of scale since they were not represented as areas. In an attempt to alleviate this we added 20 meter buffers around specific layers to universalize measurements but may also be considered as generalization. Similarly, there was some data that we could not locate. For example, we were unable to find data on tourist attractions. Therefore we cross referenced Vancouver Tourism’s “top 10 attractions” with Google Maps and manually input points. Though on a large scale, this may cause some inaccuracy (Tourism Vancouver Official Map Downtown Vancouver, 2014).
Due to a lack of information of physical landscape we were unable to make a fully integrated map based on Vancouver’s geography. Although a majority of bike shares were located downtown were could not accurately account for aspect. The Vancouver bike share program is proposing that stations will be solar powered and therefore we are unsure how building shadows will affect viability. In a similar way we do not know the extent to which slope and land contours will affect rider preferences in terms of which bike routes they will take.
While implementing proposed PBS station locations, there were various limitations, errors and uncertainties in creating our map, alongside analyzing the results. In creating our base map for the city of Vancouver, we clipped out the neighboring greater Vancouver area. For example, when Burnaby was excluded from our map, it’s population over a larger area was concentrated into several high population deviations along Boundary road. Similarly, there were additional aberrant points along Foreshore trail at UBC. These discrepant census tracts and populations were excluded as shown in Figure 1.3. These points caused volatile spikes in our natural breaks which affected our calculations when rounding numbers. Likewise, insignificant data like minor parks and bus routes were also discluded for clarity, but may account for bias.
As with any map, there is a certain degree of bias in our representation. UBC was not provided in our data set because it is part of endowment lands, therefore we had to manually vector in the area. This can be interpreted as bias in the same way that our PBS station location are. In doing these types of subjective maps we were also unable to account for intersectionality of individual’s utility. There was some concentration of value points in the downtown East Hasting area, but we decided against the inclusion of PBS stations here due to lower income brackets. This raises ethical questions in terms of perpetuating the gentrification rhetoric.
Further Research/recommendations:
We have proposed an initial number of 50 bike share locations for Vancouver, but the city aims to install 150 locations in total. As this is an incipient project for the City of Vancouver there are issues that may emerge. These issues can be avoided through further research and analysis before the final 100 stations are installed.
Research into other cities’ bike share programs such as Toronto, Montreal, or Seattle can highlight how these cities have dealt with their own sets of problems that came with their respective bike share systems. In Toronto, Bixi implemented the original bike share program, but went bankrupt and was taken over by the City of Toronto after it could not pay back its $3.9- billion loan from. Why did this happen and how can it be avoided in Vancouver?
Further research that looks at average income for specific census tracts will provide valuable information for siting further bike share locations. Only those with with disposable income will be able to afford and use the PBS. This will prevent bike share locations from being sited in low income neighborhoods where the PBS will see limited use or become the target of petty theft.
Surveying Vancouverites to determine where PBS locations should be sited is an area that requires further research. Determining which locations are most desired and will receive the most use by the populace will greatly improve the efficiency and quality of the PBS.
The final area that requires further research regards topography. Locating major hills and avoiding them when siting PBS locations will greatly enhance the system. It seems logical to assume that many people will use the bikes to travel downhill and will be reluctant to ride up large hills, causing an unequal distribution of bikes throughout stations.
Further research into these areas will not only make the PBS more enjoyable for its users, but will also avoid issues that may cause the system to fail financially, or waste time and money unnecessarily.
Appendices:
Figure 1.1: Project Data Acquisition:
| Layer Name: | Attribute/Tabular Data: | Source: |
| Roads | Type of roads | Data BC |
| Post secondary institutions | Locations | ChooseBC Program |
| Bus routes | Locations | UBC Library Data Services Dataverse |
| Skytrain | Station Locations | Data BC |
| Shopping | Locations | G Drive |
| Census Data | Population Density | University of Toronto |
| Tourist attractions | Locations | Tourism Vancouver ● Based off of their top 10attractions |
| Bike Lanes (BIKEWAYS) | Location of lanes | Data BC |
| Parks | Locations | Data BC |
Figure 1.2: Public Service Value Hierarchy and Color Scheme:
| 1 Point – yellow
|
2 Point – orange
|
3 Point – red
|
| – Shopping – Road | – Top 10 Tourist Attractions
– Top 15 Parks – Post Secondary institutions |
– Top 10 Bus routes
– Skytrain stops – Bikeways |
| 1 Point – light grey
|
2 Point – grey
|
3 Point – dark grey
|
| Population: 0 – 6340 | Population: 6340 – 15230
|
Population: 15230 – 40100 |
Figure 1.3: Excluded Deviant Census Tracts and Populations
| Census tracts
|
Population (per km2)
|
| 9330228.04 | 164911434.992 |
| 9330229.00 | 156489295.986 |
| 9330228.02 | 2866145.51174 |
| 9330227.02 | 416161.440428 |
| 9330220.00 | 96697.627985 |
| 9330221.01 | 42548.697766 |
| 9330150.00 | 42352.343829 |
Maps:
Figure 2.1: Areas of Importance for Analysis (before any ArcGIS functions were implemented):
Figure 3.1: Potential Bike Share Locations (focusing solely on Downtown Vancouver):
POTENTIAL BIKE SHARE LOCATIONS IN DOWNTOWN VANCOUVER
̄
Location Rankings
3 Point: Most Important 2 Point: Moderately Important 1 Point: Less Important
Population Density
1 Point: Less Important 2 Point: Moderately Important 3 Point: Most Important
0 0.150.3 0.6 0.9 1.2 Kilometers
Source: Data BC, UBC Library, UofT Library, HelloBC, Tourism Vancouver
Figure 3.2: Proposed Bike Share Location (focusing solely on Downtown Vancouver):
Figure 3.3: Bike Share Location (Independently Mapped in Downtown Vancouver):
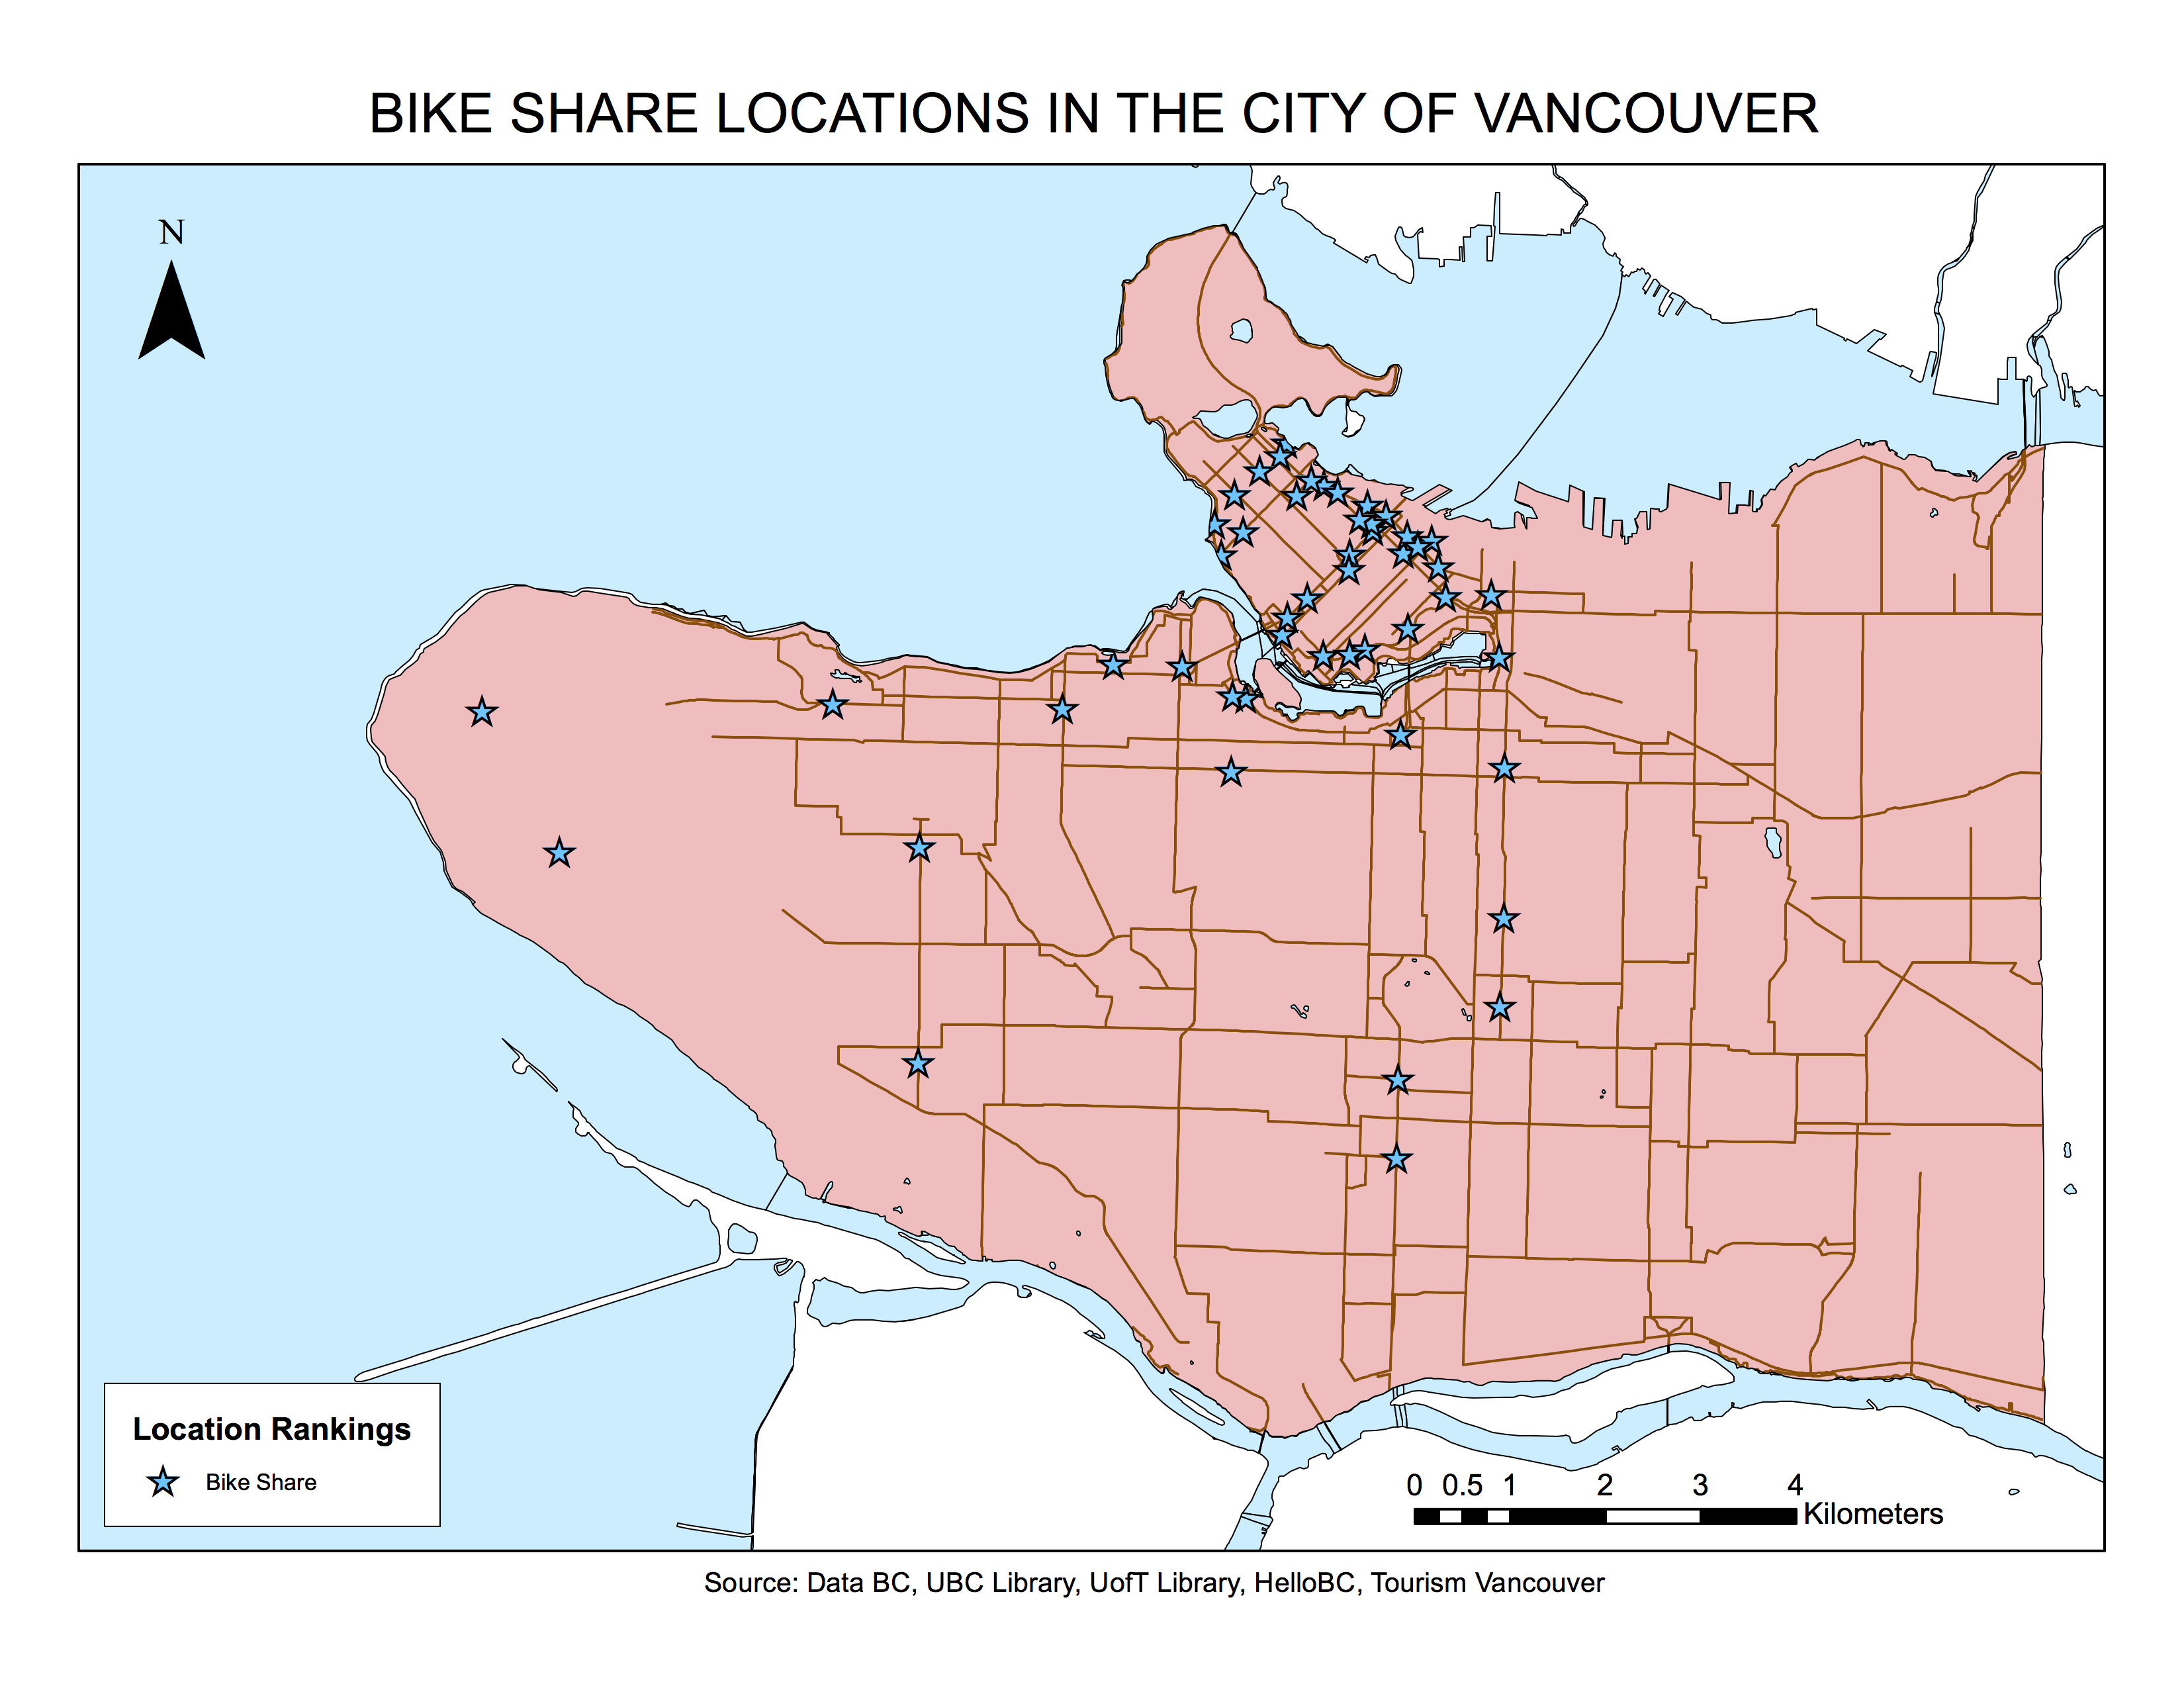
BIKE SHARE LOCATIONS IN DOWNTOWN VANCOUVER
̄
_^ Location Rankings
^_ Bike Share
_^
^_ _^ _^_^
^_
^_ ^_ ^_ _^ _^
^_
1.5 2
^_ Source: Data BC, UBC Library, UofT Library, HelloBC, Tourism Vancouver
1
^_ Kilometers
_^ ^_
_^ _^
_^ _^ ^_ _^
^_ ^_
^_ ^_ ^_ ^_ _^ _^
_^ ^_
^_ ^_
_^^_ ^_ ^_^_
^_ ^_
0 0.25 0.5
Figure 4.1: Potential Bike Share Locations (Overview of Metro Vancouver):
Figure 4.2: Proposed Bike Share Location (Overview of Metro Vancouver):
Figure 4.3: Bike Share Location (Independently Mapped in Metro Vancouver):
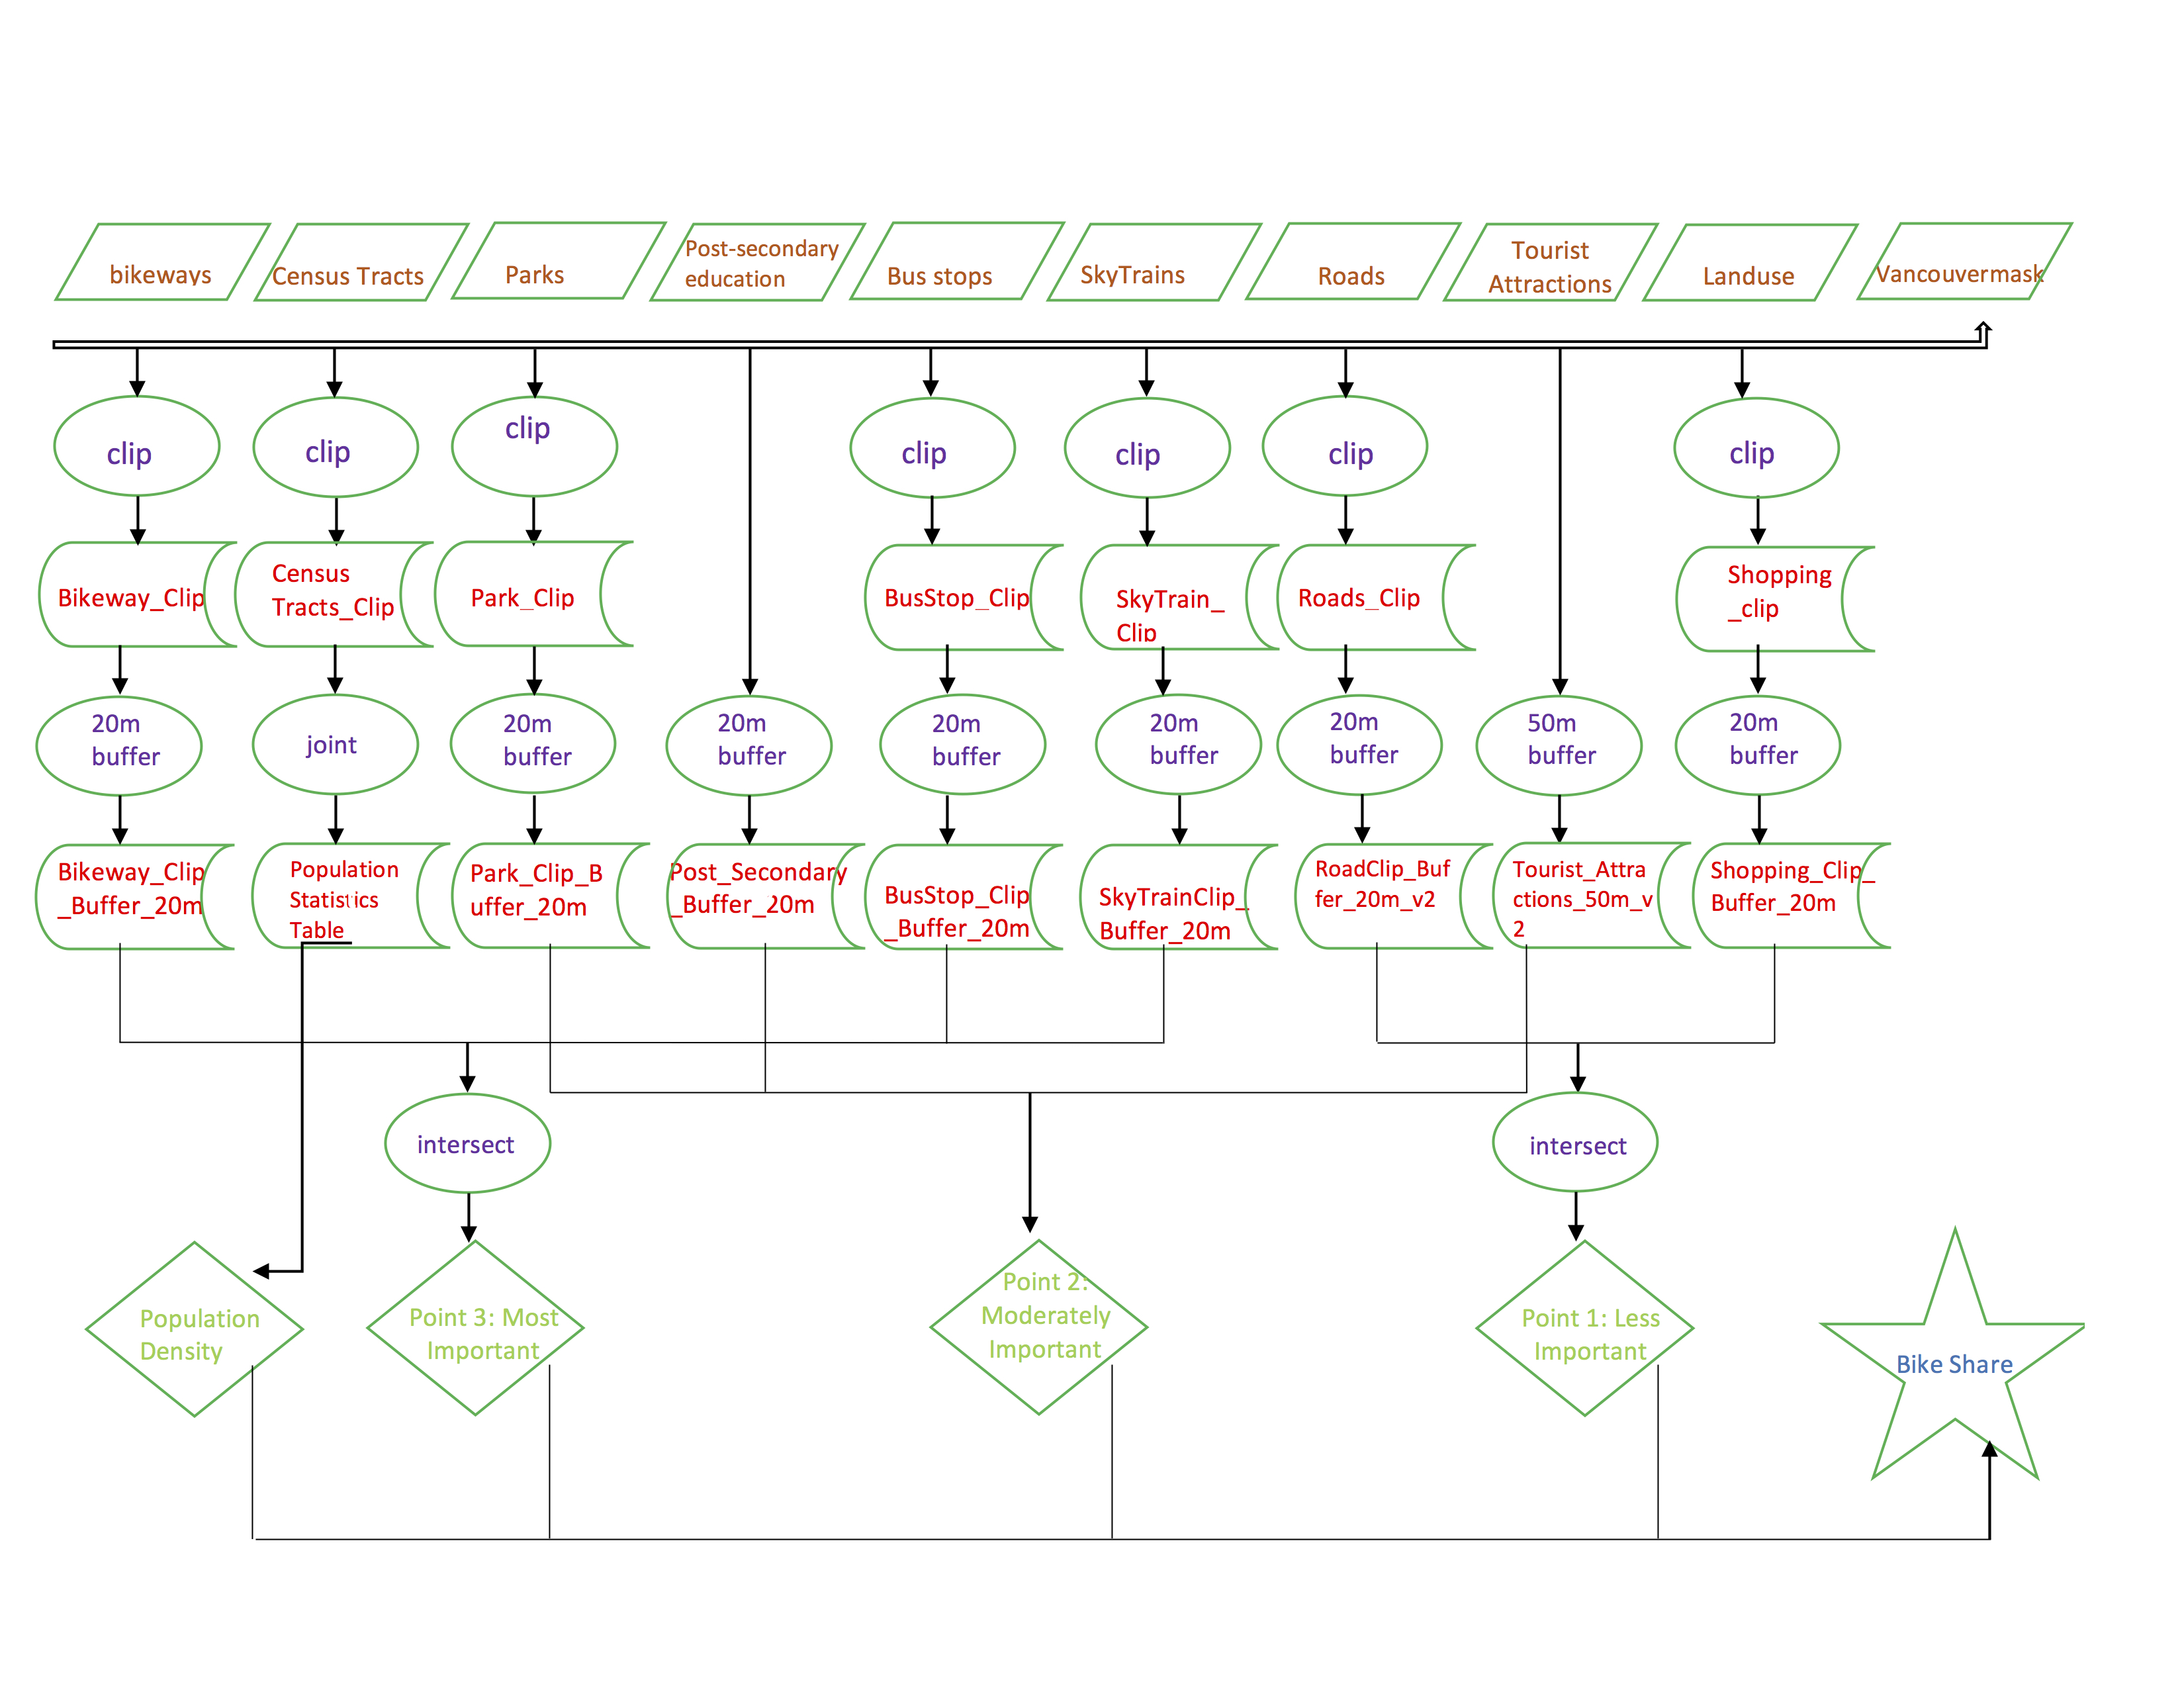
Flow Chart for Public Bike Share System Project:
bikeways
clip
Bikeway_Clip
20m buffer
Bikeway_Clip _Buffer_20m
Population Density
Parks
clip
Park_Clip
20m buffer
Park_Clip_B uffer_20m
intersect
Point 3: Most Important
Post-secondary education
20m buffer
Post_Secondary
SkyTrains Roads
clip clip
SkyTrain_ Roads_Clip Clip
20m 20m buffer buffer
SkyTrainClip_ RoadClip_Buf
Buffer_20m
Tourist Attractions
50m buffer
Tourist_Attra ctions_50m_v 2
intersect
Point 1: Less Important
Vancouvermask
Census Tracts
clip
Census Tracts_Clip
joint
Population Statistics Table
P
Bus stops
clip
BusStop_Clip
20m buffer
BusStop_Clip _Buffer_20m
fer_20m_v2
Landuse
clip
Shopping _clip
20m buffer
Shopping_Clip_ Buffer_20m
_Buffer_20m
Point 2: Moderately Important
Bike Share
Flow Chart:
Figure 5.1: Final Flow Chart of the PBS System Project:
Bibliography
“10 Vancouver Must-See Attractions.” 10 Vancouver Must-See Attractions. Web. 08 Apr. 2016. <http://www.tourismvancouver.com/activities/attractions/10-must-see-attractions/>.
“Open Data Catalogue.” Data Catalogue: City of Vancouver Open Data Catalogue -Beta Version. Web. 08 Apr. 2016. <http://data.vancouver.ca/datacatalogue/index.htm>.
“Parks.” Parks. Web. 08 Apr. 2016. <http://www.hellobc.com/vancouver/things-to-do/parks wildlife/parks.aspx>.
Planning a Livable, Sustainable City. 2012. Web. 08 Apr 2016. http://vancouver.ca/home- property-development/urban-planning.aspx
“Public Bike Share System.” Public Bike Share System. Web. 08 Apr. 2016. <http://vancouver.ca/streets-transportation/public-bike-share-system.aspx>.
TransLink (South Coast British Columbia Transportation Authority), and Paul Lesack. TransLink Transit GIS Data, 14 September 2015. University of British Columbia Library, 2015. Web.
“Tourism Vancouver Official Map Downtown Vancouver.” Https://res 2.cloudinary.com/simpleview/image/upload/v1/clients/vancouverbc/downtown_vancouve r_map_f3696608-6be1-4318-9b04-02d0a4170b3a.pdf. Vancouver: City of Vancouver, 2014. 1-2. Print.
tainable lifestyle. Thus, reducing human impact on the environment through the reduced production of carbon into the atmosphere. Bike share system were placed in areas that also had high tourism traffic, so it’s implementation could have economic implications on the local economy. In particular, as the downtown location contained the most bike share locations and tourist attractions, we expect increased ridership in those areas. Some areas, would require more data analysis that we did not include in our research. For example, the social implications of including a bike share in downtown east side. Our data does show a DTES location as a higher ranking location, however, it may not be safe or economically feasible to be implemented.
Error and Uncertainty:
We encountered several issues with the collection of our data. The shape files for data such as roads and bikeways were only available as lines. As such, there there maybe be some issues of scale since they were not represented as areas. In an attempt to alleviate this we added 20 meter buffers around specific layers to universalize measurements but may also be considered as generalization. Similarly, there was some data that we could not locate. For example, we were unable to find data on tourist attractions. Therefore we cross referenced Vancouver Tourism’s “top 10 attractions” with Google Maps and manually input points. Though on a large scale, this may cause some inaccuracy (Tourism Vancouver Official Map Downtown Vancouver, 2014).
Due to a lack of information of physical landscape we were unable to make a fully integrated map based on Vancouver’s geography. Although a majority of bike shares were located downtown were could not accurately account for aspect. The Vancouver bike share program is proposing that stations will be solar powered and therefore we are unsure how building shadows will affect viability. In a similar way we do not know the extent to which slope and land contours will affect rider preferences in terms of which bike routes they will take.
While implementing proposed PBS station locations, there were various limitations, errors and uncertainties in creating our map, alongside analyzing the results. In creating our base map for the city of Vancouver, we clipped out the neighboring greater Vancouver area. For example, when Burnaby was excluded from our map, it’s population over a larger area was concentrated into several high population deviations along Boundary road. Similarly, there were additional aberrant points along Foreshore trail at UBC. These discrepant census tracts and populations were excluded as shown in Figure 1.3. These points caused volatile spikes in our natural breaks which affected our calculations when rounding numbers. Likewise, insignificant data like minor parks and bus routes were also discluded for clarity, but may account for bias.
As with any map, there is a certain degree of bias in our representation. UBC was not provided in our data set because it is part of endowment lands, therefore we had to manually vector in the area. This can be interpreted as bias in the same way that our PBS station location are. In doing these types of subjective maps we were also unable to account for intersectionality of individual’s utility. There was some concentration of value points in the downtown East Hasting area, but we decided against the inclusion of PBS stations here due to lower income brackets. This raises ethical questions in terms of perpetuating the gentrification rhetoric.
Further Research/recommendations:
We have proposed an initial number of 50 bike share locations for Vancouver, but the city aims to install 150 locations in total. As this is an incipient project for the City of Vancouver there are issues that may emerge. These issues can be avoided through further research and analysis before the final 100 stations are installed.
Research into other cities’ bike share programs such as Toronto, Montreal, or Seattle can highlight how these cities have dealt with their own sets of problems that came with their respective bike share systems. In Toronto, Bixi implemented the original bike share program, but went bankrupt and was taken over by the City of Toronto after it could not pay back its $3.9-billion loan from. Why did this happen and how can it be avoided in Vancouver?
Further research that looks at average income for specific census tracts will provide valuable information for siting further bike share locations. Only those with with disposable income will be able to afford and use the PBS. This will prevent bike share locations from being sited in low income neighborhoods where the PBS will see limited use or become the target of petty theft.
Surveying Vancouverites to determine where PBS locations should be sited is an area that requires further research. Determining which locations are most desired and will receive the most use by the populace will greatly improve the efficiency and quality of the PBS.
The final area that requires further research regards topography. Locating major hills and avoiding them when siting PBS locations will greatly enhance the system. It seems logical to assume that many people will use the bikes to travel downhill and will be reluctant to ride up large hills, causing an unequal distribution of bikes throughout stations.
Further research into these areas will not only make the PBS more enjoyable for its users, but will also avoid issues that may cause the system to fail financially, or waste time and money unnecessarily.
Appendix:
Figure 1.1: Project Data Acquisition:
| Layer Name: | Attribute/Tabular Data: | Source: |
| Roads | Type of roads | Data BC |
| Post secondary institutions | Locations | ChooseBC Program |
| Bus routes | Locations | UBC Library Data Services Dataverse |
| Skytrain | Station Locations | Data BC |
| Shopping | Locations | G Drive |
| Census Data | Population Density | University of Toronto |
| Tourist attractions | Locations | Tourism Vancouver
● Based off of their top 10 attractions |
| Bike Lanes (BIKEWAYS) | Location of lanes | Data BC |
| Parks | Locations | Data BC |
Figure 1.2: Public Service Value Hierarchy and Color Scheme:
| 1 Point – yellow | 2 Point – orange | 3 Point – red |
| – Shopping
– Road
|
– Top 10 Tourist Attractions
– Top 15 Parks – Post Secondary institutions |
– Top 10 Bus routes
– Skytrain stops – Bikeways |
| 1 Point – light grey | 2 Point – grey | 3 Point – dark grey |
| Population: 0 – 6340 | Population: 6340 – 15230 | Population: 15230 – 40100 |
Figure 1.3: Excluded Deviant Census Tracts and Populations
| Census tracts | Population (per km2) |
| 9330228.04 | 164911434.992 |
| 9330229.00 | 156489295.986 |
| 9330228.02 | 2866145.51174 |
| 9330227.02 | 416161.440428 |
| 9330220.00 | 96697.627985 |
| 9330221.01 | 42548.697766 |
| 9330150.00 | 42352.343829 |
Maps:
Figure 3.1: Potential Bike Share Locations (focusing solely on Downtown Vancouver):
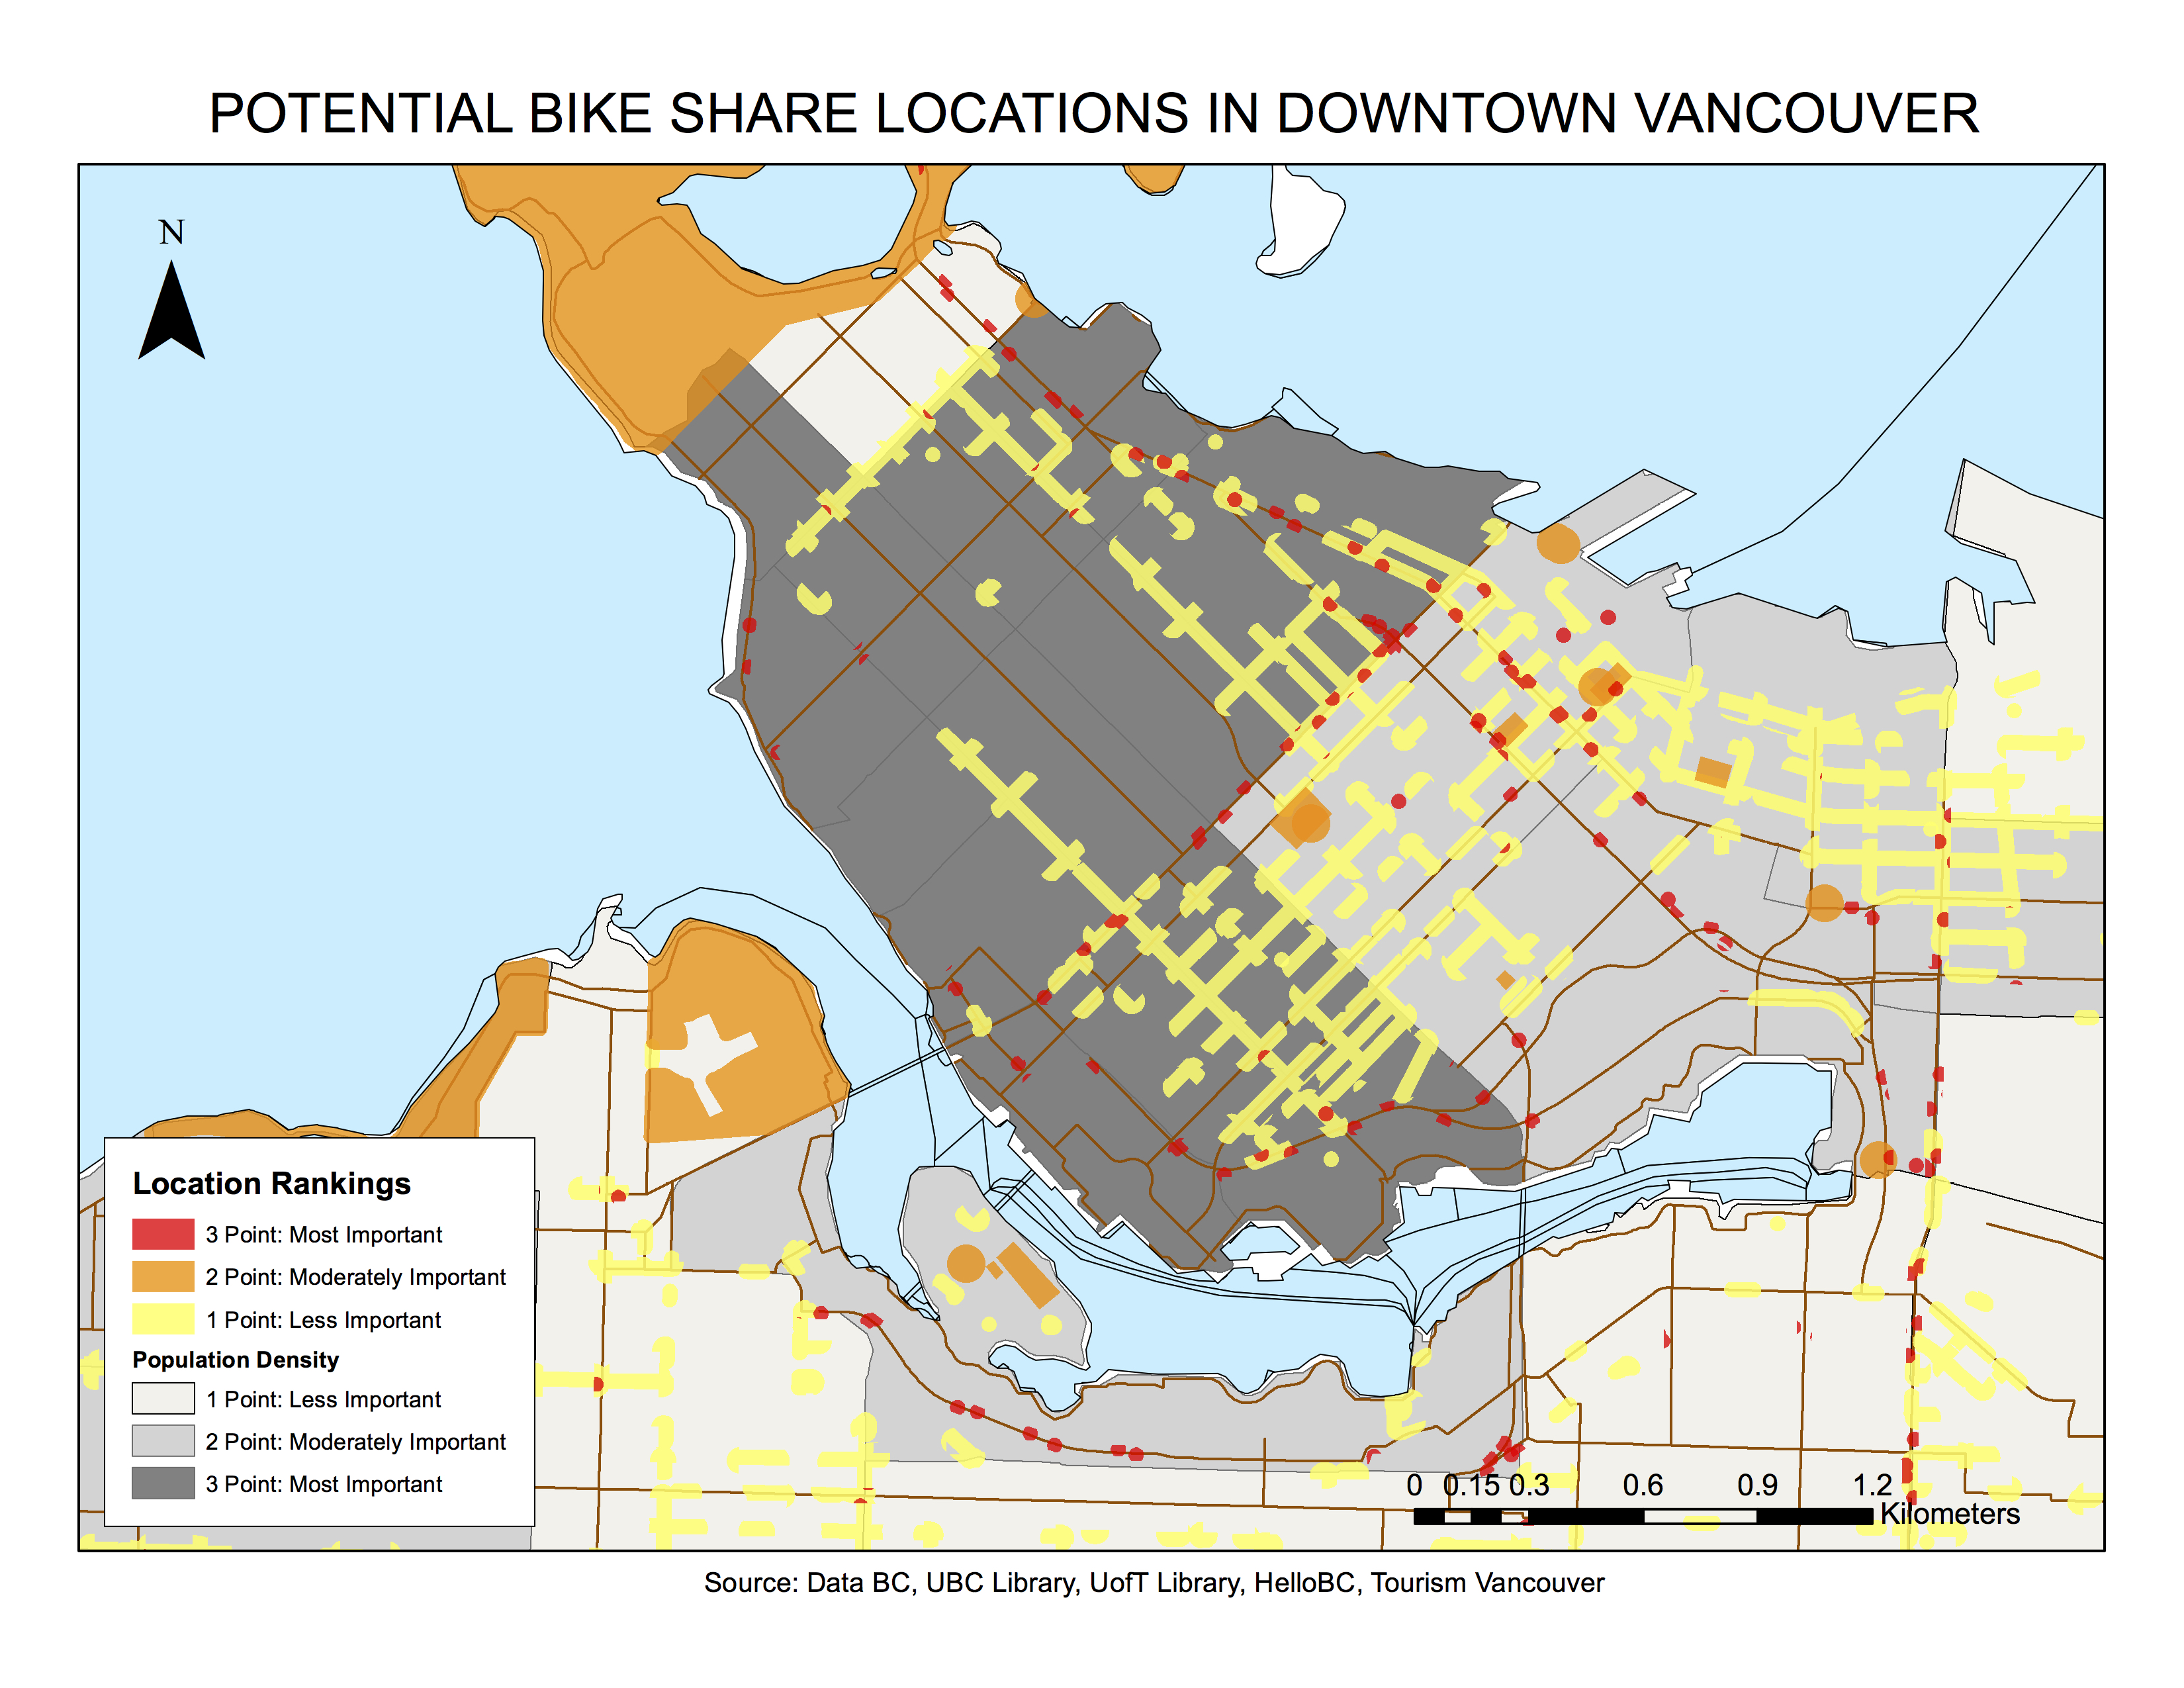 Figure 3.2: Proposed Bike Share Location (focusing solely on Downtown Vancouver):
 Figure 3.3: Bike Share Location (Independently Mapped in Downtown Vancouver):
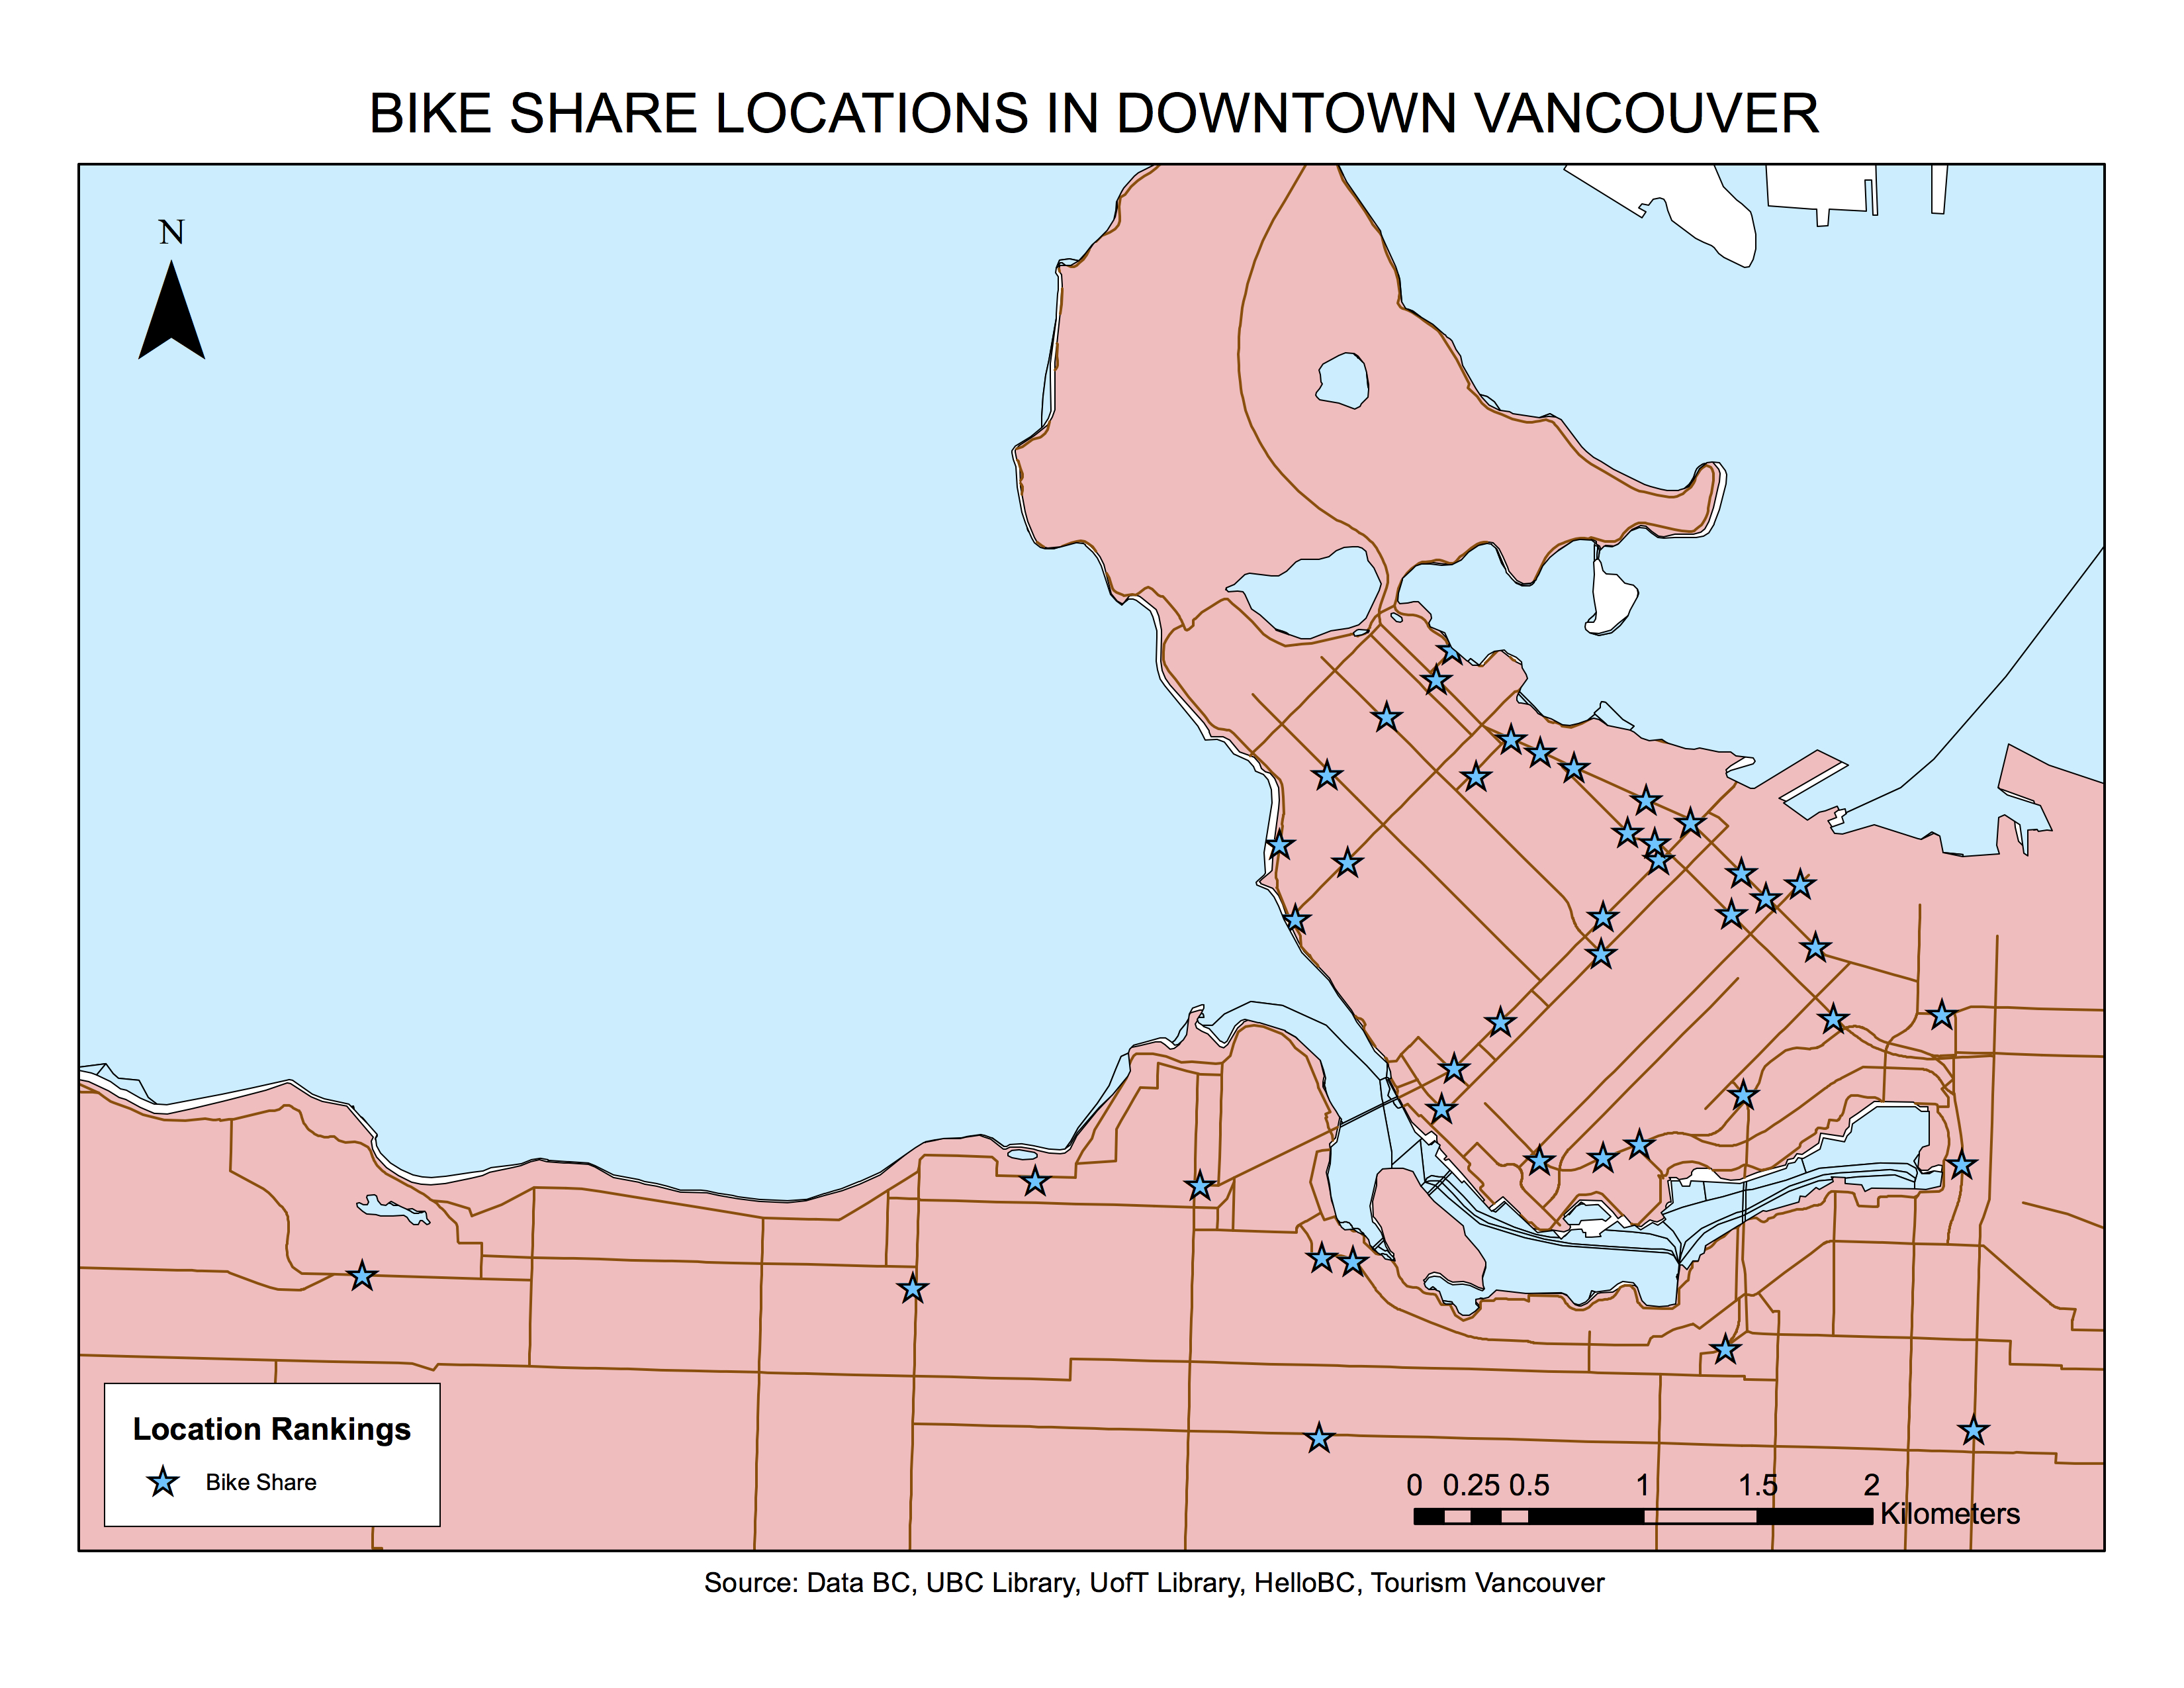
Figure 4.1: Potential Bike Share Locations (Overview of Metro Vancouver):
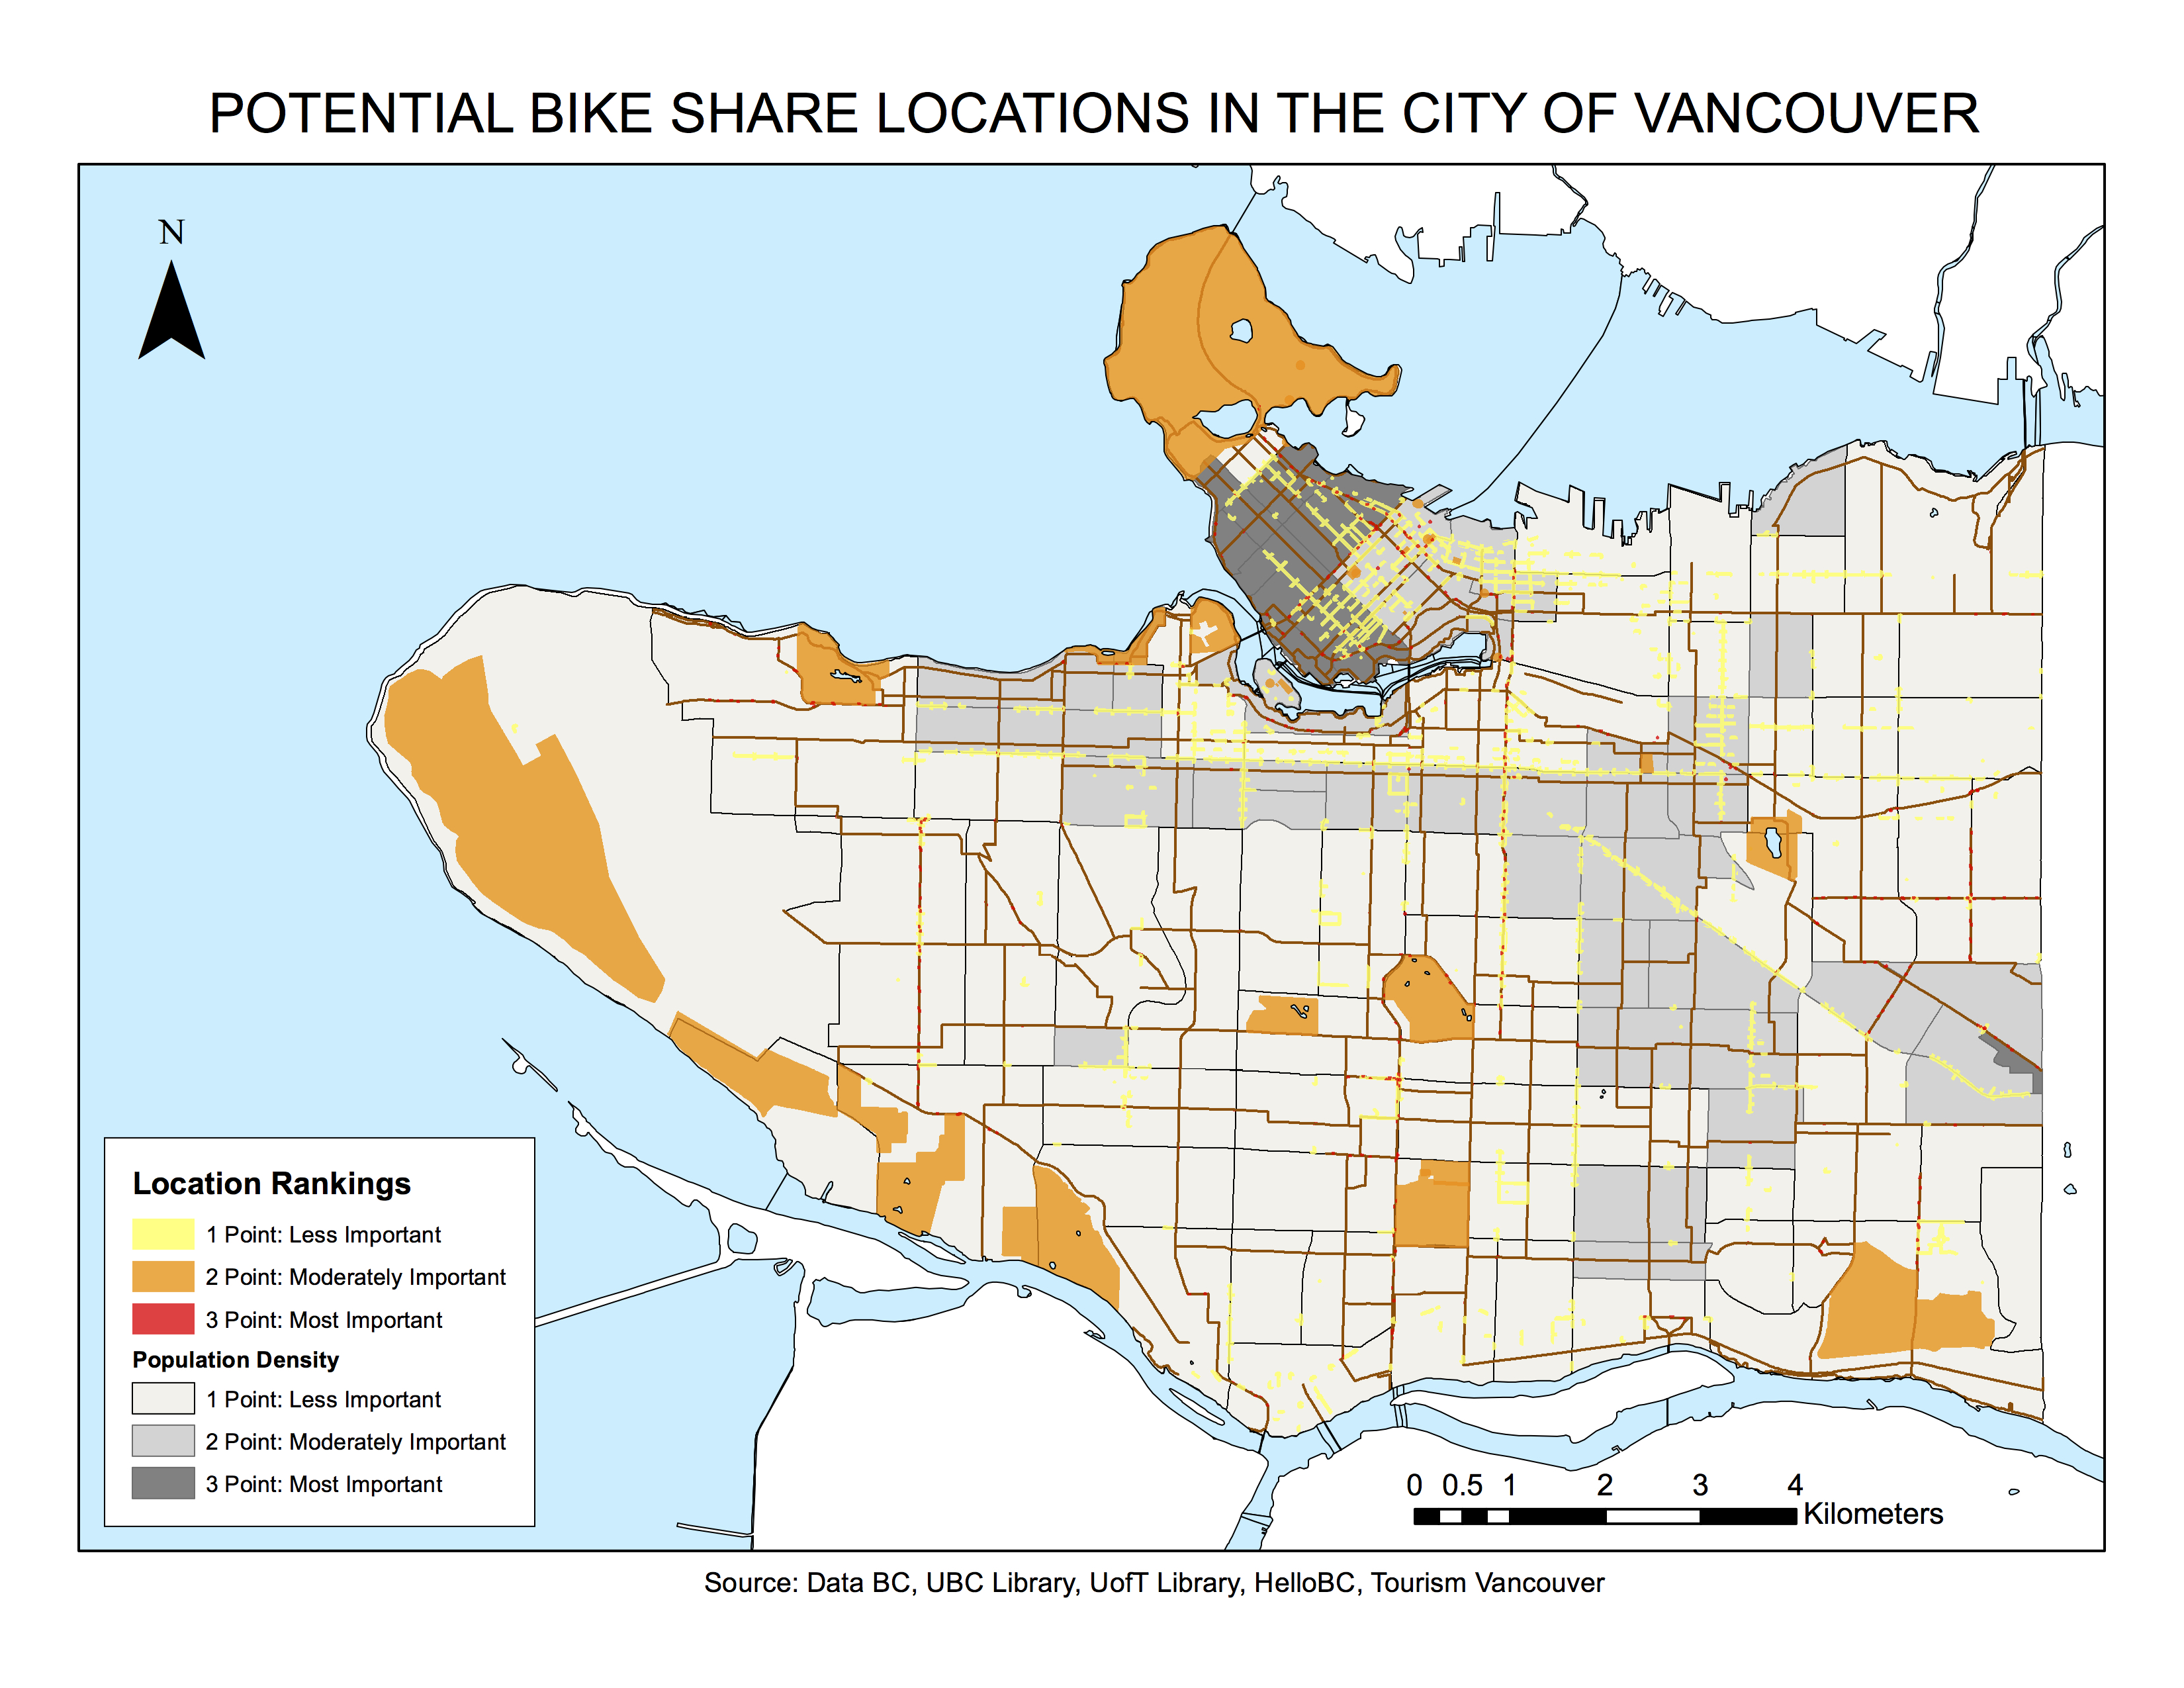 Figure 4.2: Proposed Bike Share Location (Overview of Metro Vancouver):
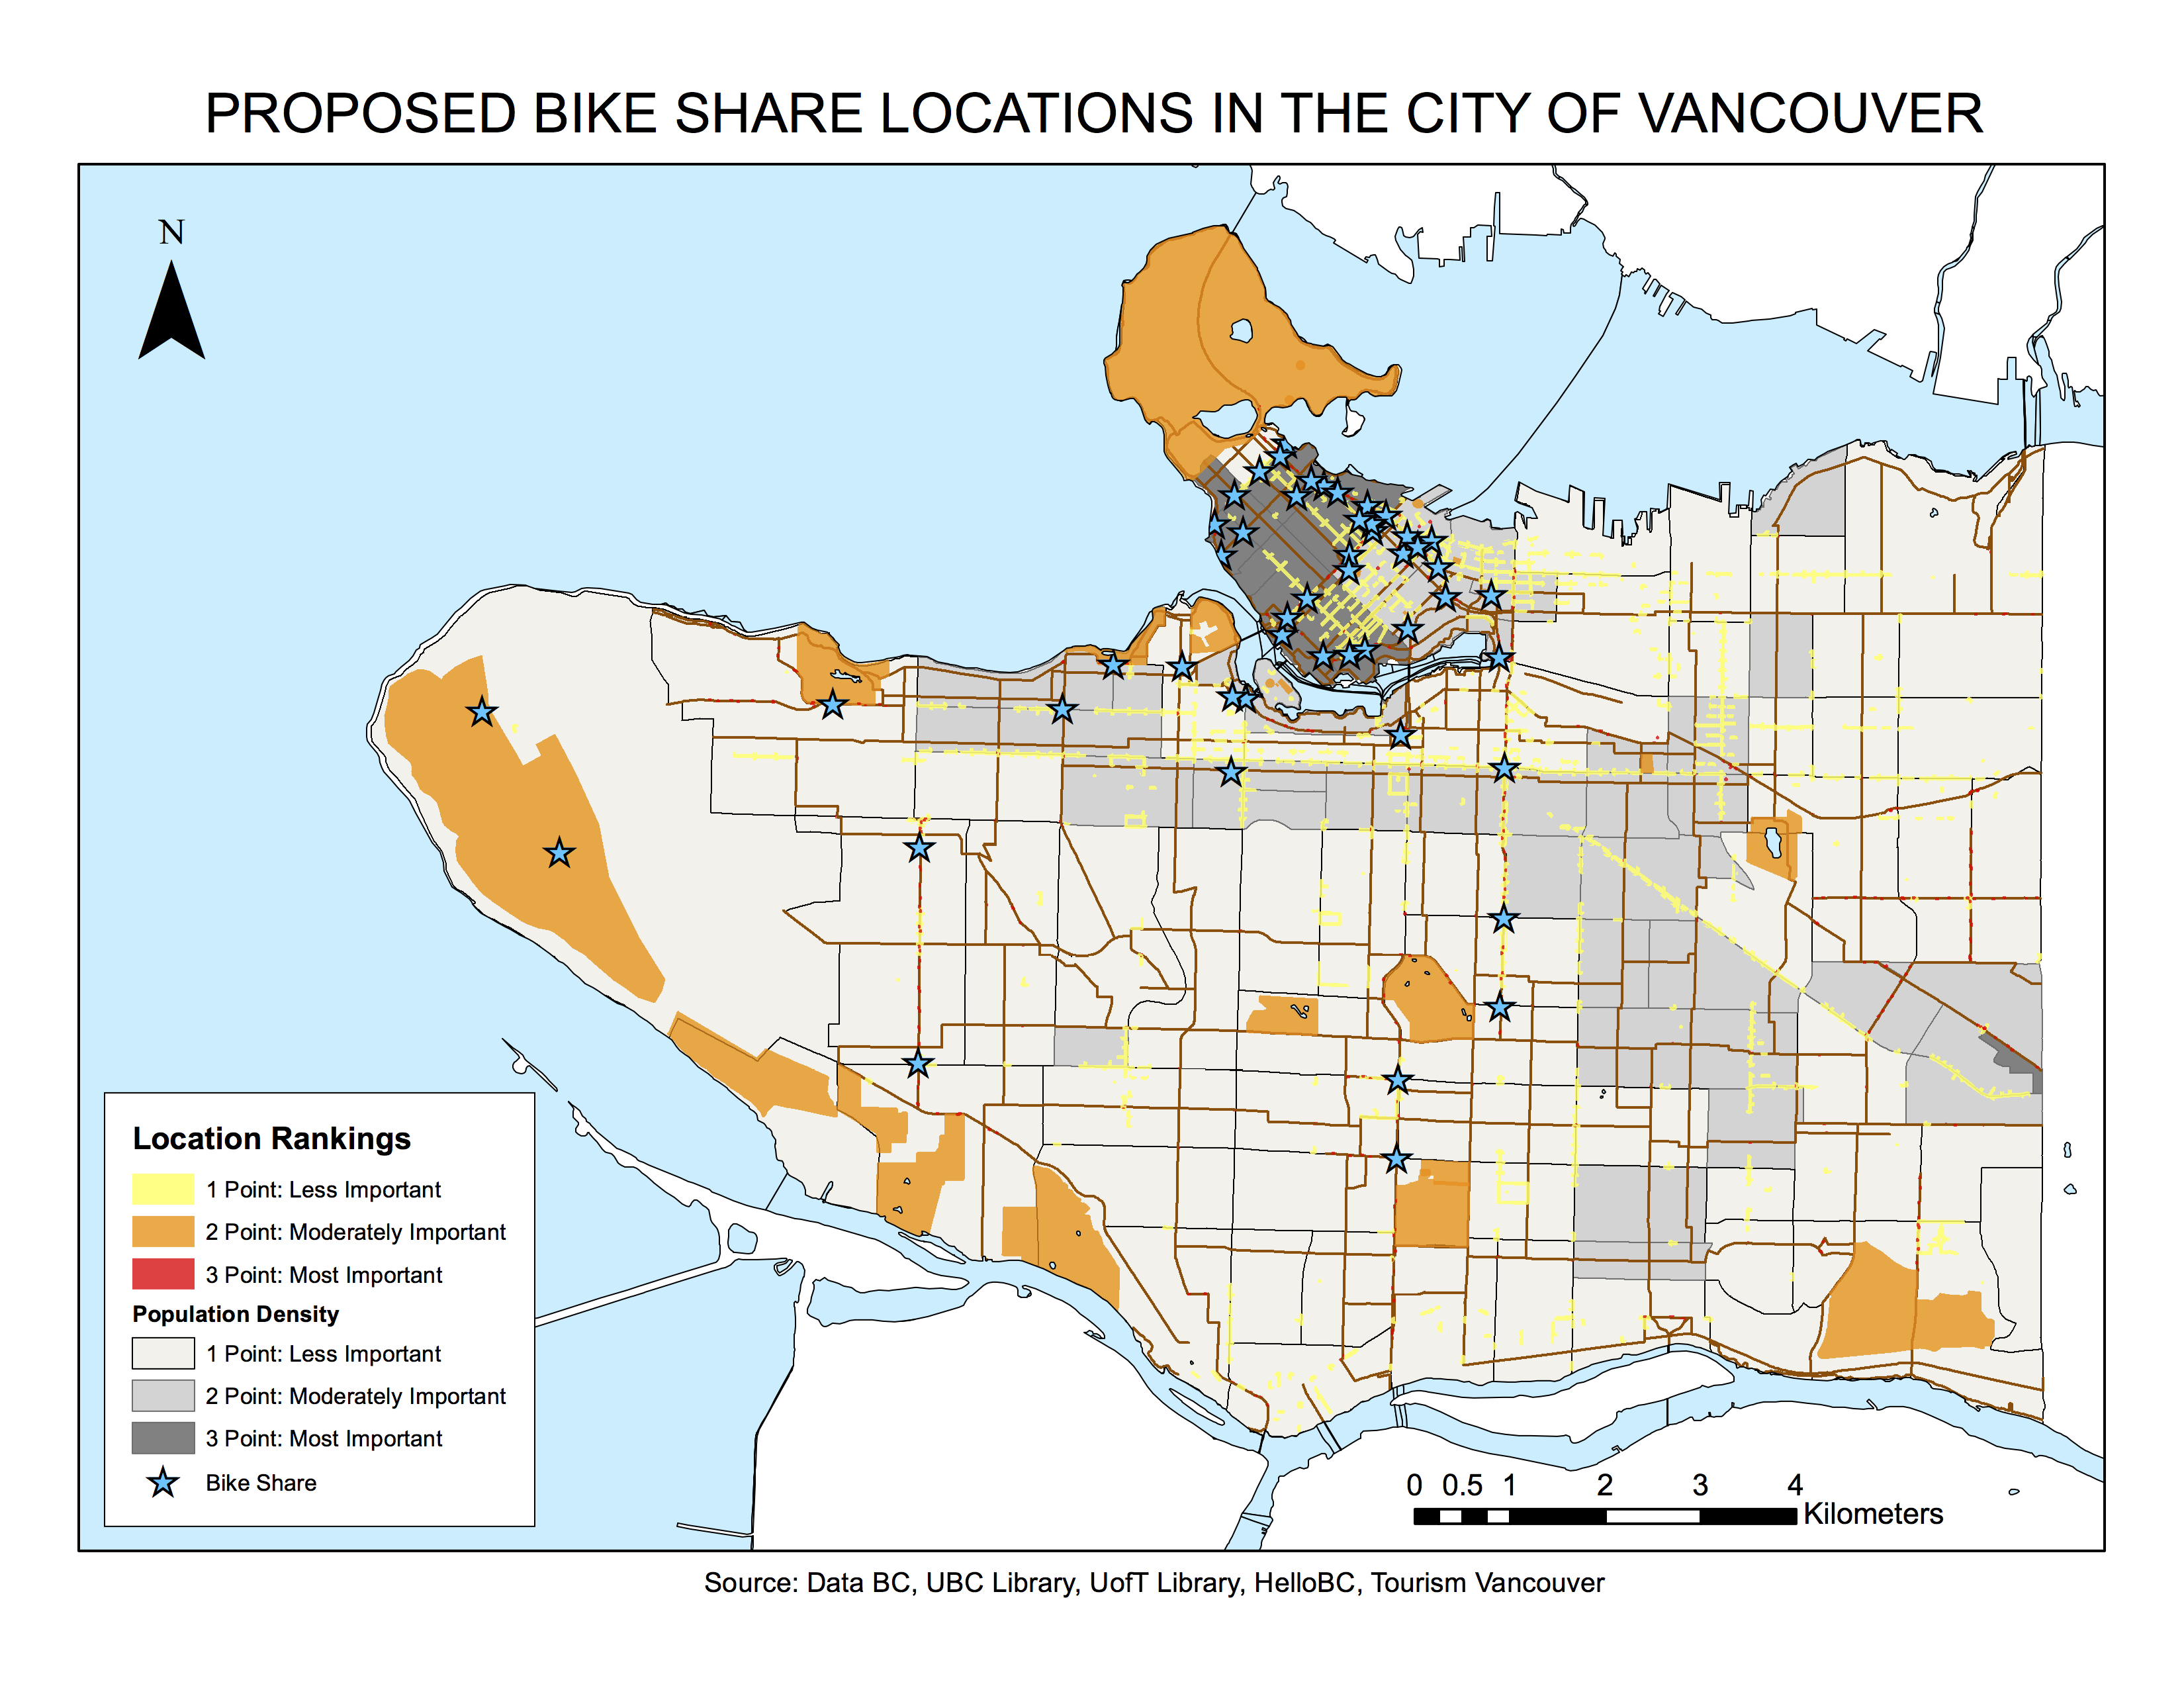
Figure 4.3: Bike Share Location (Independently Mapped in Metro Vancouver):
 Flow Chart:
Figure 5.1: Final Flow Chart of the PBS System Project:
Bibliography
“10 Vancouver Must-See Attractions.” 10 Vancouver Must-See Attractions. Web. 08 Apr. 2016.
<http://www.tourismvancouver.com/activities/attractions/10-must-see-attractions/>.
“Open Data Catalogue.” Data Catalogue: City of Vancouver Open Data Catalogue -Beta
Version. Web. 08 Apr. 2016. <http://data.vancouver.ca/datacatalogue/index.htm>.
“Parks.” Parks. Web. 08 Apr. 2016. <http://www.hellobc.com/vancouver/things-to-do/parks
wildlife/parks.aspx>.
Planning a Livable, Sustainable City. 2012. Web. 08 Apr 2016. http://vancouver.ca/home-
property-development/urban-planning.aspx
“Public Bike Share System.” Public Bike Share System. Web. 08 Apr. 2016.
<http://vancouver.ca/streets-transportation/public-bike-share-system.aspx>.
TransLink (South Coast British Columbia Transportation Authority), and Paul Lesack.
TransLink Transit GIS Data, 14 September 2015. University of British Columbia Library, 2015. Web.
“Tourism Vancouver Official Map Downtown Vancouver.” Https://res
2.cloudinary.com/simpleview/image/upload/v1/clients/vancouverbc/downtown_vancouver_map_f3696608-6be1-4318-9b04-02d0a4170b3a.pdf. Vancouver: City of Vancouver, 2014. 1-2. Print.