Background and Political Origin
In 1980’s, the rapid production and ownership of cars caused traffic congestion in Seoul, capital city of Korea[1] . About 25% of the total Korean population are living in Seoul and its severe traffic congestion became a major problem. Based on my personal experience (I had lived there for 17 years), Seoul is the most notorious city for the traffic congestion in Korea. For the solution of the congestion problem, the Seoul Metropolitan Government (SMG) had suggested several transport policies mainly focused to increase the supply of the transportation system, such as, constructing and expanding roadways in the early 1990’s[2]. However, these were not enough to ease the congestion and SMG had a financial problem to build more transportation facilities[3]. After 1993, SMG changed its focus on the transportation demand management (TDM)[2]. The government of Seoul chose the congestion pricing scheme among options of TDM due to its high effectiveness to control traffic volume[2].Namsan #1 and #3 tunnels have the most serious traffic congestion problems as the tunnels are the main roads linked to central business district (CBD). On November 11, 1996, the SMG began to implement a toll fee of ₩2000 (US $1.7) on private cars having less than two occupants as 90% of the total traffic in Namsan is caused by private cars and 78% of them are single occupied ones[3].
Goals
Two main goals are[4]:
1) to reduce high traffic volume in certain areas (Namsan #1 and #3 tunnels) of Seoul
2) to encourage residents to use the public transportation more frequently
Coverage
Covered vehicles by the congestion pricing[1]:
- Private cars having less than two occupants using two toll gates in Namsan #1 and #3 tunnels
Exempted vehicles[1]:
- cars with more than three passengers
- emergency vehicles
- vans and trucks
- handicapped person’s vehicles
- reporters’ vehicles
- vehicles for welcoming foreign guests
- diplomat’s vehicle
- taxies and buses.
Implementation
Until October 1996, all vehicles passing through Namsan #1 and #3 tunnels were charged ₩100 to recover the construction costs of roadways in Seoul for 20 years[2]. Since November 11, 1996, private cars with one or two occupants, passing tunnels in both direction, have been charged a congestion toll of ₩2000[3]. The toll fees can be paid by cash and credit cards at toll booths located at the two tunnels. The toll is collected from 7am to 9pm during weekdays and 7am to 3pm on Saturdays[2]. There is no charge on Sundays and national holidays[2]. ₩10,000 must be paid for violation penalties[2]. Collected toll fees are mainly used for investment in public transport system4]
Performance & the effectiveness of the policy
There are two research papers done to analyze the effectiveness of the congestion pricing scheme in Seoul: (1) “Developments in Road Pricing and Traffic Restraint, Seoul Case” by Eui-Young SHON (2000) and (2) “FOUR-YEAR-OLD NAMSAN TUNNEL CONGESTION PRICING SCHEME IN SEOUL – Success or Failure?” by B. SON and K.Y. HWANG (2012). According to the papers, the effectiveness of the scheme can be proved by the following four parts:
- A reduction in the traffic volume on Namsan tunnels
- Shortened travel time
- A change in traffic volume in alternative roads
- An increase in different vehicle usage
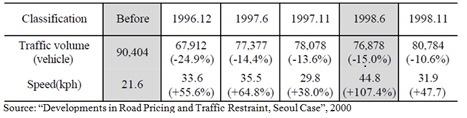
1. The following table shows the congestion pricing efficiency of solving the traffic congestion. During the first month, the traffic volume was reduced by 24.9%. After two years, the rate was decreased to 10.6%. However, the travel speed significantly increased from 21.6 to 31.9kph[2].
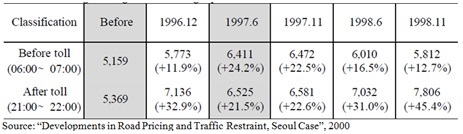
2. As the congestion toll is charged during the certain time, from 7am to 9pm, the traffic volume between 6 am and 7am and between 9pm and 11pm increased by 12% and 20%. This way, travel time was able to be shortened during the congestion toll charged period[2].
3. The table below shows the change in traffic volume on four alternative roads with no charge. The data is only based on the private cars. Whereas the alternative roads’ traffic volume increased by 11%, the average travel speed was improved after two years of implementation. The speed is increased because the traffic signal delays at intersections between the Namsan tunnels and alternative roads were reduced by improved traffic on the tunnels[2].

4. Drivers were more likely to shift from private cars with less than two occupants to vehicles exempted from the congestion toll. The number of buses, taxis, and private cars with more than 3 occupants were significantly increased; increased car-pool by 144.9%, bus by 62.2%, taxi by 211.6% and truck and other toll-free vehicles by 57% from 1996 to 1998[2].

The dramatic decrease in traffic volume, travel time and the increase in speed on Namsan tunnels were resulted by the congestion pricing scheme, applied on the tunnels which are notorious for the traffic congestion in Seoul. Number of vehicles on alternative roads increased, but the travel speed was not worse off. Furthermore, more people were encouraged to use public transportation. These are all impacts of the pricing scheme pointed out by two papers of analysis I found. The impacts can prove that the pricing scheme effectively achieved its two main goals.
Distributional effects of the policy
There is no study to prove distributional effects of the policy, however, I think it is clear that poor and rich people are impacted unequally. Although both groups have to pay the same toll fee, 2000 won (US. $1.70), the impact of the policy on the poor and rich are different. In my personal opinion, there are three different cases to prove its unequal impact.
1) People with higher income are impacted less: Withdrawing $1.70 from $10,000 isn’t as big of an impact as withdrawing $1.70 from $100.
2) Poor people are less likely to own a car and more likely to use public transportation. The majority of them would not have to be concerned of paying a toll as well as the rich who are financially capable of paying the fee.
3) Two of the toll gates are located in Namsan and the further away your live from it, the higher the probability of paying a toll. As the area further has lower housing price than Namsan, I can say that the people living there are relatively poorer than the people living in Namsan which is central business district. So, poor people are impacted more.
Therefore, I can conclude that all three cases are relative to the divisions of the rich and poor. The impact of the tax on the people of higher income (a.k.a. the rich) is less than on the poor.
Revenue and its impact on the burden for the rich or poor
According to the website of the Korean government, the revenue from the toll is used for the investment in the development of public transport system[4]. There was no numerical data of how much revenue has been gathered since 1996 and how much of it has been allocated for the investment purpose[4]. As the poor are more likely to use the public transport, they can get higher benefit and the impact of revenue use on the burden for the poor would be bigger.
Personal Opinion
Based on the information and data I found, I have no doubt about the effectiveness of the congestion pricing. It has successfully achieved two main goals: a reduction in traffic volume in Namsan and encouraged use of the public transport. No study has been done to test its cost-effectiveness, and social and private welfare benefits. However, as SMG chose the scheme among TMD options, I can tell that it has the most cost effectiveness. I think that this pricing is also quite fair. The poor was more impacted but they can get more benefits obtained from the congestion pricing. They are more likely to use the public transport and the revenue of the scheme is used for the investment in the improving public transportation system. I believe that congestion pricing on other parts of Seoul can be successfully done if it is the same as the scheme applied in Namsan.
References:
[1] http://enviroscope.iges.or.jp/contents/APEIS/RISPO/inventory/db/pdf/0056.pdf
[2] http://www.iatss.or.jp/pdf/research/26/26-1-03.pdf
[3] http://siteresources.worldbank.org/INTURBANTRANSPORT/Resources/shon1.pdf
[4] http://contents.archives.go.kr/next/content/listSubjectDescription.do?id=006501