If you write code, you should be using a version control system. At it’s most basic, version control tracks changes in files over time and allows you to easily view differences and restore the last working version if you break something (which you will). Most version control systems work at the file level so they don’t care if you’re writing R, Python, GAMS, C++ or CSS or just text like this blog post.
Using version control starts with tracking changes on your computer, but using a server allows you to collaborate with others on the same code. Changes are captured at the line level so they can be merged automatically with changes from other people in your team. There are also tools to resolve occasional conflicts that arise when multiple people modify the same line.
Using version control also helps emphasize repeatability in analysis projects. Your work should start with source data, follow a repeatable (possibly automated) set of analysis steps and produce figures, reports, trained models or other outputs. For the COE, your source data is kept in the shared drive and on your local machine and the code is kept on your machine and in version control. The output of the code is treated as temporary. Anyone who has a copy of the data should be able to run your code on their computer and reproduce all the figures, models and reports as needed.
Git and GitHub
There are many version control systems including Subversion, Mercurial and Git. Each has many users and benefits but the most common in our industry is Git, largely because of the excellent web service GitHub. While Git is the software that runs on your computer, GitHub is a site which will host your code and allow you to share it with your team or outside collaborators. They also provide a desktop application which is much friendlier than the Git command line interface.
Setting Up Your Account
- Sign up for a GitHub account with your COE email address and a strong password. It is required that your account to use two-factor authentication so make sure you set that up at this point. Editorial Note: I highly encourage you to use 2FA everywhere it’s supported. If you aren’t aren’t familiar, check out this article. While we’re talking about passwords, consider a password manager and please, please, please for your sake don’t use the same password in multiple places.
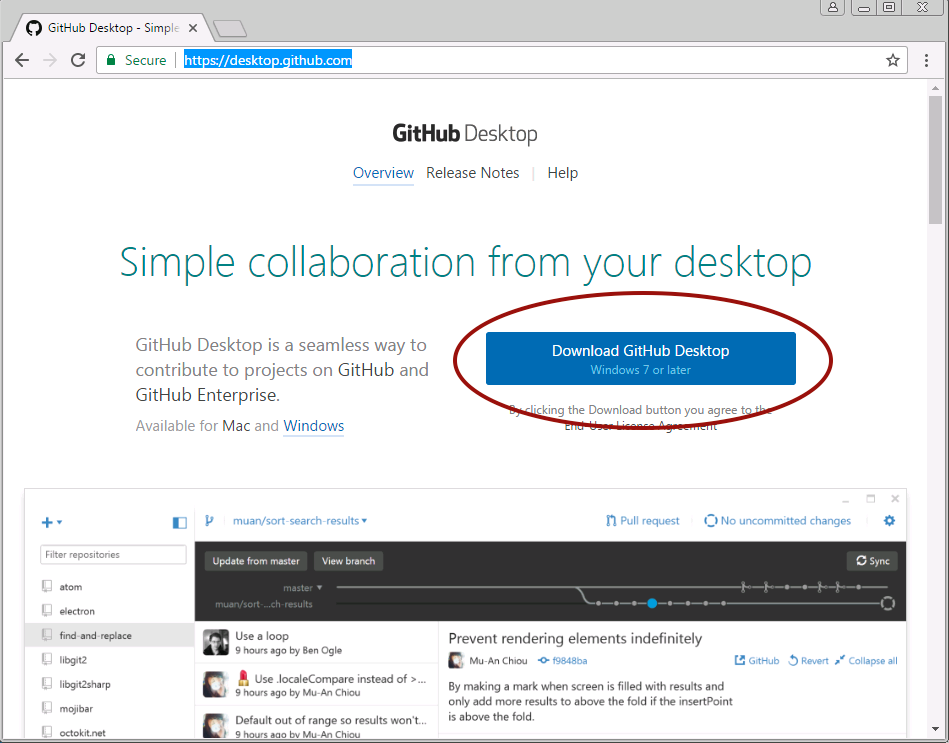
- Next, look for the application called GitHub on your computer. If its not already installed, download and run the GitHub Desktop Installer. It installs in your user directory so you shouldn’t need admin privileges.
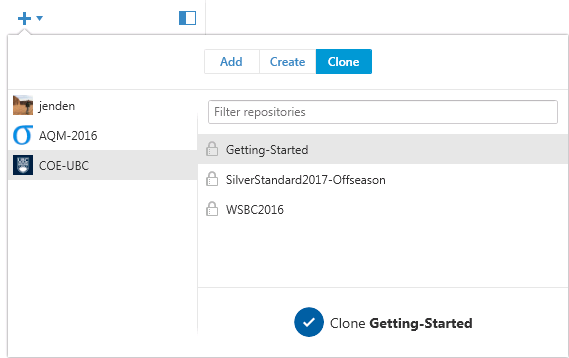
- Open the GitHub app and sign in with your credentials and two-factor code. Once you’re signed in you’ll see a blue plus icon in the top left corner that you can use to add a repository. You can either add an existing repository on your computer, create a new repository on your computer, or clone an existing repository from GitHub. An empty repository for your project should already exist on GitHub so click “Clone”, select COE-UBC from the left panel and your project from the right. Once you click the check to clone your repository, you’ll be prompted to choose a location to store the repository. Any location on your local machine is fine. It’s not backed up, but that’s okay becuase the canonical version of your code will live on GitHub and everything in your local repository can be recreated.
- Back at the main GitHub Desktop screen you should now see your repo highlighted in the panel on the left. As you add more repos, this list will grow so you can keep track of several projects at the same time. In the main panel you will see a timeline, a list of the commit history for the project and details for the selected commit.
Git Basics
In this section we’ll cover the basic commands in Git that you’ll use to keep track of changes to your files. You’re going to create a practice repository and fill it with files that we’ll sync with GitHub.
Creating a new repository
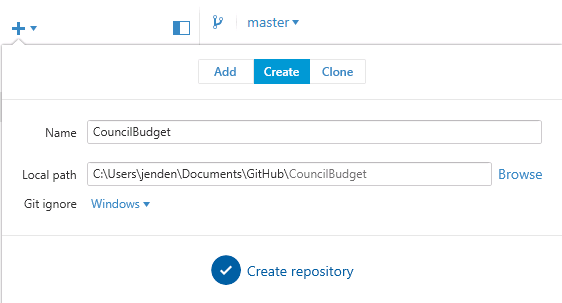
To get started let’s create a new repository called “CouncilBudget” in the default location. Click on the plus in the top left, then create and type in the name. The location should be the default Documents\GitHub. GitHub desktop also gives you the opportunity to create a gitignore file that is pre-populated to exclude helper files for specific languages and operating systems. We’re going to use the default Windows option for now.
Click create repository to intialize the repository on your system. Notice that all we did was create a folder in called CouncilBudget with a couple files in it. GitHub automatically creates the first commit for us which contains two text files with instructions for how Git should behave. The .gitignore file is a list of rules for files that Git should ignore (open it up and have a look) and .gitattributes is a configuration file that we don’t need to pay attention to at this point. If hidden folders are visible on your system, you’ll notice that a new folder called .git was also created. This is where Git keeps track of everything for you and you don’t need to bother with it at all.
Congratulations! You’ve made your first repository. Now let’s make something. Open up R and set the working directory to the folder we just created. You can do this with the GUI or by running setwd("~/GitHub/CouncilBudget") in the console. Check you’re in the right place with the command getwd() which prints out your path.
Adding files to your repository
Now create a new file with the following content and save it as analysis.R in your repository.
# Analysis for 2016 City Councel Budget Data
library(dplyr)
library(ggplot2)
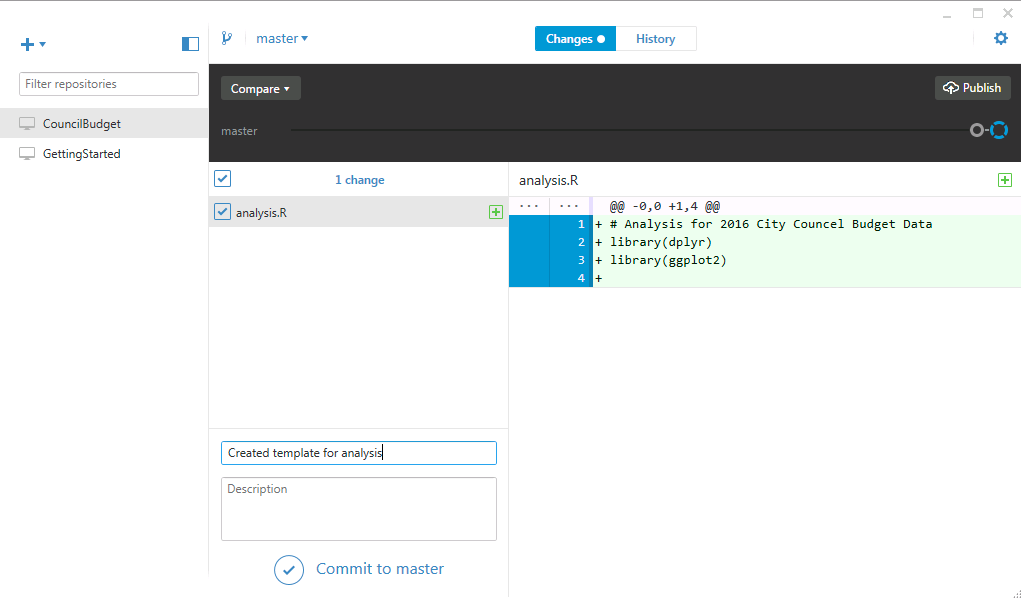
Go back to GitHub desktop and notice that the selector at the top of screen that says Changes has an indicator next to it. When you switch to that view you’ll see the file we just created is listed. When the file is selected, it’s contents are shown on the right. Additions (lines that don’t exist in the repository) are highlighted in green and deletions (lines to be removed form the repository) are listed in red.
Select the file and write a commit message that’s descriptive of the changes or additions you’re making. You can write a detailed description in the box below but only the commit message is required. Click commit to master to add the file and its contents to version control. Git will now know to keep an eye out for any changes you make later. Go back to the History panel and you’ll see that there is another commit message with the details about the file you just added.
Using gitignore to exclude files and directories
Now let’s do something more interesting. Using the City of Vancouver’s Open Data Calogue download the city council annual budget and expenses data for 2016 as a CSV (or use this link to get the zip file directly). Create a new folder in your repository called data and move the 2016CityCouncilBudgetandExpensesDetailedandSummary_Councillors.csv from the zip archive into it. This file contains our source data but we don’t want to put source data on GitHub. It’s COE policy and it can be difficult to manage large files through GitHub s we’re going to use .gitignore to help us.
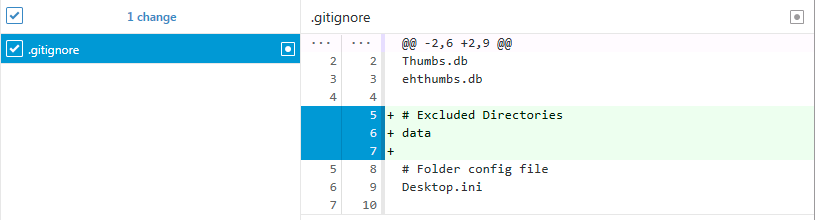
Open .gitignore in a text editor such as Notepad++ or Visual Studio Code. Add the following comment and rule near the top of the file.
# Excluded Directories
data/
Now save the file and go back to GitHub Desktop. You’ll notice that the data file is no longer staged and now there is a change to .gitignore. Notice that only some of the lines in the file have been changed and these have been highlighted in green. Commit this change with an appropriate commit message. From now on, everything added to the data directory will be excluded from Git by default.
Commiting changes to a file
Let’s make a simple plot of the councillor data using a little dplyr and ggplot wizardry. Add the following code to analysis.R to create a simple bar plot of the total expenses for each councillor.
raw.df <- read.csv('data/2016CityCouncilBudgetandExpensesDetailedandSummary_Councillors.csv', skip=3, nrows=10)
str(df)
df <- raw.df %>%
transmute(Councillor = Councillor, Expenses = Total.Councillors.Expenses) %>%
mutate(Expenses = as.numeric(gsub("[$|,]", "", Expenses))) %>%
transform(Councillor = reorder(Councillor, Expenses))
plot <- ggplot(df) +
geom_bar(aes(x=Councillor, y=Expenses), stat="identity") +
xlab("") + ylab("Total Expenses (Dollars)") + coord_flip()
print(plot)
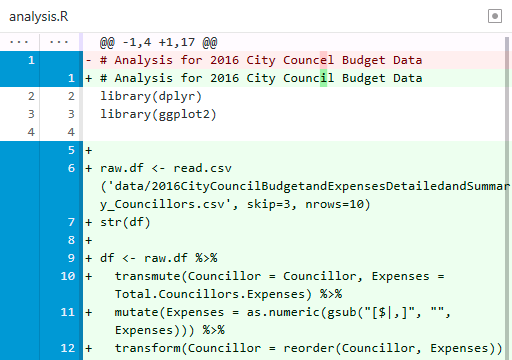
I noticed I made a typo in the comment in the first line so I can also correct councel to council. We can use the same procedure as before to add this code to our repository. Return to the Changes pane in GitHub Desktop and click on analysis.R (if you don’t see the file then you may not have saved your changes). Notice how the additions are highlighted in green and the line we corrected is highlighted in red. Git works line by line so changes to existing lines of code are stored one deleted line and one added line. Commit the changes with an appropriate commit message.
Reverting a change
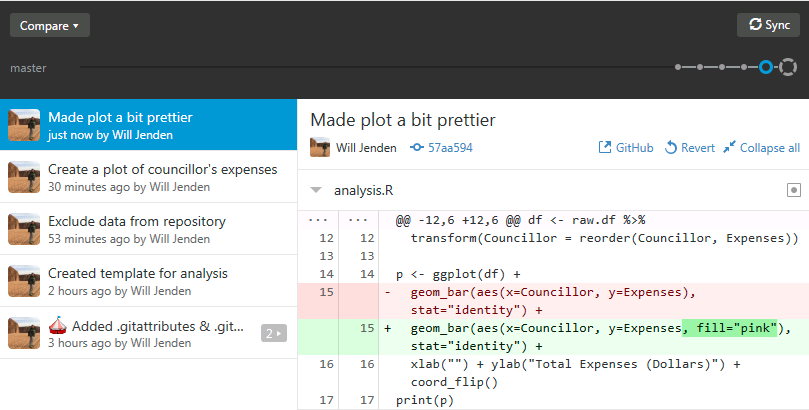
One reason you might want to use version control is so you can revert mistakes you’ve introduced in your code. There are ways to force Git to abandon commits entirely but in most cases the preferred method is to revert a commit by making the opposite changes to your code. Let’s see this in action by changing line 15 of analysis.R so that the bars are filled with a color. This can be done by adding fill="pink" to the aes in geom_bar. Save the file and commit the changes. Your history should now look something like this:
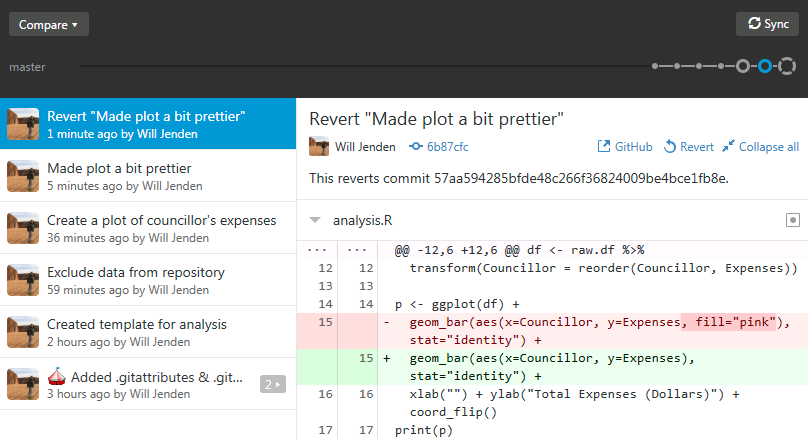
If your project advisor comes by and gives you a hard time for making the plot less “professional” then you have a couple options. You can edit the file, remove the part that sets the color, save and commit the file, or you can simply revert the commit by clicking… Revert. A new commit is made with the opposite changes as your previous commit. This keeps your history intact and makes it easy for Git and the GitHub server to track the changes. Here’s what your commit history should look like now.
Pushing Changes to GitHub
Version control can be useful for one-person projects on your own local machine but it really shines when you start backing up the project on a remote repository and sharing it with others. GitHub offers this service and is widely used by individuals, companies and the open source community.
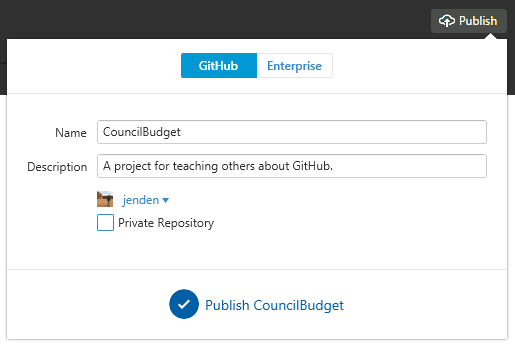
Publishing to a new repository is easy; just click Publish in the top right hand corner. The name of the remote repository is populated with the name of your local repository and you can add an optional description. By default, everything you share to GitHub is public but you can purchase private repositories (or get them for free if you’re a student). Give your project a description and create the repository.
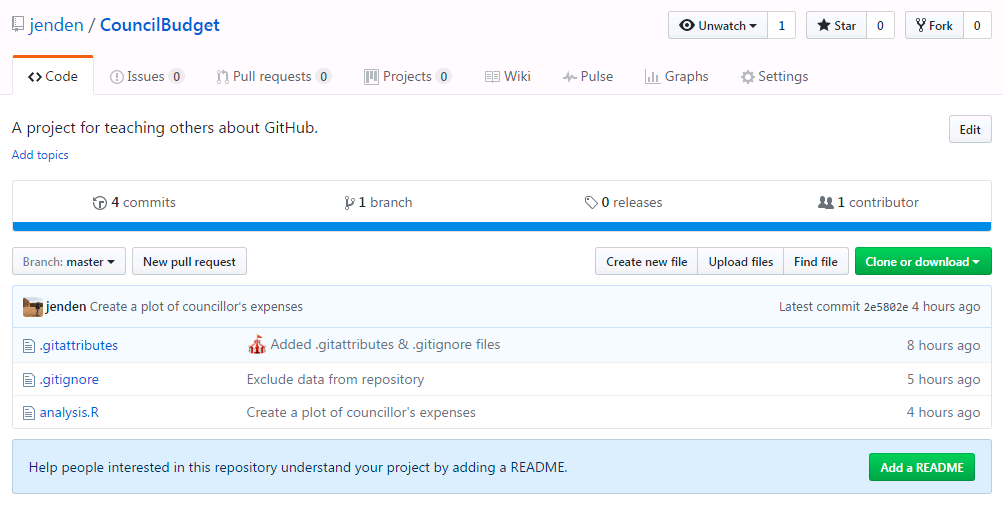
Once you’ve published your repository the Publish icon should change to Sync. Syncing changes from your machine to the GitHub server is referred to as a push and retrieving changes that exist on the server already is called a pull. Once you introduce a remote repository on GitHub, the canonical version of your project lives on the GitHub server. Other people can become contributors to your project or they can fork your repository and start working on their own copy. If you view the repository on GitHub you will be able to see what files are tracked by version control and were pushed to GitHub. Note that the data folder was not synced because it is listed in .gitignore.
Cloning an existing repository
You can clone an existing repository that you own by clicking the plus at the top left, selecting clone and then selecting the repository. Follow the prompt to select an appropriate place on your computer and all the files will be pulled from GitHub to your computer. This could be useful if you want to get a copy on another computer or server or restore a copy because you lost or corrupted your local copy.
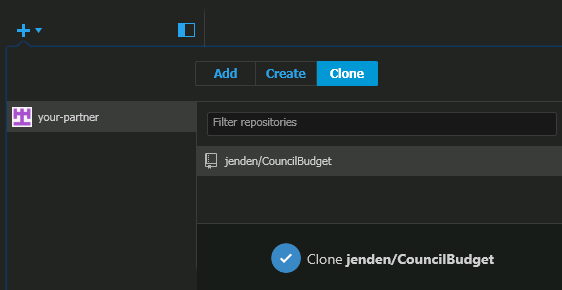
Sharing code with others is one of the main reasons to use GitHub and in order to share you need to clone someone else’s repository. This is possible even if the repository is private as long as you’ve been added as a collaborator. In this case, the repository will be named something like owner/repository-name but the process is the same. The image above is what it would look like from your-partner‘s point of view. When you clone the repository, everything on GitHub will be synced to your local machine.
Pulling changes from GitHub
When multiple people contribute to the same project there will be changes in the GitHub repository which you do not have locally. In order to retrieve those changes you will need to perform a pull. In GitHub desktop this is done by clicking Sync. This will first perform a pull and then perform a push. One of the reasons that remote repositories work is that you must pull what is on the repository and resolve any conflicts locally before you can push your changes to the server. This makes sure that Git won’t break anything underneath your feet: as long as you always push working code, the code on the remote repository will always work.
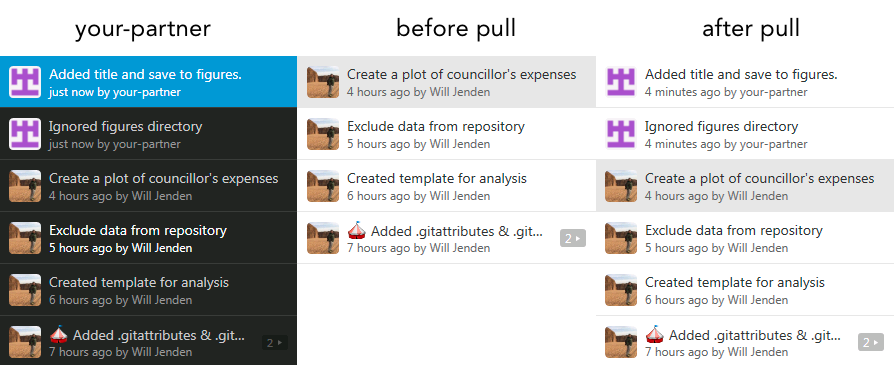
To demonstrate, I’ve made two additions from the copy on your-partner‘s working copy, commited and pushed the changes to the remote repository on GitHub. The commit history for your-partner will have the new commits and the server will have the new commits but your repository will remain the same until you choose to pull the commits from ther server.
When you pull, the changes from the server will be merged with your code. If you’ve both made changes to the same file the changes will usually merge gracefully but if you’ve both made changes to the same line, then you’ll have to handle a merge conflict.
A word of caution: Git won’t make changes until you tell it to. This means that it won’t incorporate changes from a collaborator while you’re in the middle of working but it also means that if you neglect to keep your code up-to-date with the server, you could have to manage a lot of merge conflicts when you sync next.
Resolving merge conflicts
Regardless of how dilligent you are about syncing regularly, merge conflicts will occur and, while they can be intimidating, they aren’t not as bad as they seem. Let’s look at a simple case where two people make changes to the same line of the same file.
On their machine, your-partner sets the dpi of the saved image and, on your machine, you set the dimensions of the saved image. Both of you commit the changes but have not yet pushed them to GitHub. You would each see commits in GitHub desktop that look like this:
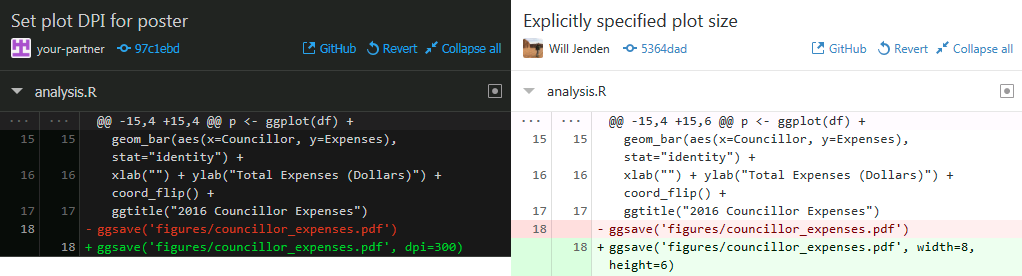
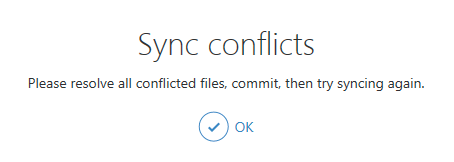
These changes affect the same line of code so there will be a conflict but only one of you will need to resolve the issue. The first person to push their changes doesn’t see anything unusual but the second person will get a sync conflict error that requires them to pull the change from the server, resolve the conflict and push the resolved code to the server. For example, if your-partner pushes their commit to the server first, then when you click Sync in GitHub desktop, you’ll get a message about the conflicts.
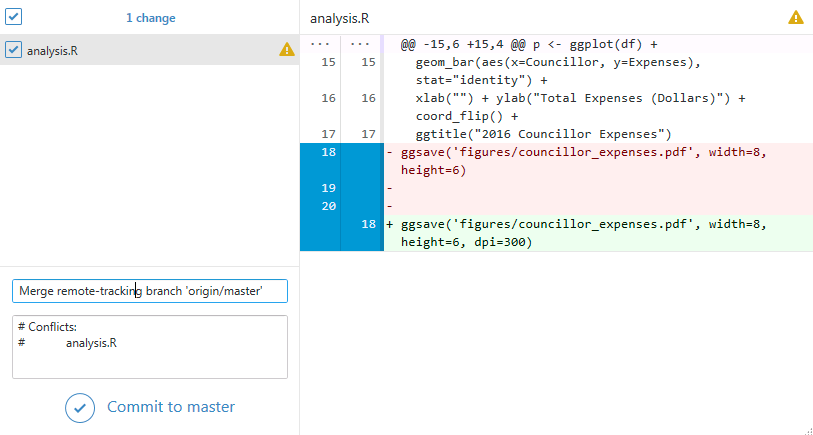
Git will add the changes from your local machine (referred to as HEAD) and the remote repository (referred to as origin/master) to the file with the conflict which in this case is analysis.R. You’ll need to resolve the conflict manually and then commit the changes before pushing the results back to GitHub.
p <- ggplot(df) +
geom_bar(aes(x=Councillor, y=Expenses), stat="identity") +
xlab("") + ylab("Total Expenses (Dollars)") + coord_flip() +
ggtitle("2016 Councillor Expenses")
<<<<<<< HEAD
ggsave('figures/councillor_expenses.pdf', width=8, height=6)
=======
ggsave('figures/councillor_expenses.pdf', dpi=300)
>>>>>>> origin/master
Open the file in a text editor, choose what code to keep and remove the markup left by Git to identify the changes. You can combine the changes, keep your local changes only, keep the changes from the server only or write some new code entirely. In this case, it makes sense to keep both changes so we can edit the file and save the results.
p <- ggplot(df) +
  geom_bar(aes(x=Councillor, y=Expenses), stat="identity") +
  xlab("") + ylab("Total Expenses (Dollars)") + coord_flip() +
  ggtitle("2016 Councillor Expenses")
ggsave('figures/councillor_expenses.pdf', width=8, height=6, dpi=300)
Return to GitHub desktop, commit the changes with the pre-populated commit message and sync the changes to the server as usual. Your collaborators will receive the merged changes next time they pull and you can get back to work.
The best way to avoid merge conflicts is to sync changes with GitHub regularly. The more often you sync, the less likely you and your collaborators will change the same line at the same time. If you run into a conflict, stay calm, resolve the issue by editing the code in a text editor and push the changes back to the server.
Other Resources
Git and GitHub are powerful and complex tools and this is only one blog post. So far we’ve only talked about using about a simple use case but you can explore branches, tags, forking, pull-requests and other concepts. There are the guides from GitHub and Git and many others, interactive courses from Codecademy and GitHub, and plenty of blog posts and video series from other sources. One of my favorites is a video series from the makers of Git Tower which is polished GUI that I like to use. If you want to understand git commands and the graph structure better, check out this talk and this visualization tool. And, if you’re stuck, Google and StackExchange are your best friends.
 Summer is over. Project season has finished and students are back in coursework. Weekly meetings, phonecalls and reports are in the past now, and attention is focused on readings and assignments. Days are getting chillier and leaves starting to fall. Meanwhile a new class of students is beginning the MMOR program. They are eager to learn and to discover the challenges they’ll face in the program. A new cycle begins. In order to recycle some knowledge, we proposed them to have a chat with an ‘old’ students about the main challenges they faced in the program. Here are some of the stories that came back with.
  Typical COE projects involve developing some kind of OR model to better understand a given problem. In this task, consolidating and exploring data is a crucial step to understand the problem and build math models,
 In
In 