Using the data from the Early Development Instrument (EDI) questionnaire provided for this lab, which measures core areas of early child development that are known to be good predictors of adult health, education and social outcomes, we examined the relationship between a child’s social skills and variables related to the child (e.g., language abilities; physical abilities; gender; and English as a second language (ESL)) and to their neighbourhood (e.g., percentage of lone parent; percentage of immigrant families; percentage of recent immigrant families) using GWR, for Vancouver. Explanatory Regression Analysis tool was used to identify the best set of variables to use in the GWR analysis (and OLS analysis) while the OLS tool was used to determine the statistics associated wit the best set of variables in ArcGIS.
Following a two-step process using the Explanatory Regression Analysis tool, I identified the best set of variables, with the highest AdjR2 (adjusted R-squared) and lowest AICc (second-order Akaike Information Criterionto), to use in the GWR analysis to be: Social Skills Score regressed on Gender, Language Scores, and average income of neighbourhood divided by 1000 (Income1000). When the OLS regression was ran using the best set of variables identified through the Explanatory Regression Analysis tool, Gender and Language Scores were found to be statistically significant while Income1000 was not statistically significant at the 0.05 level. Furthermore, the OLS regression result indicated that if female, the social skills of a child would decrease by a unit (score value) of 5.49 while a unit increase in language abilities of a child would increase social skills by a unit of 0.52. While not statistically significant, a unit increase in Income1000 (the average income in the neighbourhood divided by 1000) would increase social skills by a unit of 0.05, making no significant difference in the scoring of a child’s social skills which range from 0 to 100. Moreover, the R-squared and adjusted R-squared for the OLS indicated that the proportion of variation in the dependent variable explained by the model to be 0.37, which is an acceptable value given that we are working with socio-economic variables.
When compared with the GWR model, both the R-squared and adjusted R-squared, 0.45 and 0.41, respectively, indicated that the proportion of variability in the dependent variable was better explained by the GWR model than the OLS regression model. Additionally, the AICc value, another measure of goodness of fit that penalizes overfitting of statistical models, was lower for the GWR model than the OLS regression model, further suggesting that the data was better explained by the GWR model. More importantly, mapping local parameter estimates produced by GWR revealed spatial heterogeneity through the output coefficient raster surfaces which were previously non-varying coefficient values with the OLS regression.
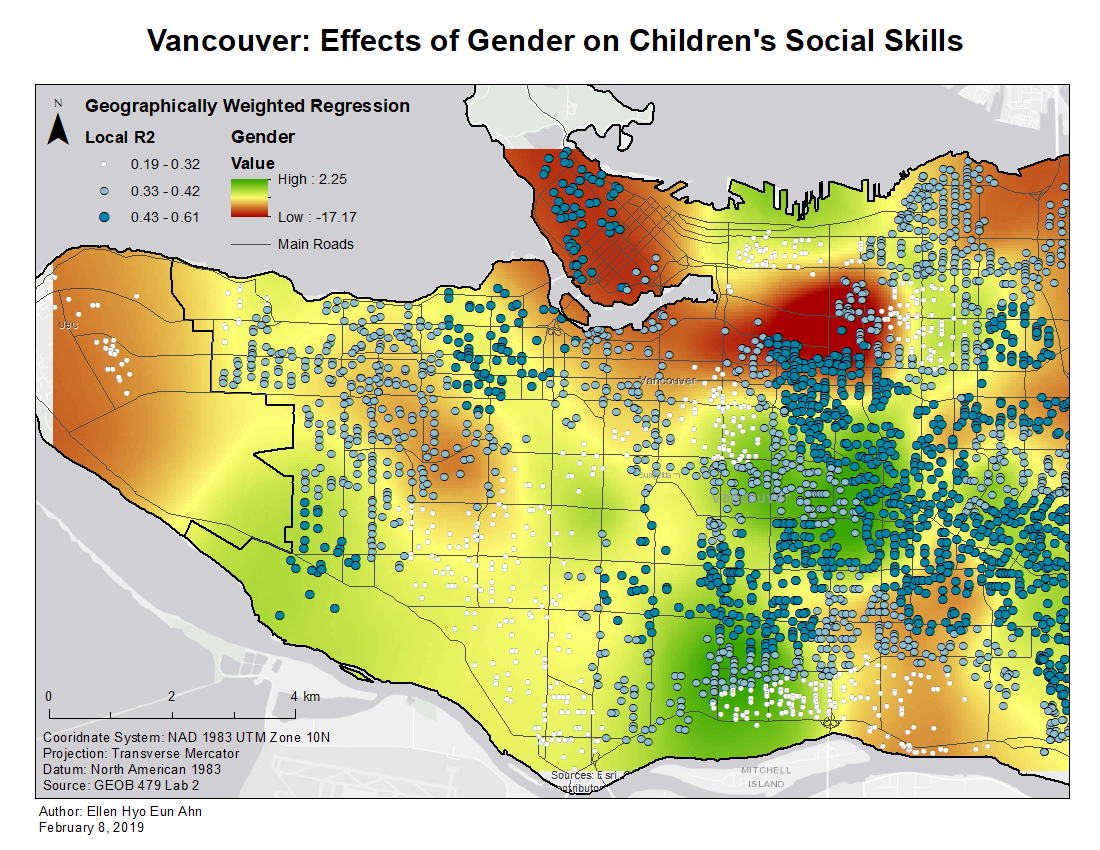
By grouping the enumeration areas into ‘neighbourhoods’ in Vancouver, using the Grouping Analysis tool, four groups were derived using the following variables: Childcare (percentage of families that spend 30 or more hours on childcare), Fam4 (percentage of the neighbourhood families that have 4 or more members), LoneParent (percentage of the neighbourhood families that are lone/single parent), RecImmig (percentage of the neighbourhood immigrants that are recent immigrants to Canada), and Income (average income in the neighbourhood). While categorizing the groups, the middle income, small-sized households and the middle income, average-sized households groups stood out as the standardized values for each variable were relatively close across these two groups, except RecImmig. Through this, I noticed that the low values of the gender coefficient from GWR were occurring where these two groups were spatially located (Map 1). Both groups had slightly above average income, low percentage of small-to-average households, and low percentage of families with lone parent in the neighbourhood. However, if the child was female in the neighbourhood, the child’s social skills were estimated to decrease by as much as 17.16 units, which is quite alarmingly. Thus, it would be worthwhile investigating these neighbourhoods further as these two groups are geographically clustered near each other in the West End, Mount Pleasant, Fairview, and Point Grey (University Endowment Lands) neighbourhoods. As well, we cannot infer causal effects from our analysis due to endogeneity and multicollinearity problems. Furthermore, while the OLS regression result indicated no statistical significance for the Income1000 variable, examining the spatial heterogeneity from GWR showed extremes of high and low estimates of Income1000 coefficients near the eastern side of Vancouver. Although a large proportion of Vancouver is shown in yellow (near a value of 0), we are able to identify local areas that move away from the global value through GWR. Therefore, highlighting the existence of variability in space that was lost using the OLS model, a traditional global model, which could contain critical information in addressing issues relating to early child development since the instrument is used as a predictor for adult health, education and social outcomes.