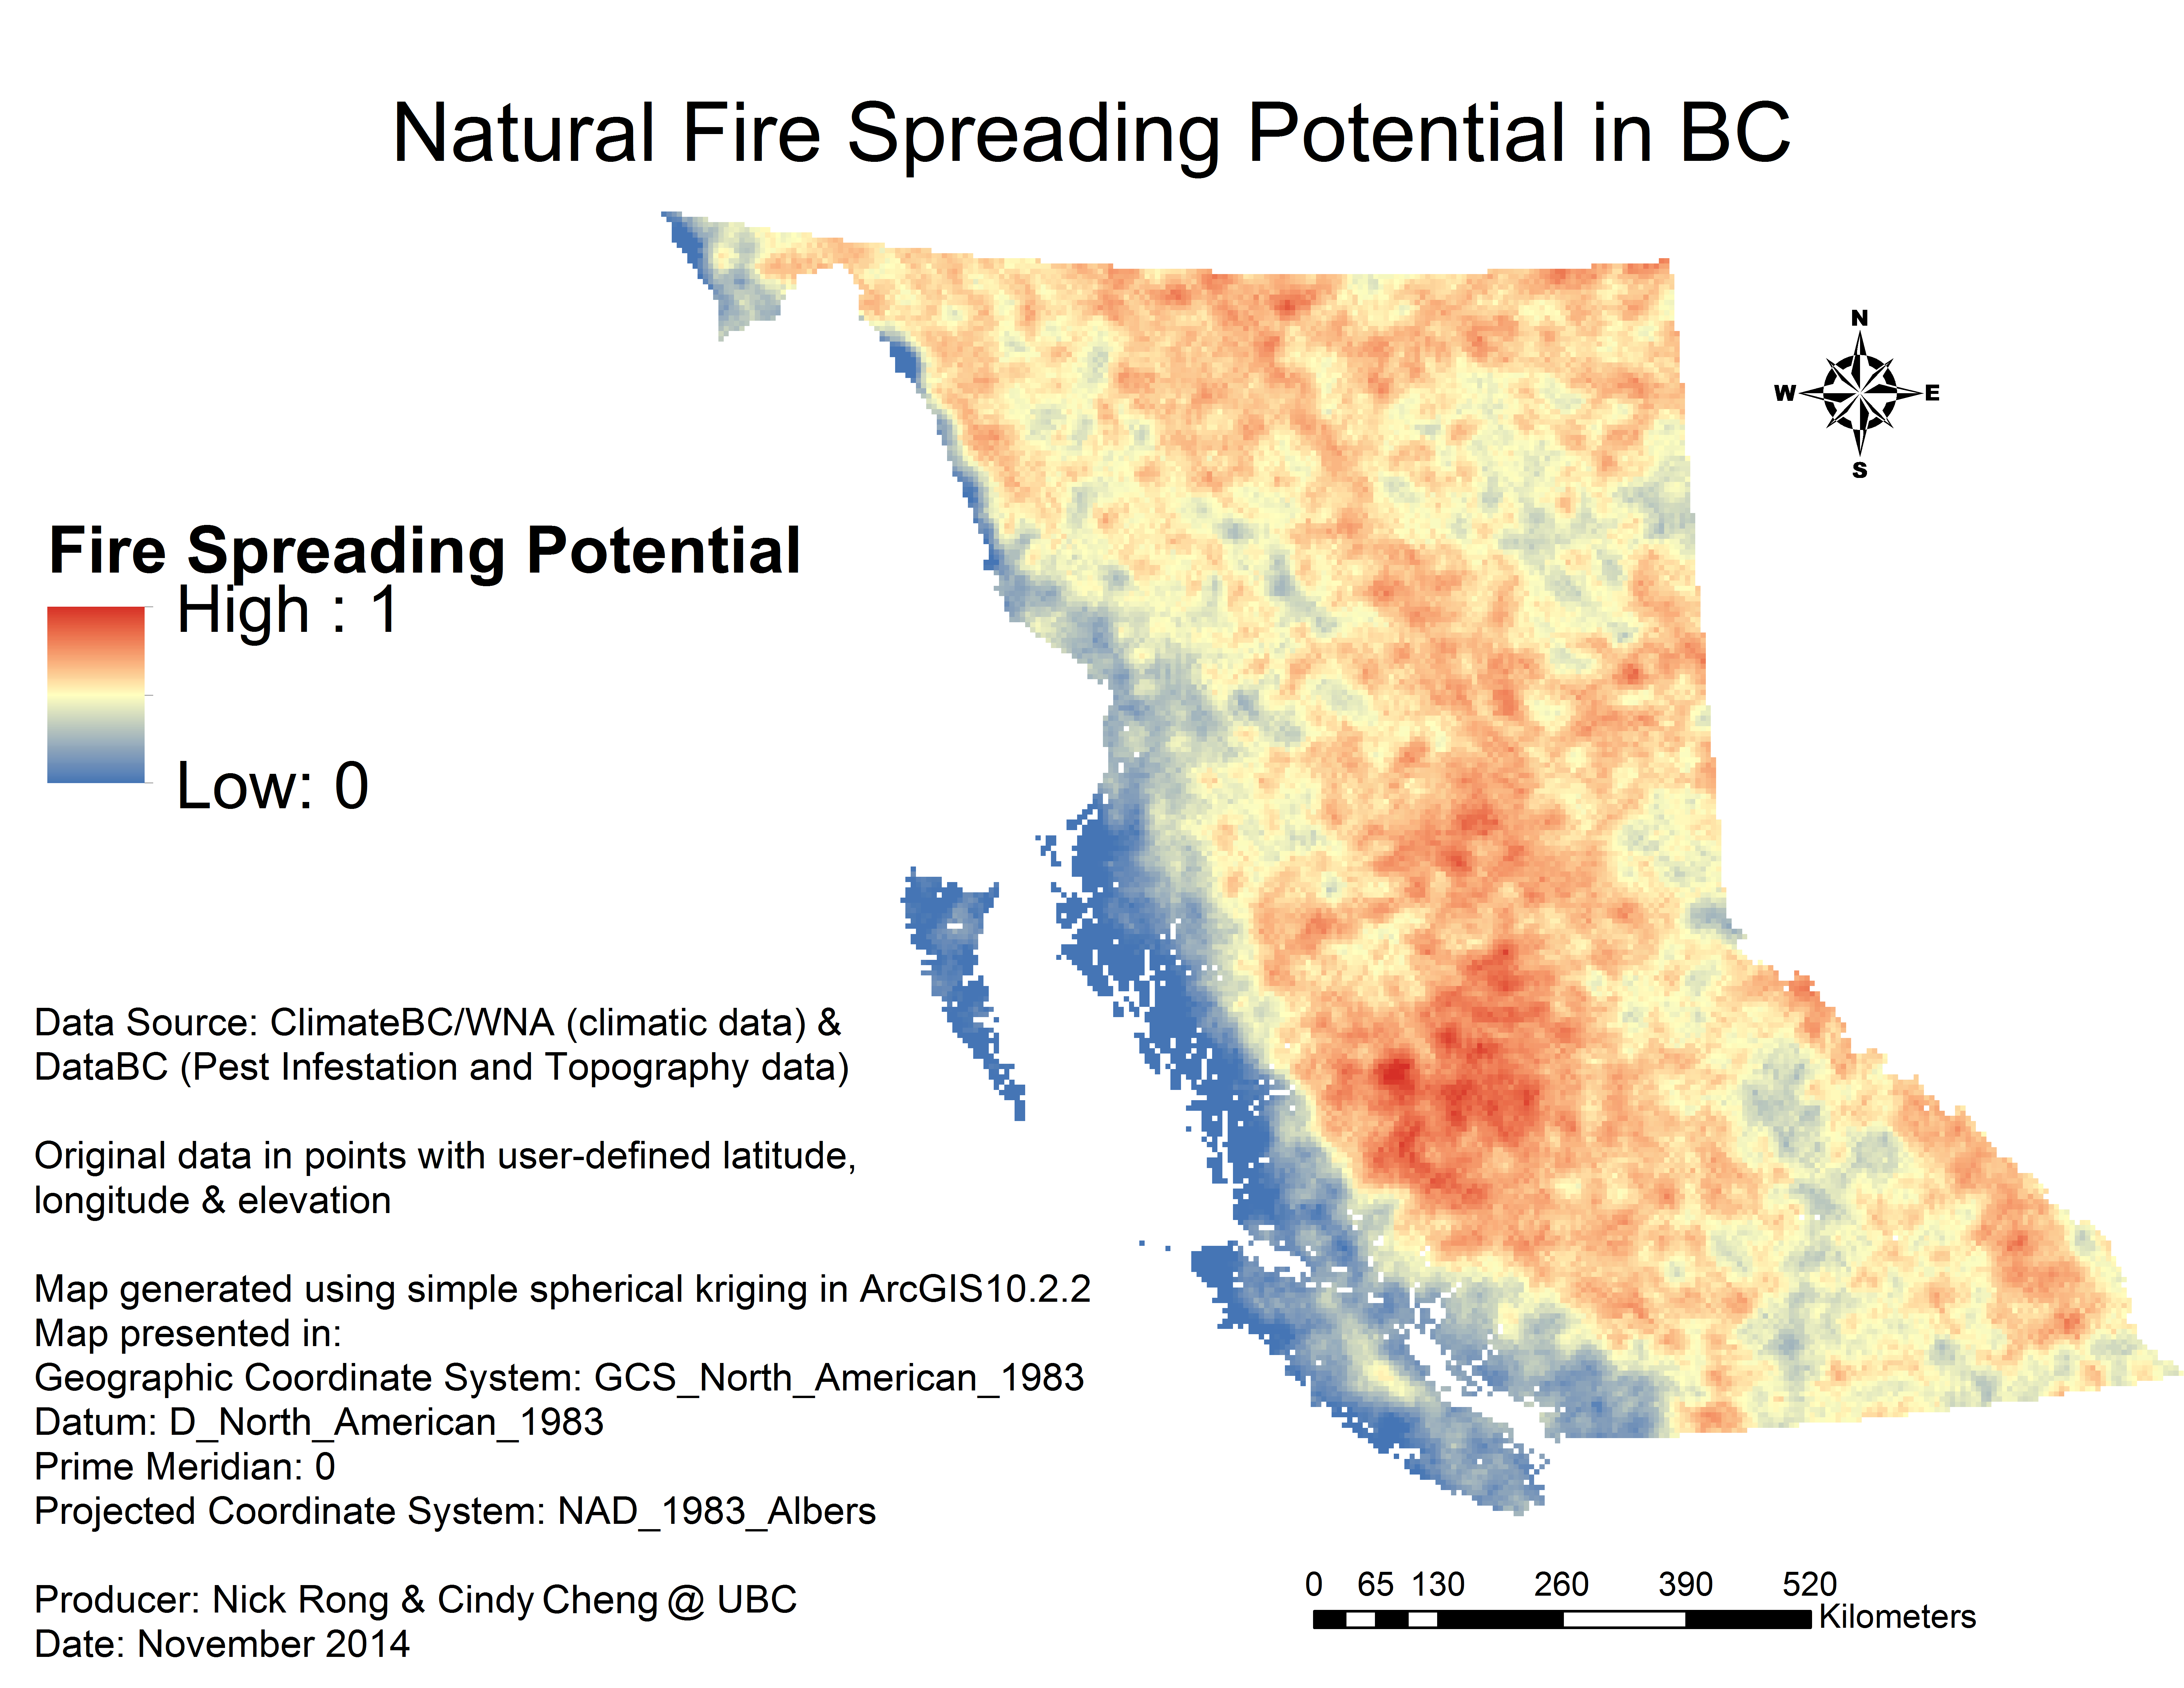
Model 1
with 3-year prior Mountain Pine Beetle (MPB) Infestation data
FireSpreading (y) = -3.65134066 – 9.34766982*Easting + 7.86375958*sqrtEasting – 13.25953401*Southing + 11.46772119*sqrtSouthing + 0.00842460*MPB_2007 + 0.04633359*Slope + 0.49588887*Tave_sp – 0.00489876*PPT_sm – 0.65333597*Tmin_sp
Coefficient of Determination R2 = 0.61
Model 2
Without Mountain Pine Beetle Infestation data
FireSpreading (y) = -3.92951509 – 10.31452654*Easting + 8.73133750*sqrtEasting-13.39768504*Southing + 11.58550996*sqrtSouthing + 0.04378938*slope + 0.54572363*Tave_sp – 0.61157995*Tmin_sp
Coefficient of Determination R2 = 0.56
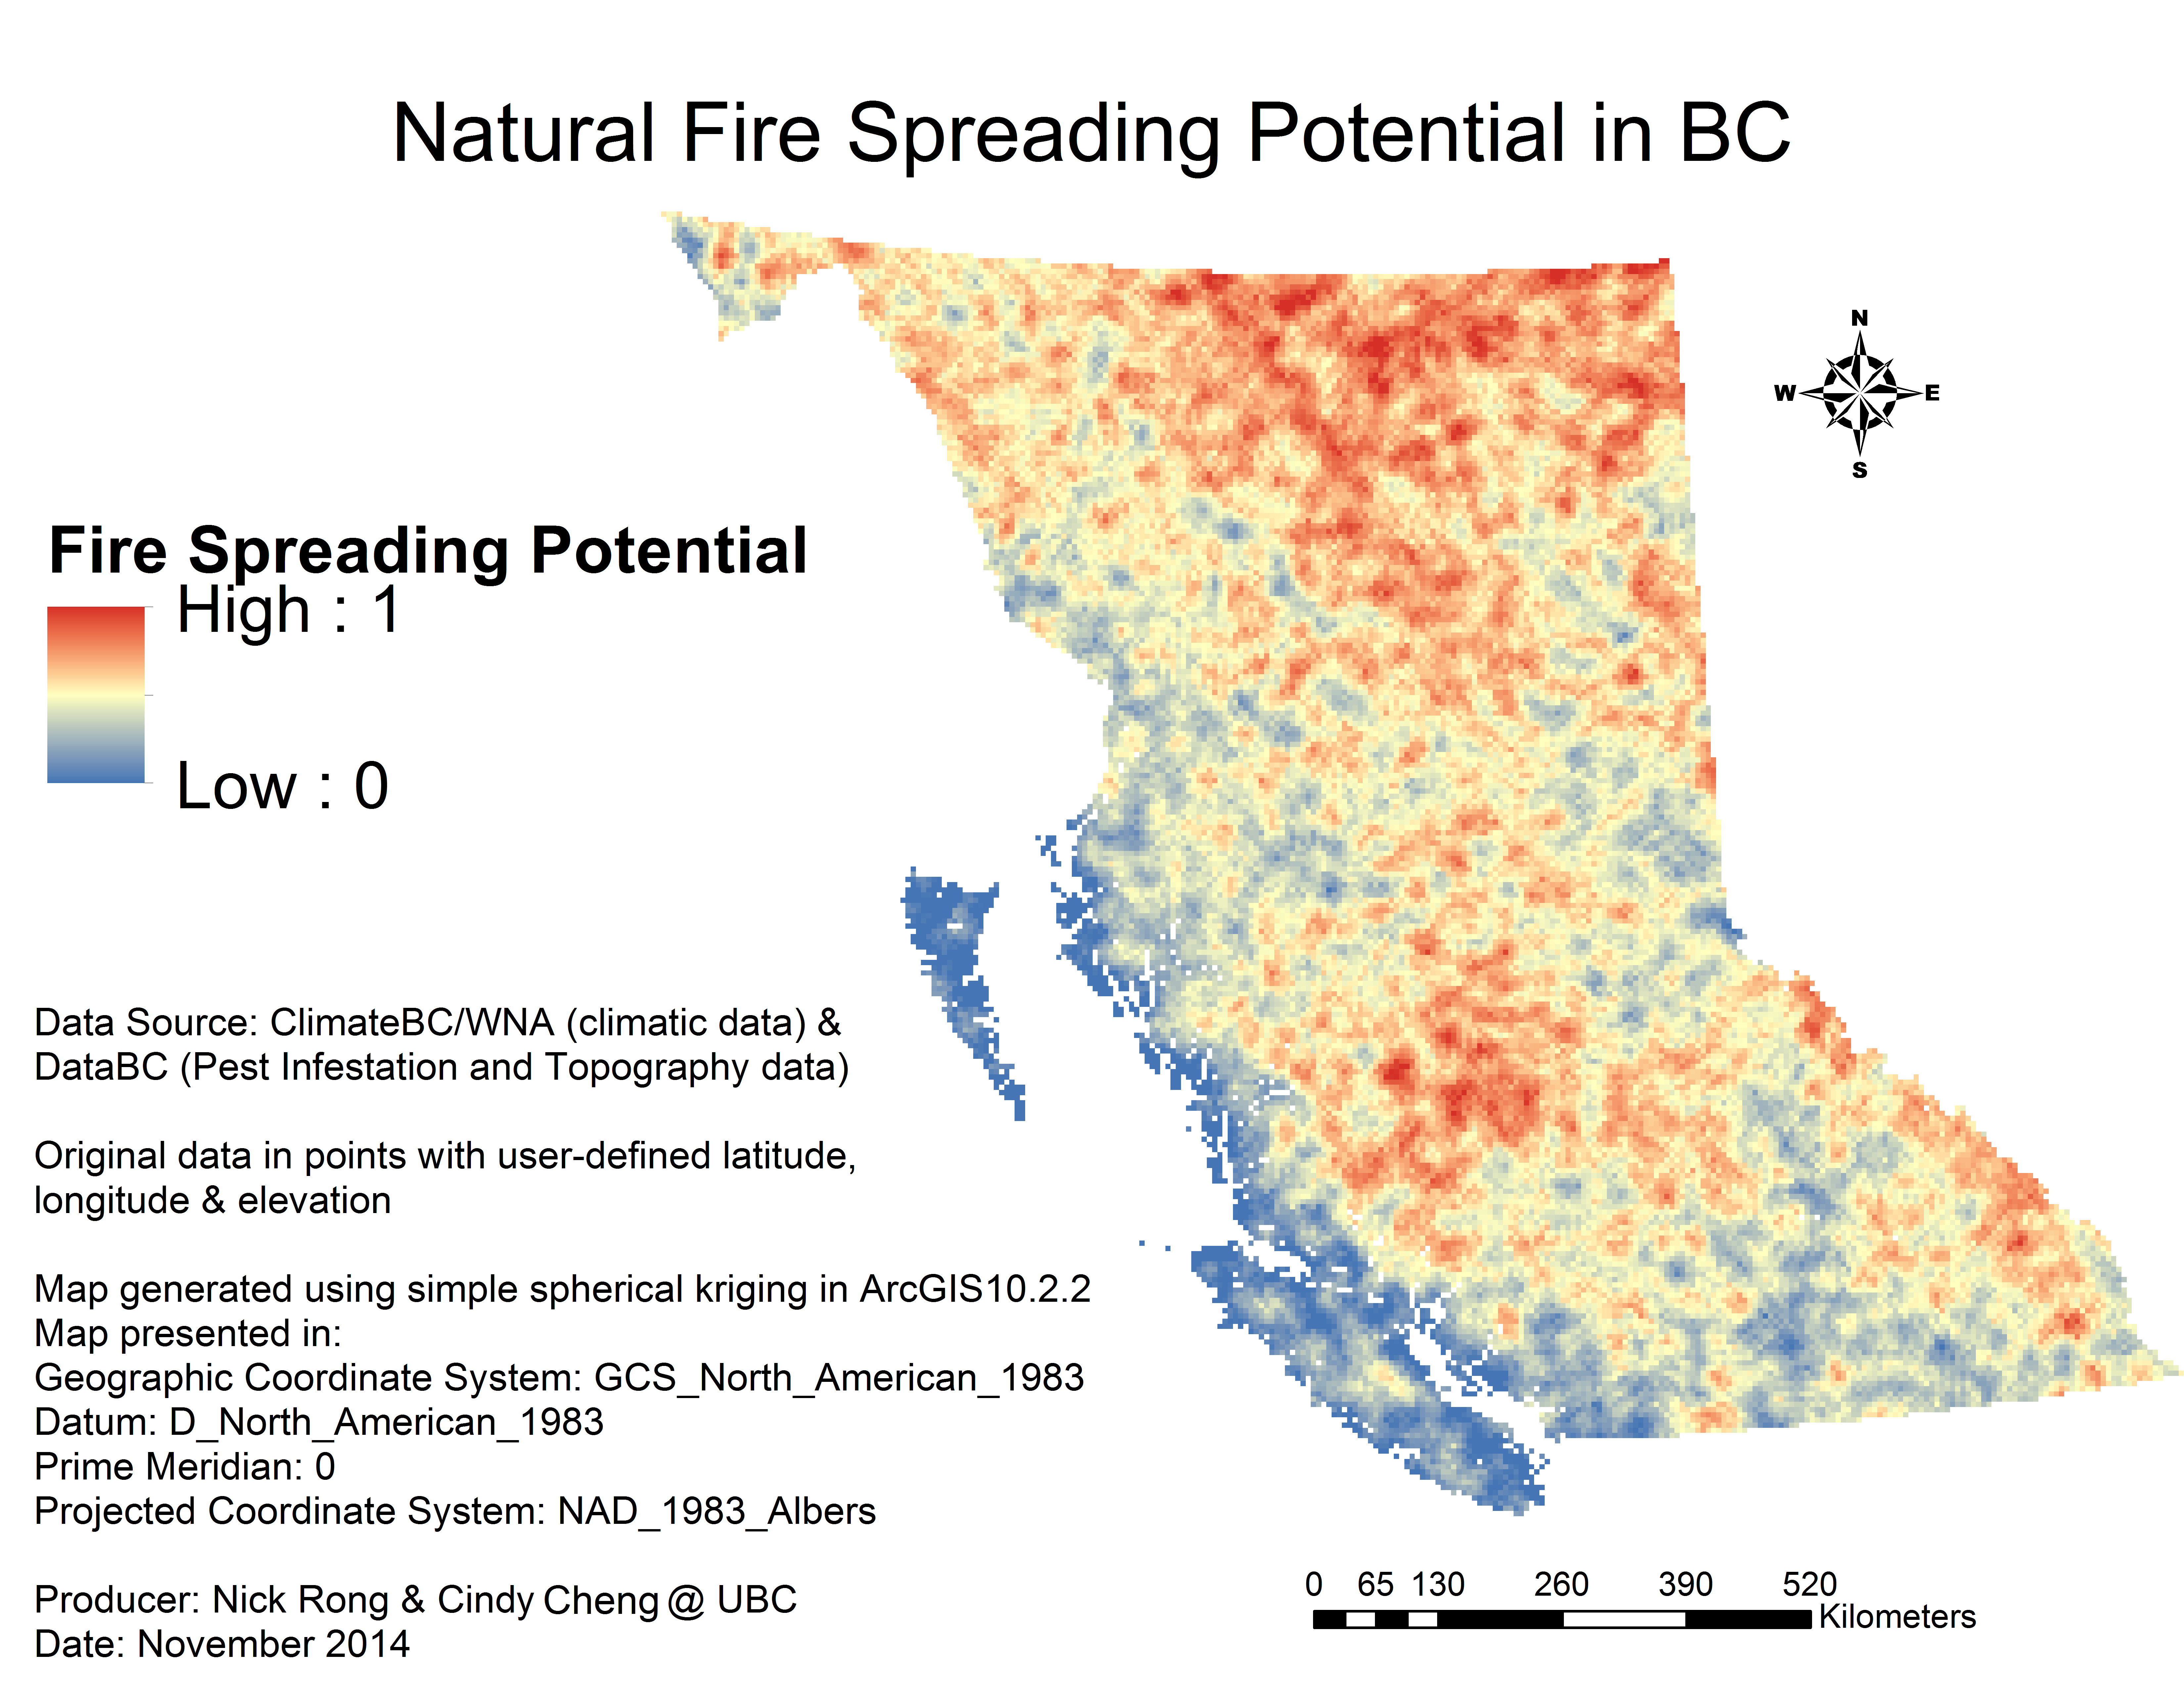
The estimated pattern of fire spreading potential of Model 1 and Model 2 are quite similar in terms of the location with the highest fire spreading potential. Both models project that the interior and northern boundary of BC have the highest potential of fast-spreading fires and the Rocky Mountains (especially the west-facing slopes) have the second highest potential. Coastal BC, in both models, is estimated to have the lowest potential of fast fire spreading rate.
However, differences are found in the scale and severity of the potential projection by the two models.The area with the highest fire spreading potential is largely located in the interior BC according to Model 1, whereas the majority of areas with the highest potential is projected to be in northern BC by Model 2. The fire spreading potential is generally higher in Model 1.
Pairwise Variable Comparison (Model 1 only)
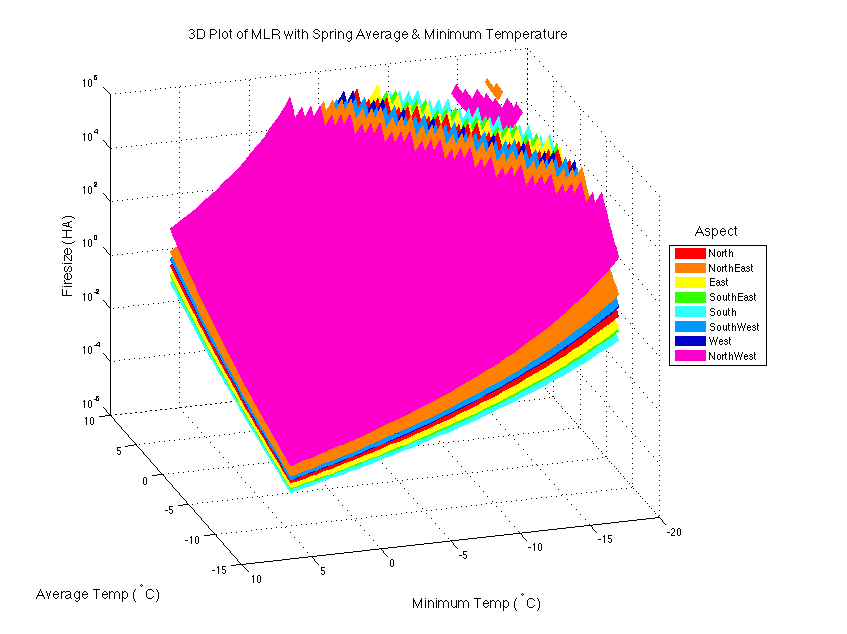
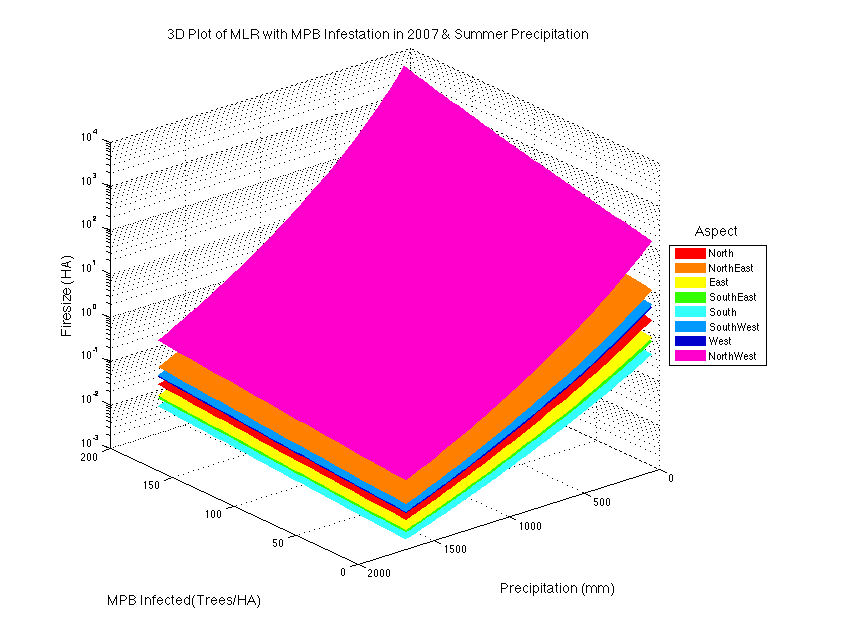

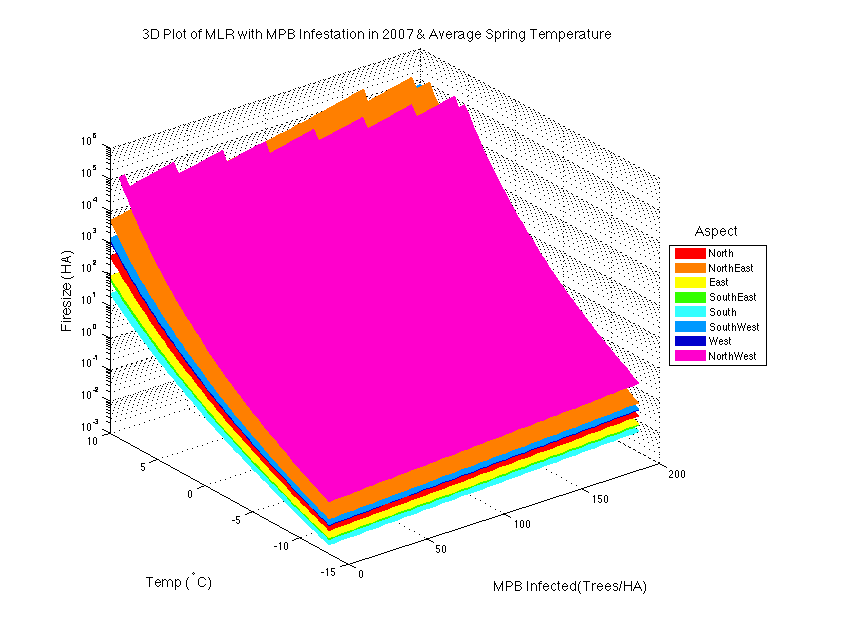

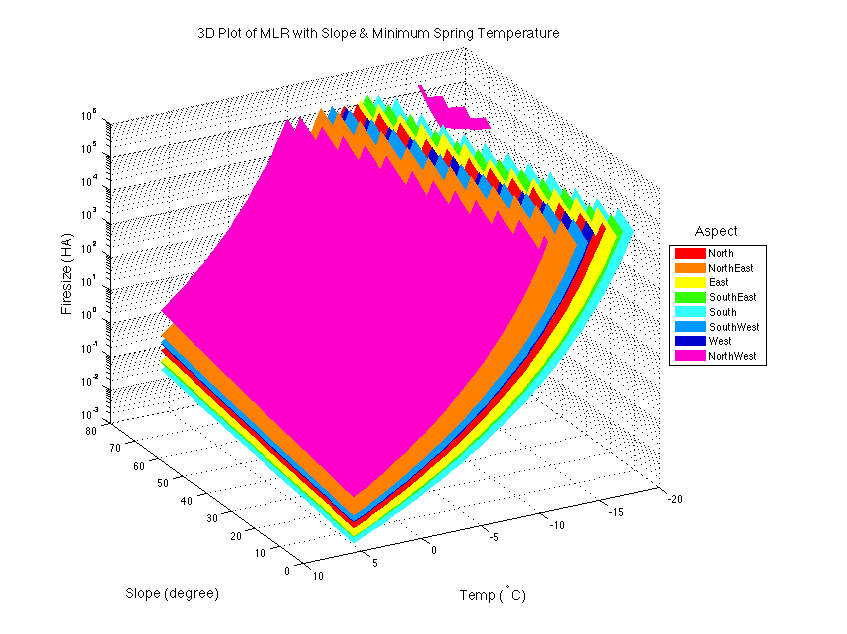

The relative contribution to increase of fire spreading potential from each predictor variable was evaluated. X-Y-Z plots were developed in MATLAB to visualize the effect of each predictor variable on fire spreading. When comparing a pair of predictor variables, other predictor variables stay constant at observed mean value. The 8 different aspects are displayed as 8 different surfaces. There are 10 combinations of pair-variables. The following is the summary of the relative importance of each predictor variable in the model:
SLOPE>=MPB2007 (influence of Slope is marginally larger than MPB2007)
Tave_sp>Slope (larger)
Tmin_sp>>Slope (significantly larger)
PPT_sm>=Slope
Tave_sp>MPB2007
Tmin_sp>>MPB2007
PPT_sm>MPB2007
Tave_sp=Tmin_sp
Result: Tmin_sp = Tave_sp > PPT_sm >= Slope > MPB2007
The eight different coloured layers illustrate the influence of aspect on fire spreading. The Northwest aspect tends to have higher fire spreading potential and the south aspect tends to have lower potential, ceteris paribus.
When all other independent variables are constant:
firespreading(NorthWest) >> firespreading(NorthEast) > firespreading(SouthWest) >= firespreading(West) > firespreading(North) > firespreading(East) >= firespreading(SouthEast) > firespreading(South)