By: Kelsey Wong, Lauren Kummer, Alec Kvarnstrom
Overall Experience with Final Project
Here I have written a brief post about my overall personal experience with this project.
Abstract
Urban greenspace, most commonly in the form of parks, playgrounds, residential greenery, and recreational spaces, provide communities with areas to be physically active, socialize with others, and relax, all while reducing exposure to air pollutants and noise from traffic and industry. Additionally, it has been found that greenspace in urban environments leads to healthier lifestyles, by promoting physical activity and increasing exposure to fresh air. In growing cities, like Metro Vancouver, the amount of urban greenspace appears to be decreasing as houses, apartment buildings, and businesses are constantly being built to accommodate the expanding population. The amount of greenspace in Metro Vancouver varies between neighbourhoods, as does the median total household income. In this project, we found that areas with high incomes had the largest percentage of greenspace (34%), whereas low- and middle-income areas had smaller percentages of greenspace, with 17% and 14% respectively. These findings indicate that wealthier neighbourhoods are more likely to have larger amounts of urban greenspace available to them, and are hence more likely to live healthier, longer lives.
Project Description
As urban greenspace in the form of parks, playgrounds, residential greenery, and recreational spaces have been closely associated with increases in both physical and mental health, we analyzed the relationship between the quantity of greenspace and the median total household income in census tracts (CTs) in Metro Vancouver. Greenspaces have been found to promote physical activity, socialization, and relaxation, all while reducing exposure to air pollutants and city noise. However, fast growing cities like Metro Vancouver have seen recent reductions in greenspace, in order to make room for the expanding population. High-density areas, which are commonly less expensive to live in, have been found to have less surrounding greenspace than lower density areas. This relationship can be correlated to that of greenspace and total household income. In this analysis, we ultimately wanted to determine if there was a relationship between the wealth and health of Metro Vancouver.
Every five years in Canada, all residents participate in a national mandatory survey, known as the Canadian census. This data is collected by Statistics Canada, compiled, and released to the public about one year later. It can be analyzed using GIS software, such as ArcMap, as was done in this geographical analysis. Prior to the 2011 census, 80 percent of Canadians filled out the short-form, and 20 percent filled out the more detailed long-form. However, for the 2011 census, the conservative government decided to make the long-form non-mandatory, decreasing the number of respondents. This change skewed the data, making it much less accurate, and more difficult to compare to previous census data sets. As census data is used and analyzed in many socio-economic and biophysical studies about Canada, this policy change by the Harper government was strongly disliked by many geographers and data scientists. The policy was ultimately removed for the 2016 census, and the long-form was reinstated and deemed mandatory for the 20 percent of the population that received it.
Data from the 2016 Canadian census was used in this analysis, specifically data on the median total household income of census tracts in the Metro Vancouver Census Metropolitan Area (CMA). Census data was also used to divide Metro Vancouver into smaller areas of equal population sizes, known as CTs. Data on Metro Vancouver land use was obtained in order to determine and categorize areas as greenspace.
Methodology
Data Acquisition
Data from the 2016 Canadian census obtained through the University of British Columbia Library and the University of Toronto CHASS data center was used in this analysis. The data set containing the median total household incomes for CTs in the Metro Vancouver CMA was acquired from the CHASS website, while the data containing CT information, as well as rivers, lakes, and provincial boundaries was downloaded from the UBC Library. Data on the 2011 land usage of Metro Vancouver was obtained from the Metro Vancouver Open Data Catalogue in order to determine what areas should be categorized as greenspace.
Data Parsing/Filtering
After creating a geodatabase, importing all relevant data files into it, and adding all of the layers into the data frame, we changed the coordinate system of the data frame to GCS North American 1983 and projected it to UTM Zone 10N. We then clipped the CT data of Canada to the Metro Vancouver CMA. Next, we joined the tabular median total household income census data to the Metro Vancouver CT layer. CTs that had a value of zero for median total household income were removed from the data. Using the data set containing land use information for Metro Vancouver, we queried it in order to create a layer showing only land that was considered to be greenspace (LU code R100) and deleted the rest of the land use data.
Data Mining
In order to analyze our data, we started by creating three separate data frames: low-income, middle-income, and high-income. We added all five layers to each of the three data frames (greenspace, household income by CTs, provincial boundaries, oceans, and rivers). The data value ranges for low-, middle-, and high-income CTs were chosen using the quantile classification method. Next, we queried the total household income layer using the ‘select by attribute’ function in order to create a new layer with only low-income (less than $84,829 annually) CTs. We then clipped the greenspace land use layer to this low-income layer. Finally, we turned all layers on and were able to calculate the ratio of greenspace in low-income CTs to the total low-income CT area in order to determine what percentage of low-income CTs was greenspace. In the other two data frames we performed the exact same analysis, except the total household income layer was queried for values between $84,829 and $103,803 for the middle- income data frame and for values greater than $103,803 for the high-income data frame.
Data Representation
In order to represent our data, we created three maps of Metro Vancouver; one showing low- income greenspace, one showing middle-income greenspace, and one showing high-income greenspace. The low-/middle-/high-income CTs for each of the corresponding maps are shown in a pale orange colour, while the total greenspace contained within those CTs is shown in dark green. Oceans are represented using light blue and the remaining areas of the province that were not being analyzed in the map are shown in light green. All three maps are being shown using the same scale, so that it is easy to compare the CT area and amount of greenspace in each map. Although zooming in on the low- and middle-income maps would make it easier to visually see the amount of green space in the CTs without cutting out any data, it would create a bias, as the high-income map would have to be displayed at a different scale in order to include all high- income CTs in the map.
Dataset Table
| Datafile/Layer Name | Source | Uses | Entity/Data Model | Attributes | Modifications |
| Census Tract (CT); Low/Middle/High Income Tracts | UBC Library, 2017, November 22nd 2019 | Divide Metro Vancouver into smaller areas | Vector – polygons | Canadian Census Tracts (shapefile) | Query to Metro Vancouver CMA; Clip to relevant income CT layer |
| Median total income of households in 2015 ($); Low/Middle/High Income Tracts | http://datacentre.chass.utoronto.ca/census/, 2017, November 22nd 2019 | Determine wealth of CTs | Vector – polygons | Median total income of households in 2015 (tabular file) | Join to Metro Vancouver CT layer; Remove all zero values |
| 2011 Generalized Land Use Classification; Green Space | http://www.metrovancouver.org/data, 2011, November 22nd 2019 | Determine areas of greenspace | Vector – polygons | Metro Vancouver land uses (shapefile) | Query to greenspace land use; Delete all other land uses; Clip to relevant income CT layer |
| Provinces (PR) Canada; Land | UBC Library, 2017, November 22nd 2019 | Identify provincial borders | Vector – polygons | Canadian provinces (shapefile) | None |
| Hydrography – rivers, Canada; Water Bodies | UBC Library, 2017, November 22nd 2019 | Show rivers on maps | Vector – lines | Rivers in Canada (shapefile) | None |
| Hydrography – Great Lakes, St Lawrence and oceans; Water Bodies | UBC Library, 2017, November 22nd 2019 | Show ocean on maps | Vector – polygons | Oceans surrounding and lakes within Canada (shapefile) | None |
Table 1. A dataset table showing information about all of the data that was downloaded and used in this geographical analysis, including where it was retrieved from, what it was used for in this analysis, and was operations were performed on it.
Discussion and Results
Previous studies suggest that the implementation of urban greenspace has a commendable amount of benefits for the urban inhabitants. Areas of higher greenspace coverage are shown to improve social well-being, mental and physical health, as well as contribute to climate regulation for reasons of air quality in the area and a reduction in heat stress (Wüstemann et al. 2017; Kroeger et al., 2014; Ulrich et al., 1991; Coley et al., 1997).
It is also shown that areas that include a higher percentage of low-income dwelling units are faced with worse health conditions and live a lower quality of life than inhabitants of areas in the urban with fewer low-income households (Astell-Burt et al., 2014).
Therefore, it was hypothesized in our study that the incorporation of greenspace in urban areas compared to the total household income of census tracts in Metro Vancouver would coincide with the ideals that a higher income census tract would correlate with a higher percentage of greenspace coverage. This being for a series of reasons, including, higher income residents living in more suburban areas with larger yards for gardens or lawn space, along with streets being covered by tree canopy and boulevards incorporating foliage. In comparison, the lower income census tracts would be located either in the downtown area or close to the urban core, relating to a lower possible area of greenspace, possibly for the reason that there are no yards, no boulevards, and no large trees which create urban canopies of greenery.
A study carried out by Astell-Burt et al. in Australian urban and suburban areas lead to findings that concluded areas with a higher percentage of low-income residents were found to have 18% less coverage of greenspace. Whilst areas with a lower percentage, approximately 0% to 1% of low income residents, were shown to have a much higher contribution of area to greenspace coverage. Although, it is noted that discrepancies were found when comparing cities from around the country. For certain, cities were seen to meet the planning policy of at least 10% greenspace coverage in all neighborhoods whether low- or high-income, whilst the presence of a higher percentage of low-income areas in other cities were seen to result in less than the minimum 10% green space coverage. Meaning that the potential of discrepancies within socio- economic well-being could be due to the fact that urban planners are not equally distributing the focus of greenspace coverage.
After looking at the results gathered in our study, it is seen that our hypothesis did not hold 100% true. The major finding being between high-income census tracts showing a significantly higher percentage of greenspace coverage, at 34.16%, compared to the middle- and low-income census tracts, both sitting below 18% coverage. While the difference between the middle- and low- income census tracts and the greenspace coverage is seen to produce a percent coverage hovering around the same quantity. Where surprisingly, the low-income census tracts calculated a 17.04% coverage, resulting in a higher coverage of greenspace than the middle-income census tracts, which were calculated to have 13.98% coverage. This finding counters our hypothesis of low- income census tracts resulting in the lowest percent coverage of greenspace.
The potential reasoning for the discrepancies of the data calculations of census data based on socio-economic placement in correlation with the percent of greenspace coverage in the specific census tracts could have come to fruition for a number of different reasons, which will be discussed further in the next section.
However, our major finding of higher income areas being supplemented to a higher percent coverage of greenspace leads to the proposition of a potential need for stricter regulations and bylaws for urban planners to incorporate more greenspace, most importantly in lower and middle income areas, however, doing so in all areas of the socio-economic spectrum would not be harmful as long as the ratios are respectfully even in coverage.
If there was a higher presence of greenspace coverage in urban areas no matter the socio- economic background, at least meeting a quota that provides the necessary benefits of living a better life, there would be a higher potential for all inhabitants to live a higher quality of life. Although it is to be mentioned that quality of life is not solely decided by the presence of greenspace in an urban area. For there is still the personal decision inhabitants need to make of utilizing the park for certain positive purposes. In general terms however, the higher incorporation of greenspace in an urban area offers a space for people to potentially meet and socialize, to work-out and exercise, and to relax and enjoy being outside. This can occur all while undoubtedly offering the benefits of better air quality and a reduction in urban heat stress.
Error and Uncertainty
Here we will detail the errors and uncertainties of our project. One possible error in our GIS analysis was including the census tract of the North Shore mountains in the high-income grouping and map. This area is quite large in comparison to the others, and is likely misrepresented. This is because its population is not very large considering the extent of the area which is covered. This makes up a large percentage of the area in the high-income grouping, and would have likely caused the amount of greenspace in this group to be too high. Thus, making our calculations to be not as accurate as it could be.
Another potential error is how we measured/grouped the wealth; we used census tracts of total household income. However, not all groups are represented by using this data. This could include those who did not complete the census tracts, which did not have enough data to be published and made available to us, and rental units (such as basement suites) which are not represented in the census.
In our calculations of the percentage of greenspace per income area we reached results which were not predicted. This included low-income areas having a higher percentage of greenspace than the middle-income group. This result may be an indication of error, as it did not comply with our prediction of higher income groups having more greenspace area than lower income groups. It is seen in the low-income map that the UBC area is included, meaning Pacific Spirit Park is represented as greenspace in this area. Pacific Spirit Park makes up quite a large percentage of area of this low-income group because this group has the least amount of area than its middle- and high-income counterparts. This may have to do with the high cost of living in Vancouver, and thus a smaller area of low-income census tracts. We should have looked further into the household income of UBC’s area, in order to see if representing it in the low-income group was appropriate because this may have caused the percentage of low-income area greenspace to be higher than that of middle-income.
Additionally, we drew our final conclusions from the percentage of greenspace in each income grouping area, which may have posed as an area of uncertainty. Instead of using a percentage we could have assessed each groups green space area as a whole rather than a percent. This may have yielded different results and potentially caused our results to align with our prediction of higher income areas having more greenspace.
Lastly, the way our household income was grouped into low-, middle-, and high-income areas may pose a potential error. This is because some households may be right on the cusp of groups.
Overall, our potential errors and uncertainties of this project include: the large mountainous North Shore census tract area, measurement of wealth, results not aligning with predictions, calculating final results as a percentage, and how household income was grouped.
Further Research/Recommendations
It is recommended that further research is done on this topic of greenspace in urban areas in relation to total household income. Our study focused only on Metro Vancouver, but it could be interesting to see this research applied to other major cities. Further research could include the amount of greenspace based on income compared between different major Canadian cities, or even on a global scale. It may also be of interest to apply this concept to rural or smaller cities, and see if the results vary. It would be interesting to see how results vary from Canadian city to city, as the costs of living and housing are very different than Vancouver in other parts of Canada.
The idea of a global study would be quite a large project but is an important idea to consider as states of living differ vastly around the world, including the amount of greenspace in one’s area in relation to wealth.
Some recommendations for completing another study on greenspace and income is to use a different measure of wealth than census tracts of household income, and see if the results differ. Instead of household income, a different wealth measure could be used, such as property value. Then, groups of property/housing value could be used. This may yield a different result than household income, as some people who make less could be living in wealthier areas or vice versa.
Another recommendation for further study on the Metro Vancouver area is to find a way to accurately represent the North Shore mountain area. As aforementioned, this area’s greenspace is likely misrepresented. Ways to fix this could include: not including this tract in the analysis, or using a different data set to represent a more appropriate sized area.
Overall, our small study of income and greenspace in Metro Vancouver has many areas for further research, and the possibility for both Canadian and global comparison.
Data Visualization: Maps
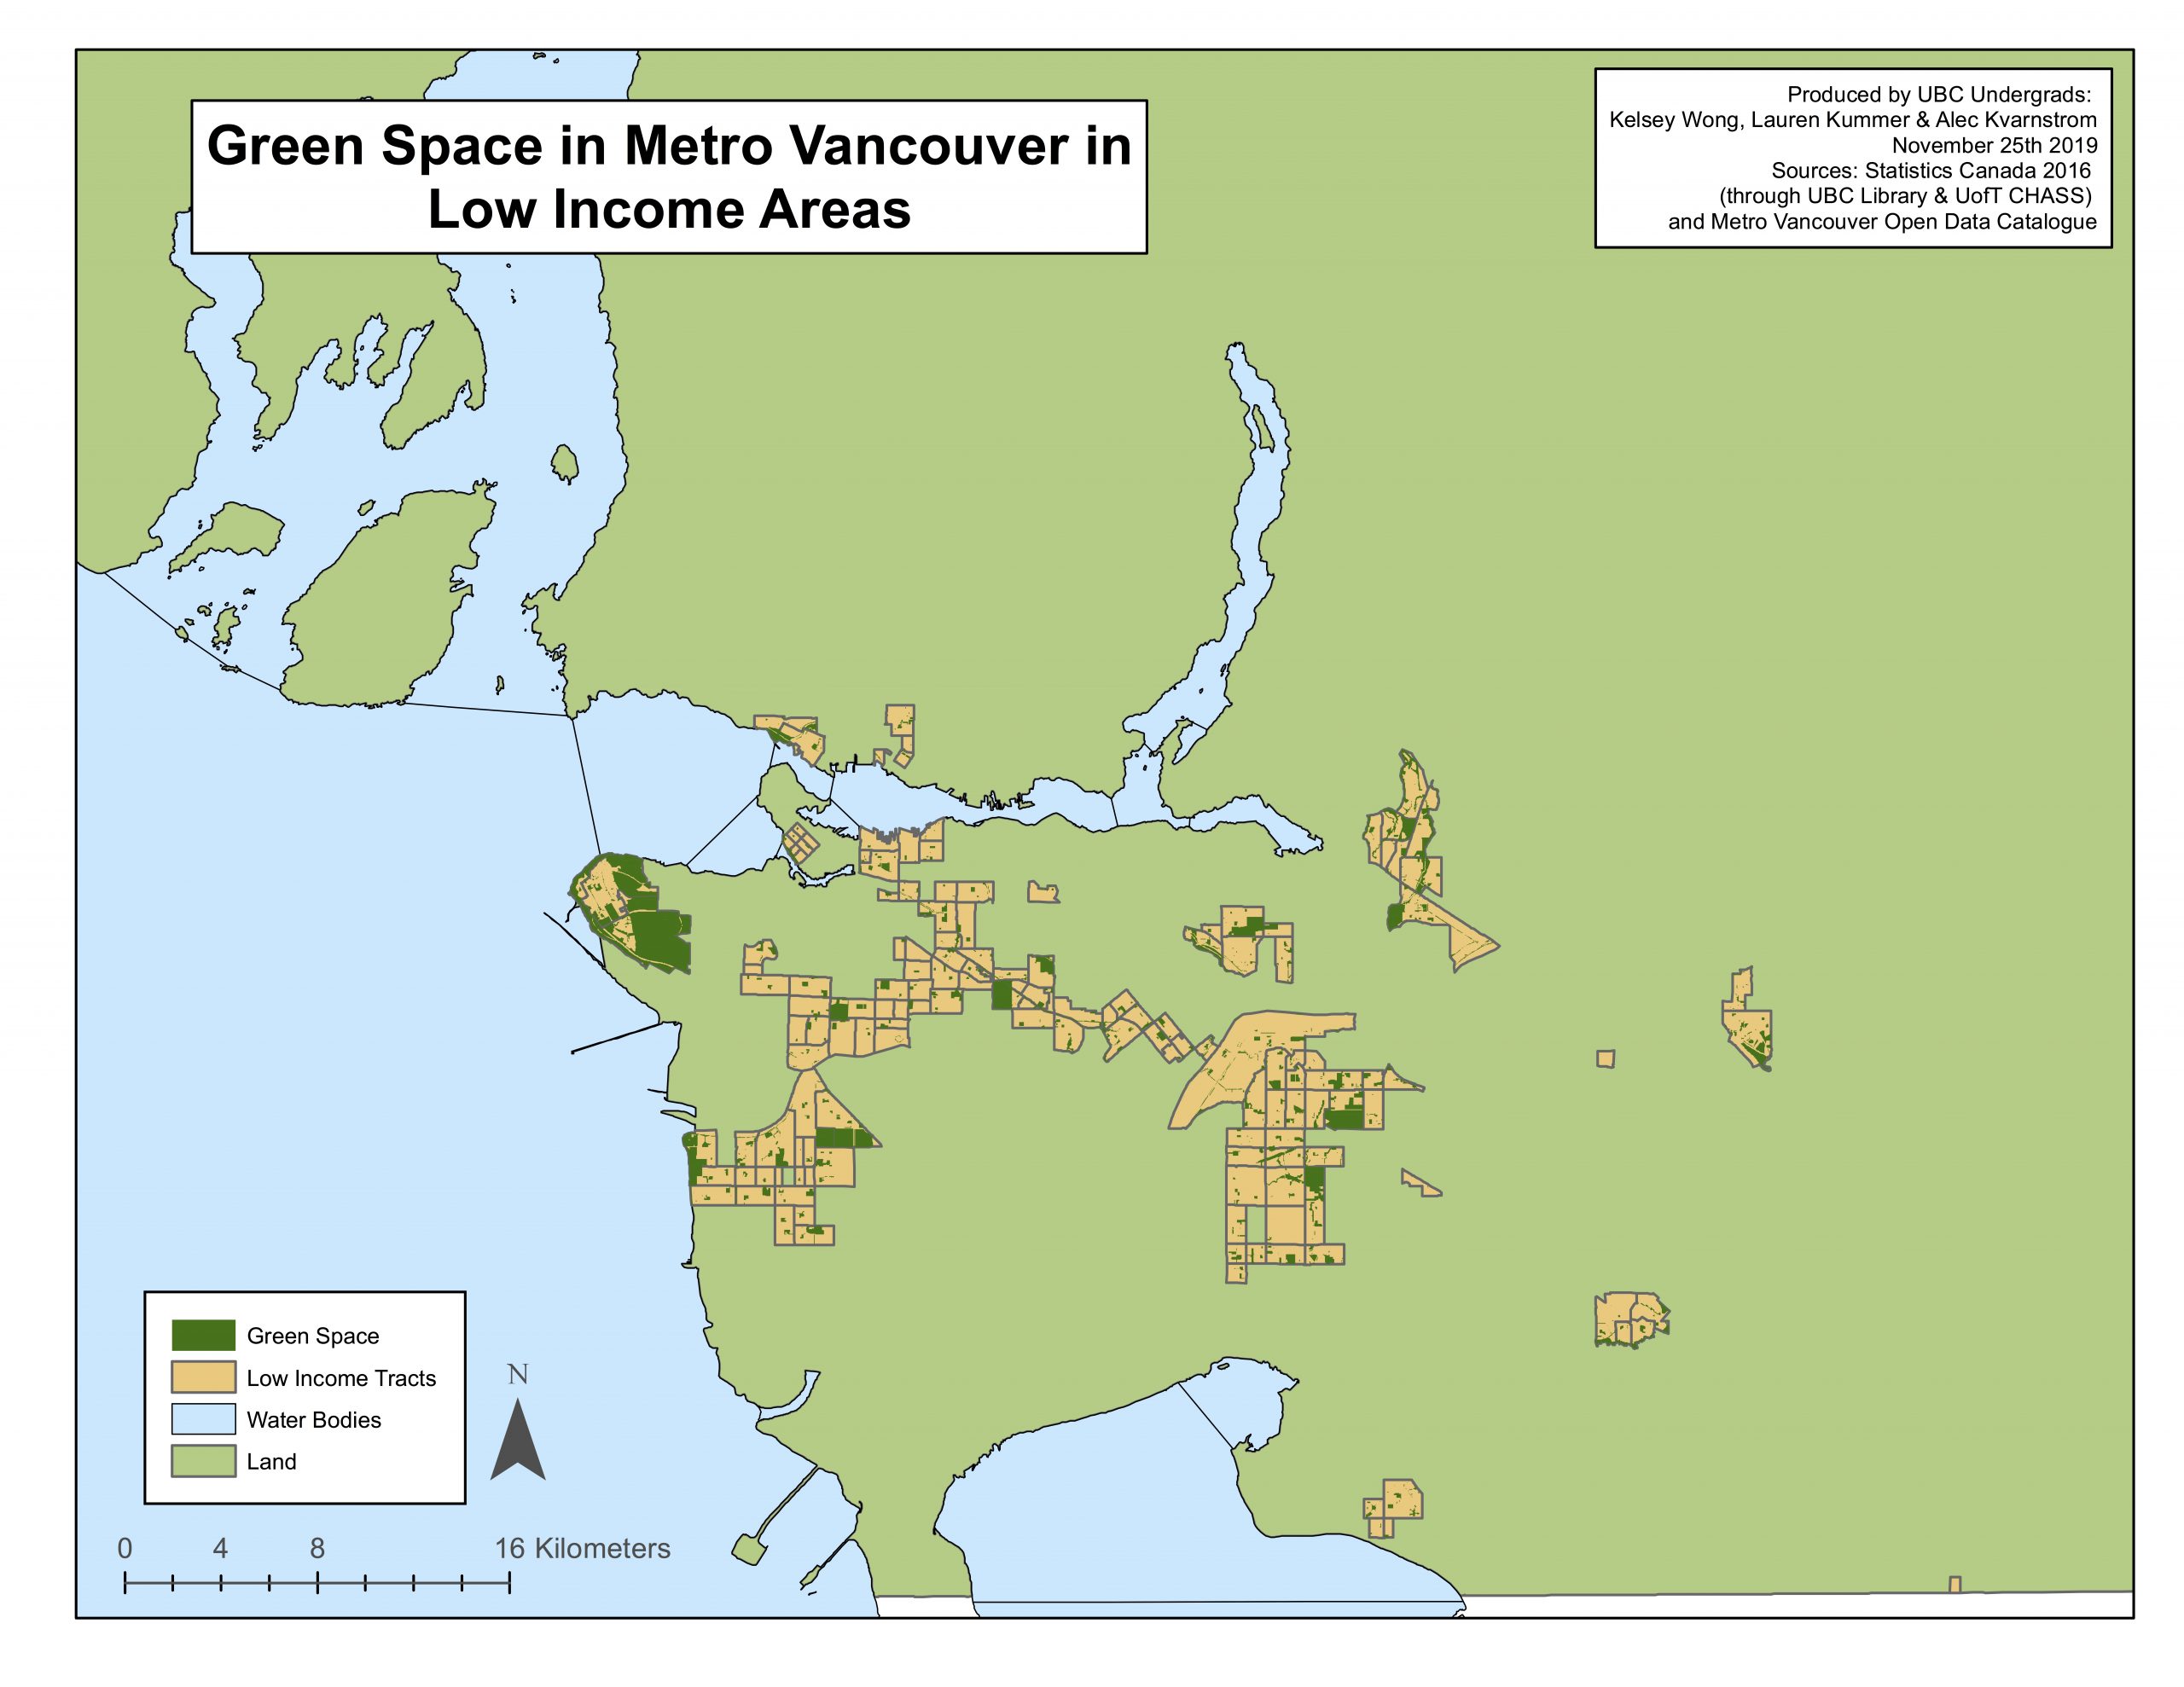
Figure 1. The amount of greenspace in low-income census tracts (CTs) in Metro Vancouver. Low-income CTs were categorized using 2016 Canadian census data as CTs with median total household incomes less than $84,829 annually.
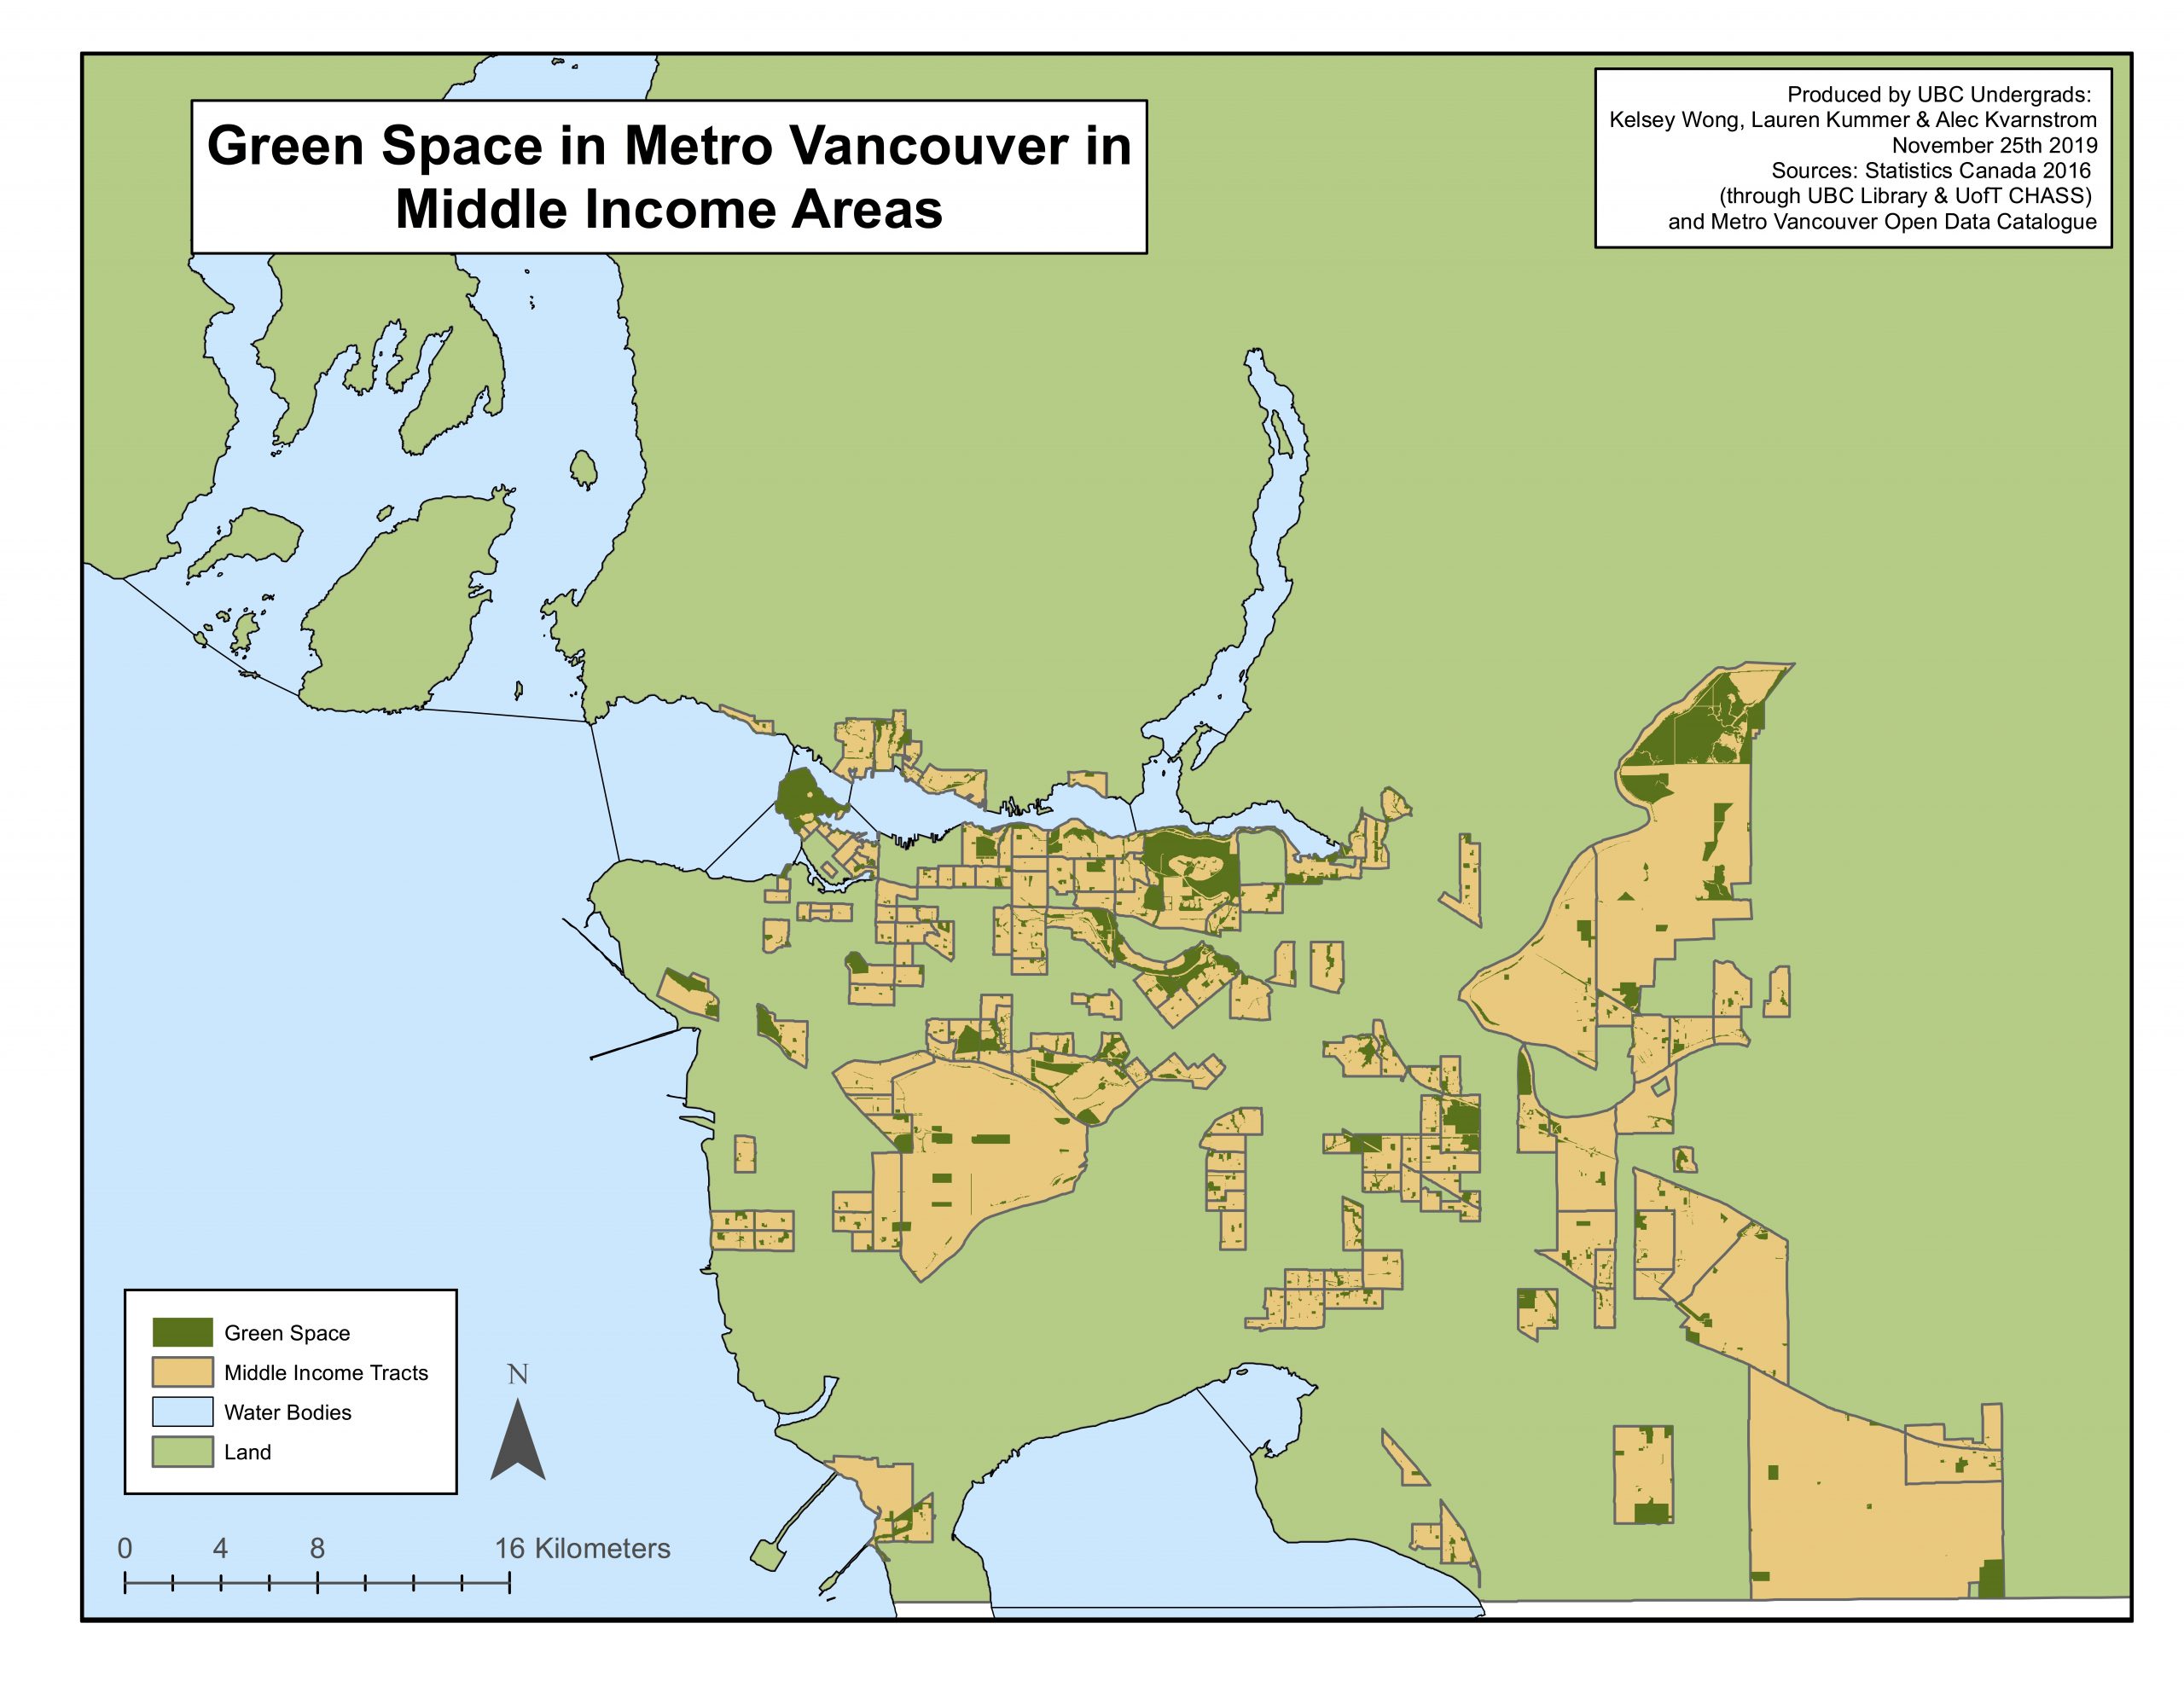
Figure 2. The amount of greenspace in middle-income census tracts (CTs) in Metro Vancouver. Middle-income CTs were categorized using 2016 Canadian census data as CTs with median total household incomes between $84,829 and $103,803 annually.
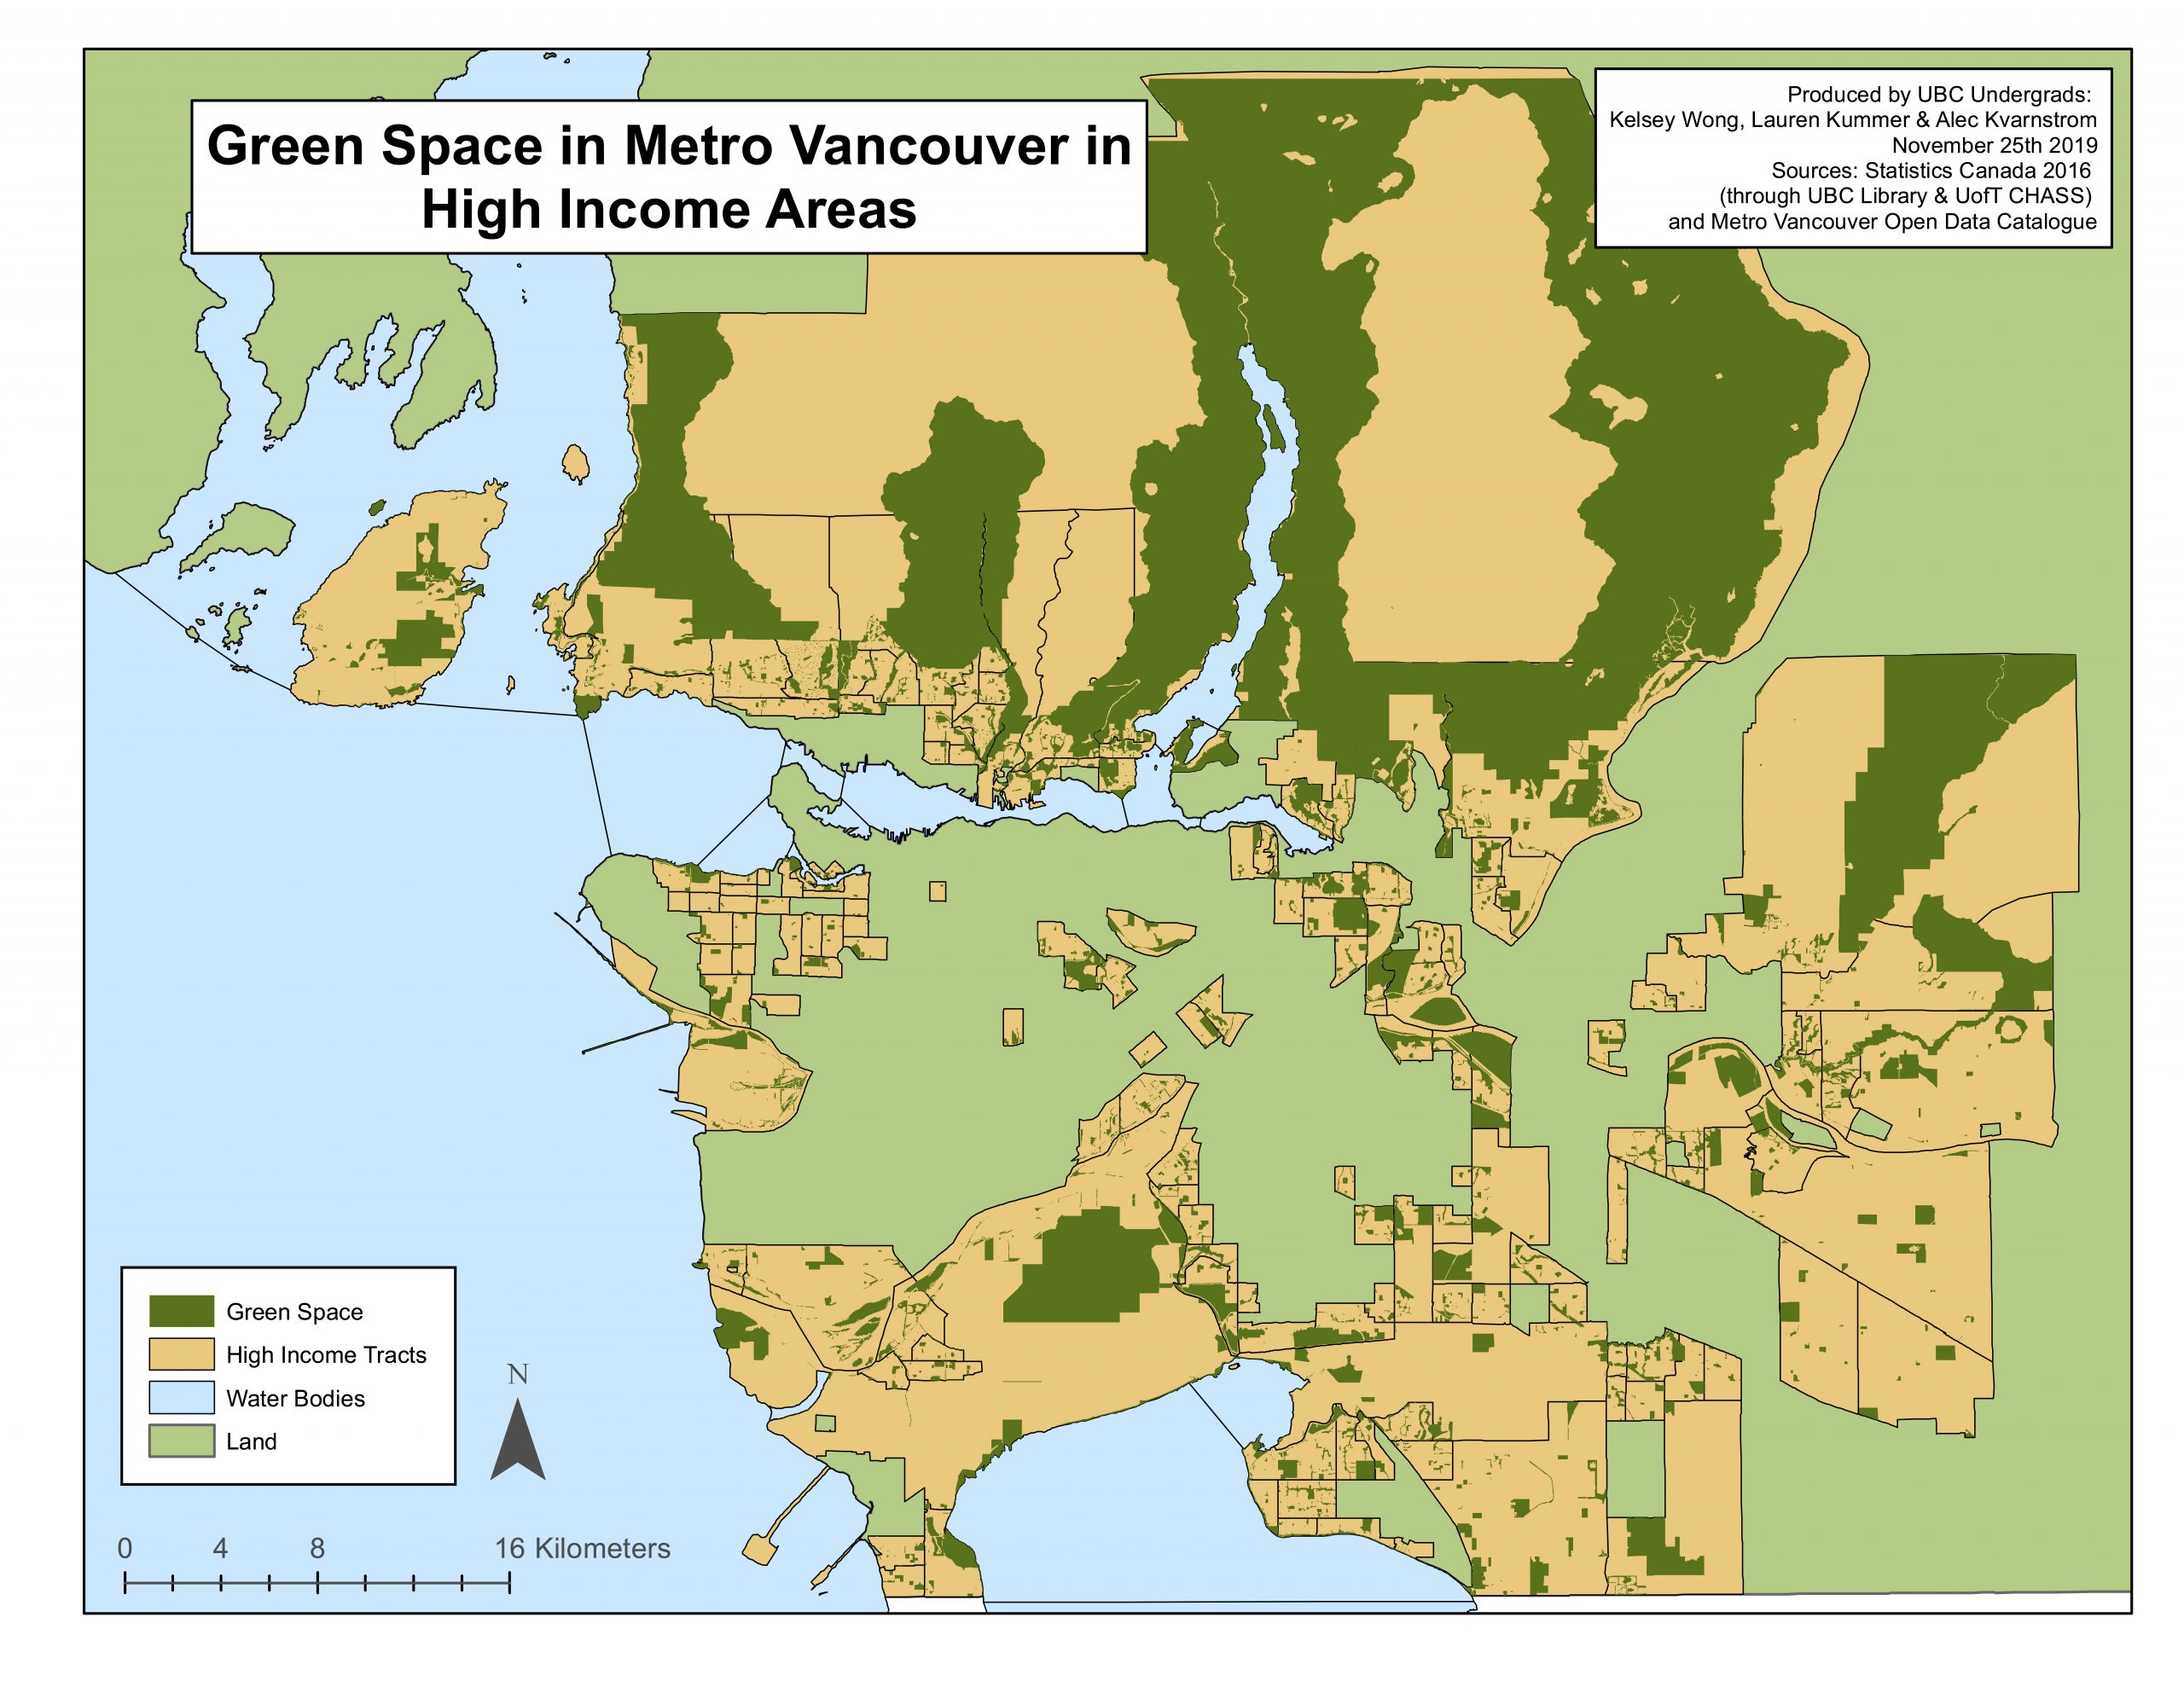
Figure 3. The amount of greenspace in high-income census tracts (CTs) in Metro Vancouver. High-income CTs were categorized using 2016 Canadian census data as CTs with median total household incomes greater than $103,803 annually.
GIS Analysis: Flowcharts
ALL DATA FLOWCHART:
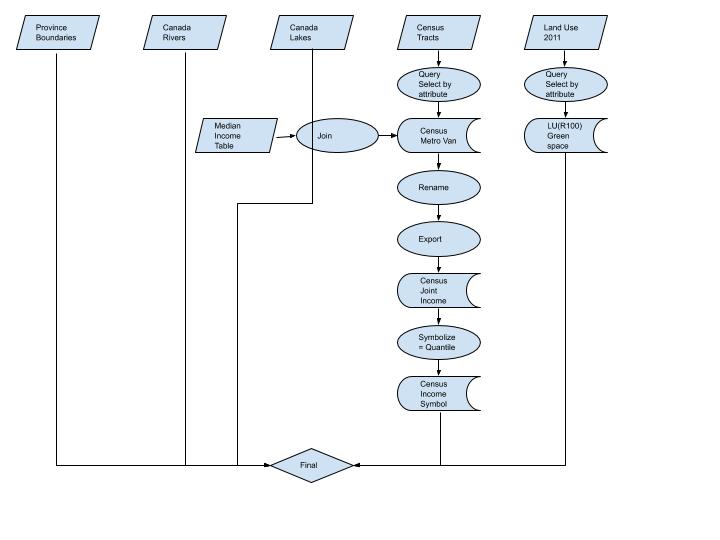
Figure 4. A flowchart showing all of the steps and specific operations that were performed during the GIS analysis of the data.
LOW-INCOME MAP FLOWCHART:
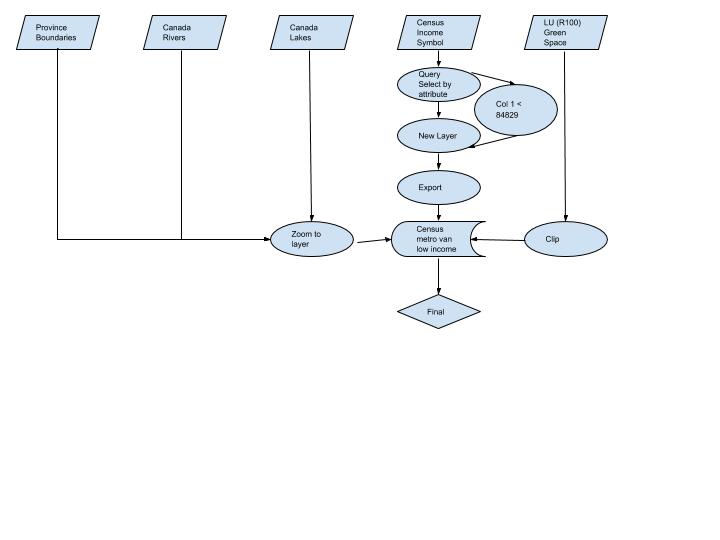
Figure 5. A flowchart showing the steps and specific operations that were performed during the GIS analysis of the low-income data.
MIDDLE-INCOME MAP FLOWCHART:
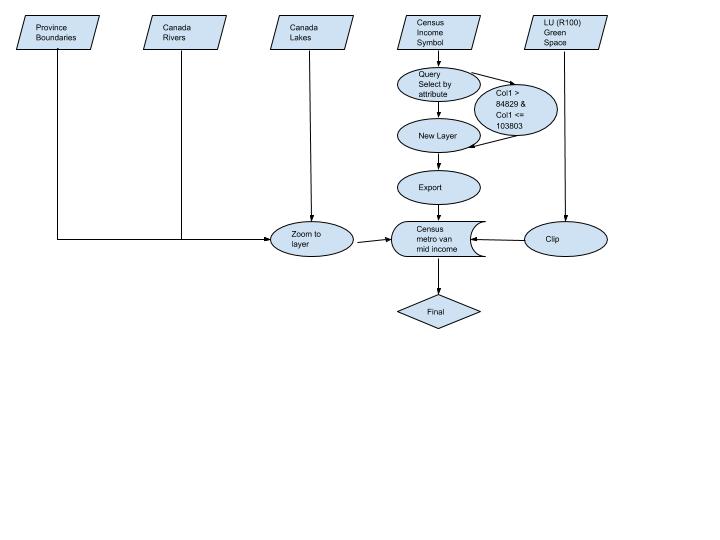
Figure 6. A flowchart showing the steps and specific operations that were performed during the GIS analysis of the middle-income data.
HIGH-INCOME MAP FLOWCHART:

Figure 7. A flowchart showing the steps and specific operations that were performed during the GIS analysis of the high-income data.
Data Analysis Calculations
| Low-Income | Middle-Income | High-Income | |
| Total Area (m^2) | 195877585.342183 | 541402826.591885 | 2256929096.367867 |
| Total Greenspace (m^2) | 33368926.54021 | 75664202.764118 | 773159734.384112 |
| Percentage | 17.04% | 13.98% | 34.26% |
Table 2. The data that was collected during the GIS analysis and used to draw conclusions about the percentage of greenspace in each of the three income categories of census tracts in Metro Vancouver.
Bibliography
Astell-Burt, T., Feng, X., Mavoa, S., Badland, H. M., & Giles-Corti, B. (2014). Do low-income neighbourhoods have the least green space? A cross-sectional study of Australia’s most populous cities. BMC Public Health, 14(1), 292-292. doi:10.1186/1471-2458-14-292
Coley, R. L., Sullivan, W. C., & Kuo, F. E. (1997). Where does community grow?: The social context created by nature in urban public housing. Environment and Behavior, 29(4), 468-494. doi:10.1177/001391659702900402
Kroeger, T., Escobedo, F. J., Hernandez, J. L., Varela, S., Delphin, S., Fisher, J.R., & Waldron, J. (2014). Reforestation as a novel abatement and compliance measure for ground-level ozone. Proceedings of the National Academy of Sciences, 111(40), E4204-E4213. doi:10.1073/pnas.1409785111
Ulrich, R. S., Simons, R. F., Losito, B. D., Fiorito, E., Miles, M. A., & Zelson, M. (1991). Stress recovery during exposure to natural and urban environments. Journal of Environmental Psychology, 11(3), 201-230. doi:10.1016/S0272-4944(05)80184-7
Wüstemann, H., Kalisch, D., & Kolbe, J. (2017). Access to urban green space and environmental inequalities in Germany. Landscape and Urban Planning, 164, 124-131. doi:10.1016/j.landurbplan.2017.04.002