Quantitative Data Classification
Using multiple different methods of data classification, I mapped out the cost of rental housing in Metro Vancouver, finding that classifying this data using manual breaks was the best method for this particular analysis. Different methods of data classification can greatly influence the interpretation of data on maps. Data classification can be used to help visualize spatial patterns, as well as match value ranges from the legend to the map. The method of classification used to display certain data differs depending on the intended audience (ie: general public, data scientists, government officials, lawyers, etc.), the type of data that is being used (the data distribution and whether or not there are multiple data sets being analyzed), and the purpose of the map, or point of view you chose to display your data from in order to best persuade the audience in the way that you desire (or from the most neutral point of view if you do not want there to be any bias in your maps). Figure 1 shows the median monthly housing rental costs in Metro Vancouver, displayed using four different methods of classification: natural breaks, equal interval classification, manual breaks, and standard deviation classification.
Classifying data using natural breaks is done by looking for places in the data set/histogram where the values appear to naturally break, such as where there are abnormally large gaps in values between data points; this method takes into consideration the distribution of the data. Jenks optimization can be used to determine natural breaks, by trying to obtain maximum homogeneity within classes and maximum heterogeneity between classes.
Equal interval classification uses the range of the data and the number of classes that are desired in order to calculate a common difference for the data set. The common difference is then used to divide the data into classes that are evenly spaced apart. This method works best when the data set is uniform, and not skewed, as highly skewed data may result in classes that contain no values. Equal interval classification does not take into consideration the distribution of the data, however, it is relatively easy to both understand and compute.
Standard deviation classification is done by calculating the mean and the standard deviation of the data in order to determine the class boundaries. This method is only used when there is a normal distribution of data, and when the purpose of the map is to display how far from the mean of the data the values are, showing that values both above and below the mean are of equal importance.
The final method of classification shown in figure 1 was done using manual breaks, and is the best way of classifying the data for this geographical analysis. In this method, the GIS analyst manually choses and enters where the data should break. It is a good method to use when comparing multiple maps, in order to maintain consistency between the values of classes. The distribution of data is commonly only taken into consideration for the first dataset, in which the class breaks are determined, and is not considered in further datasets as the class breaks have already been determined and are not changed.
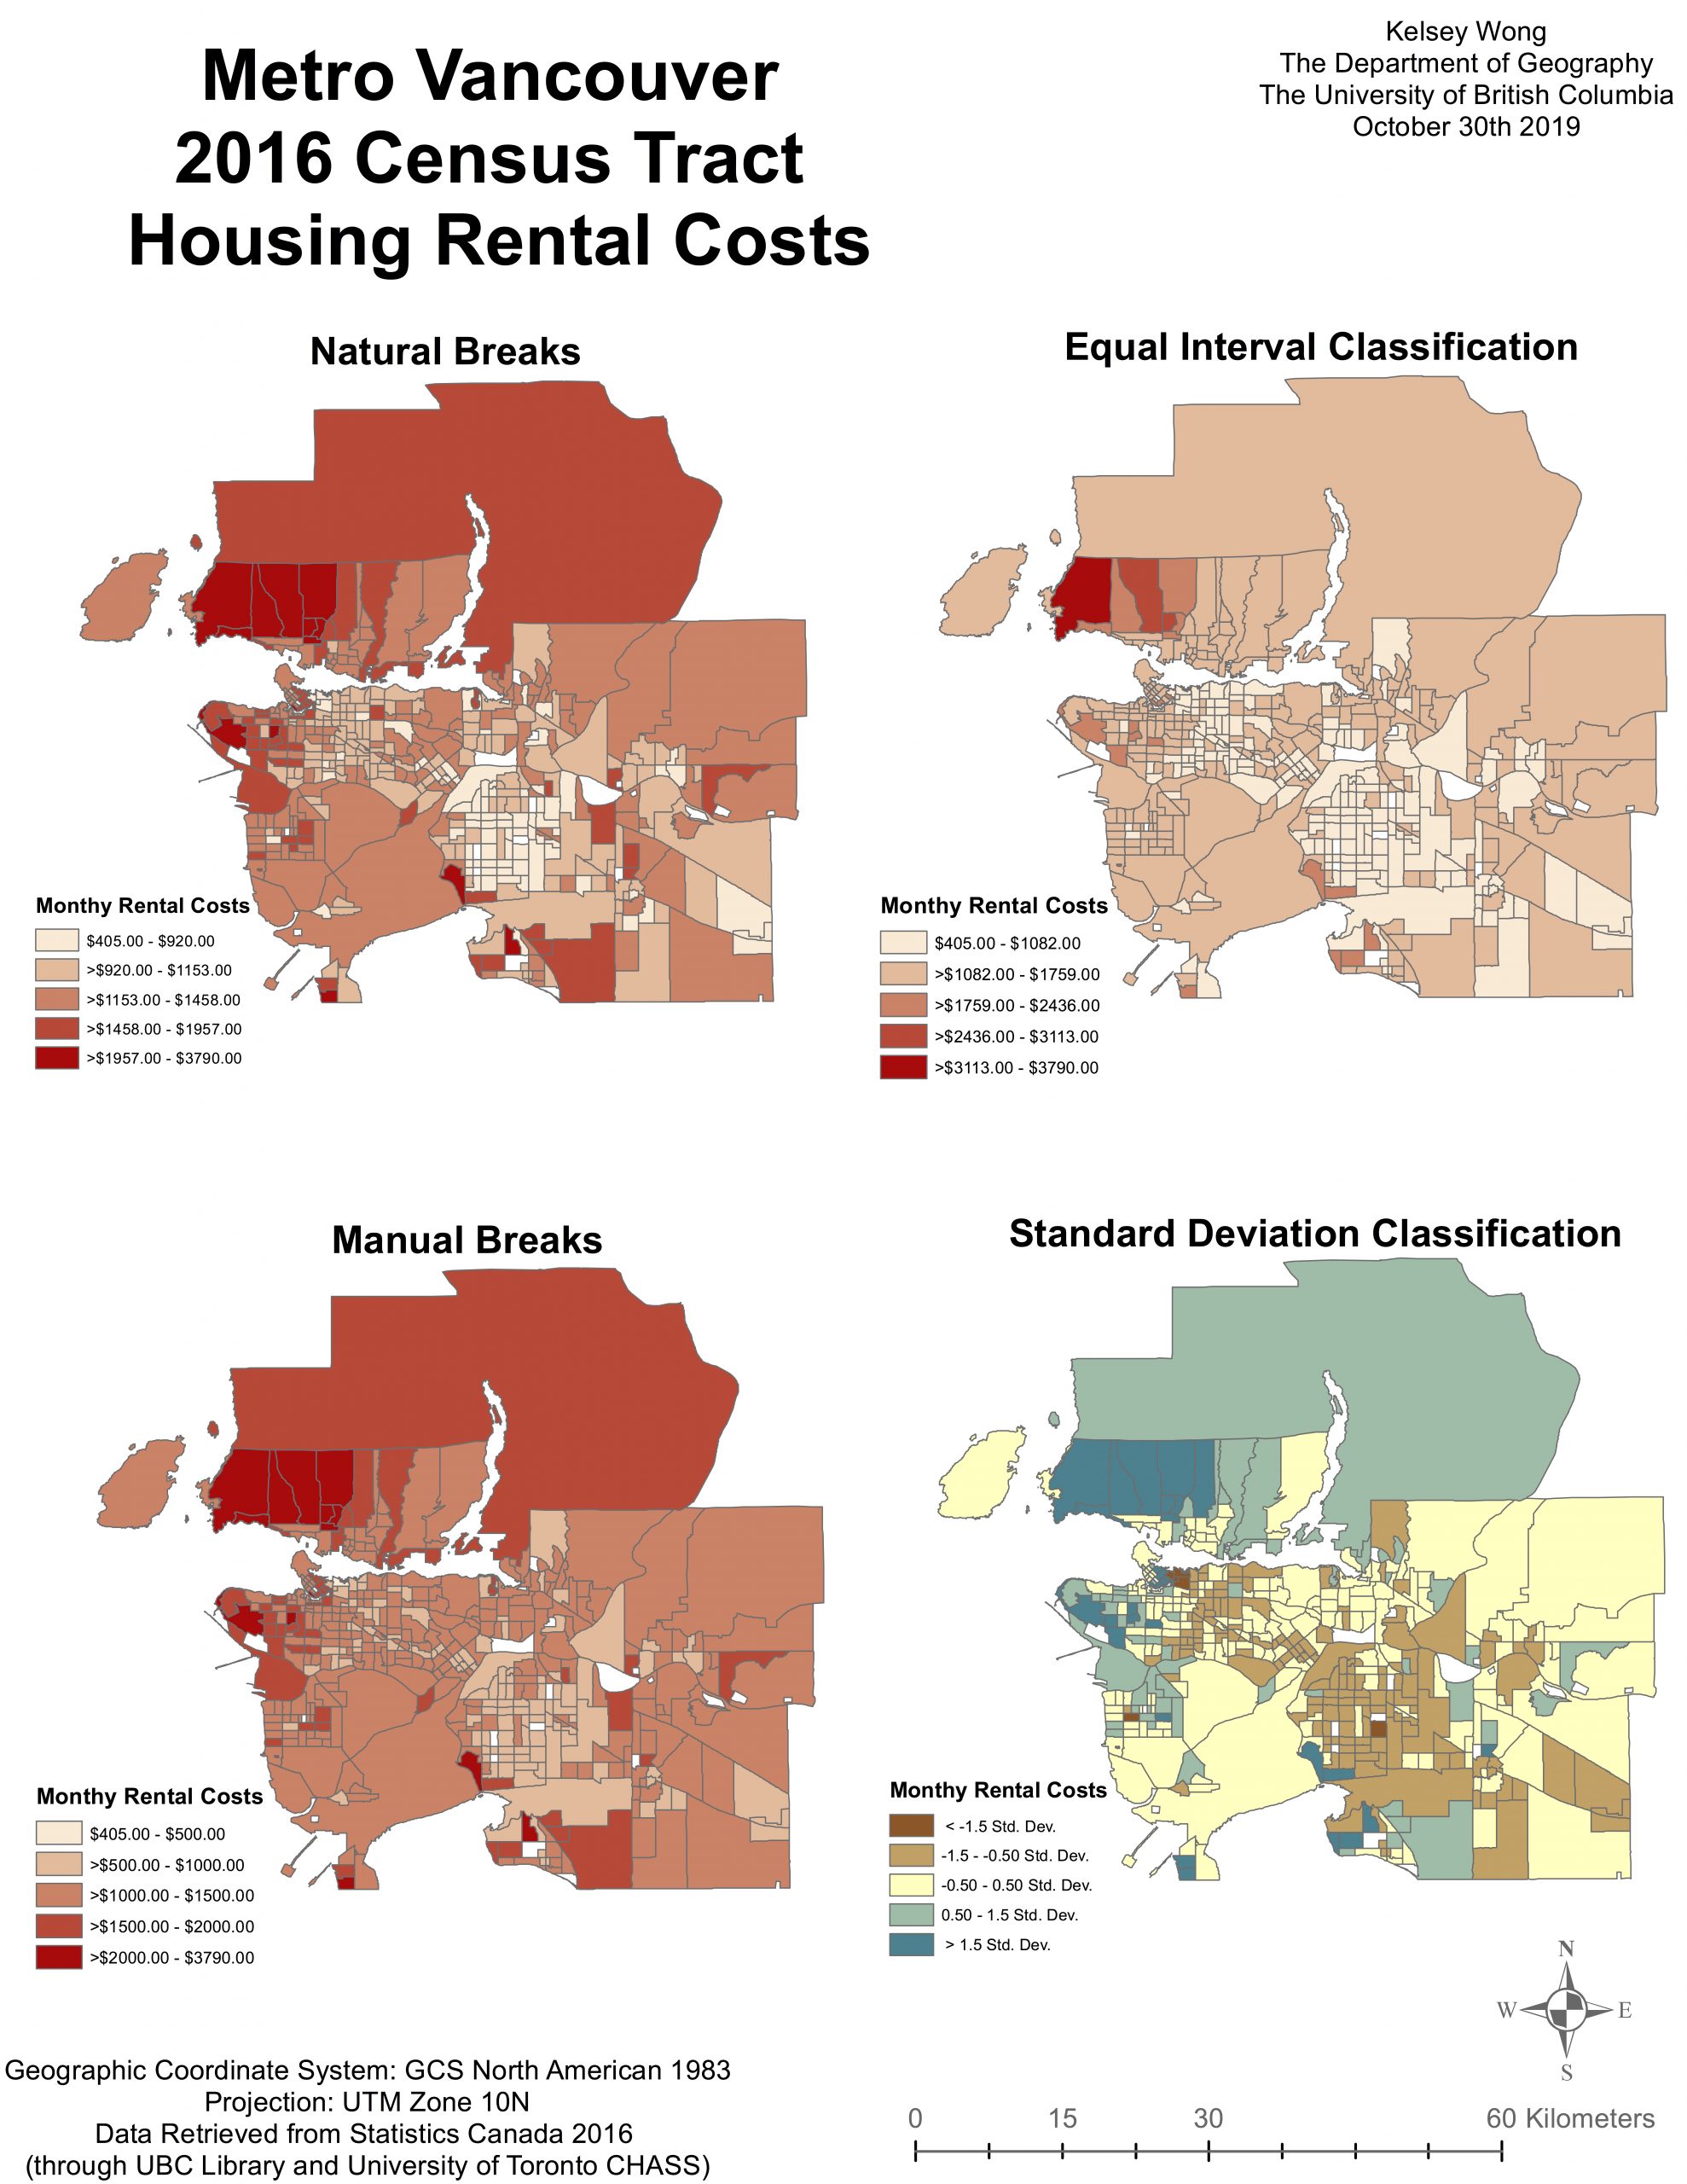
Figure 1. These maps show the median monthly rental costs of housing in Metro Vancouver, classified using four different methods: natural breaks, equal interval classification, manual breaks, and standard deviation classification. Data from the 2016 Canadian census was used in this analysis, and census tracts were used to divide Metro Vancouver into smaller areas. Census tracts that did not have any associated census data for monthly housing rental costs were excluded from this analysis and are shown in white.
Cost of Rental in Montreal and Metro Vancouver
The maps in figure 2 compare the housing rental costs between Montreal and Metro Vancouver by assigning each census tract a median monthly housing rental cost value and categorizing it into one of five different data classes. The results indicate that Vancouver has a greater number of more expensive Census tracts (CTs) than Montreal. CTs were used to divide both metropolitans into smaller areas of relatively equal population sizes. CTs that failed to have adequate amounts of data to publish in regards to the variable being analyzed, median monthly housing rental costs, were given a value of zero, and were not included in this data analysis. According to the rules set out by Statistics Canada, data suppression occurs for datasets in CTs with less than 40 respondents. Due to the fact that many CTs might not contain any rental units, the data from the rental units might be suppressed due to low response rates, or the rental units may be unofficial (ie: basements or laneway houses that are not registered as rental units), there is a fair amount of error and uncertainty in using this data to make generalizations about all of Montreal and Metro Vancouver. The variable being assessed in this analysis, median monthly housing rental cost, was classified using manual breaks. This method of classification was used in order to maintain consistency between class breaks for both Montreal and Metro Vancouver; Metro Vancouver data was used to determine the general class breaks, which were then applied to the Montreal data.
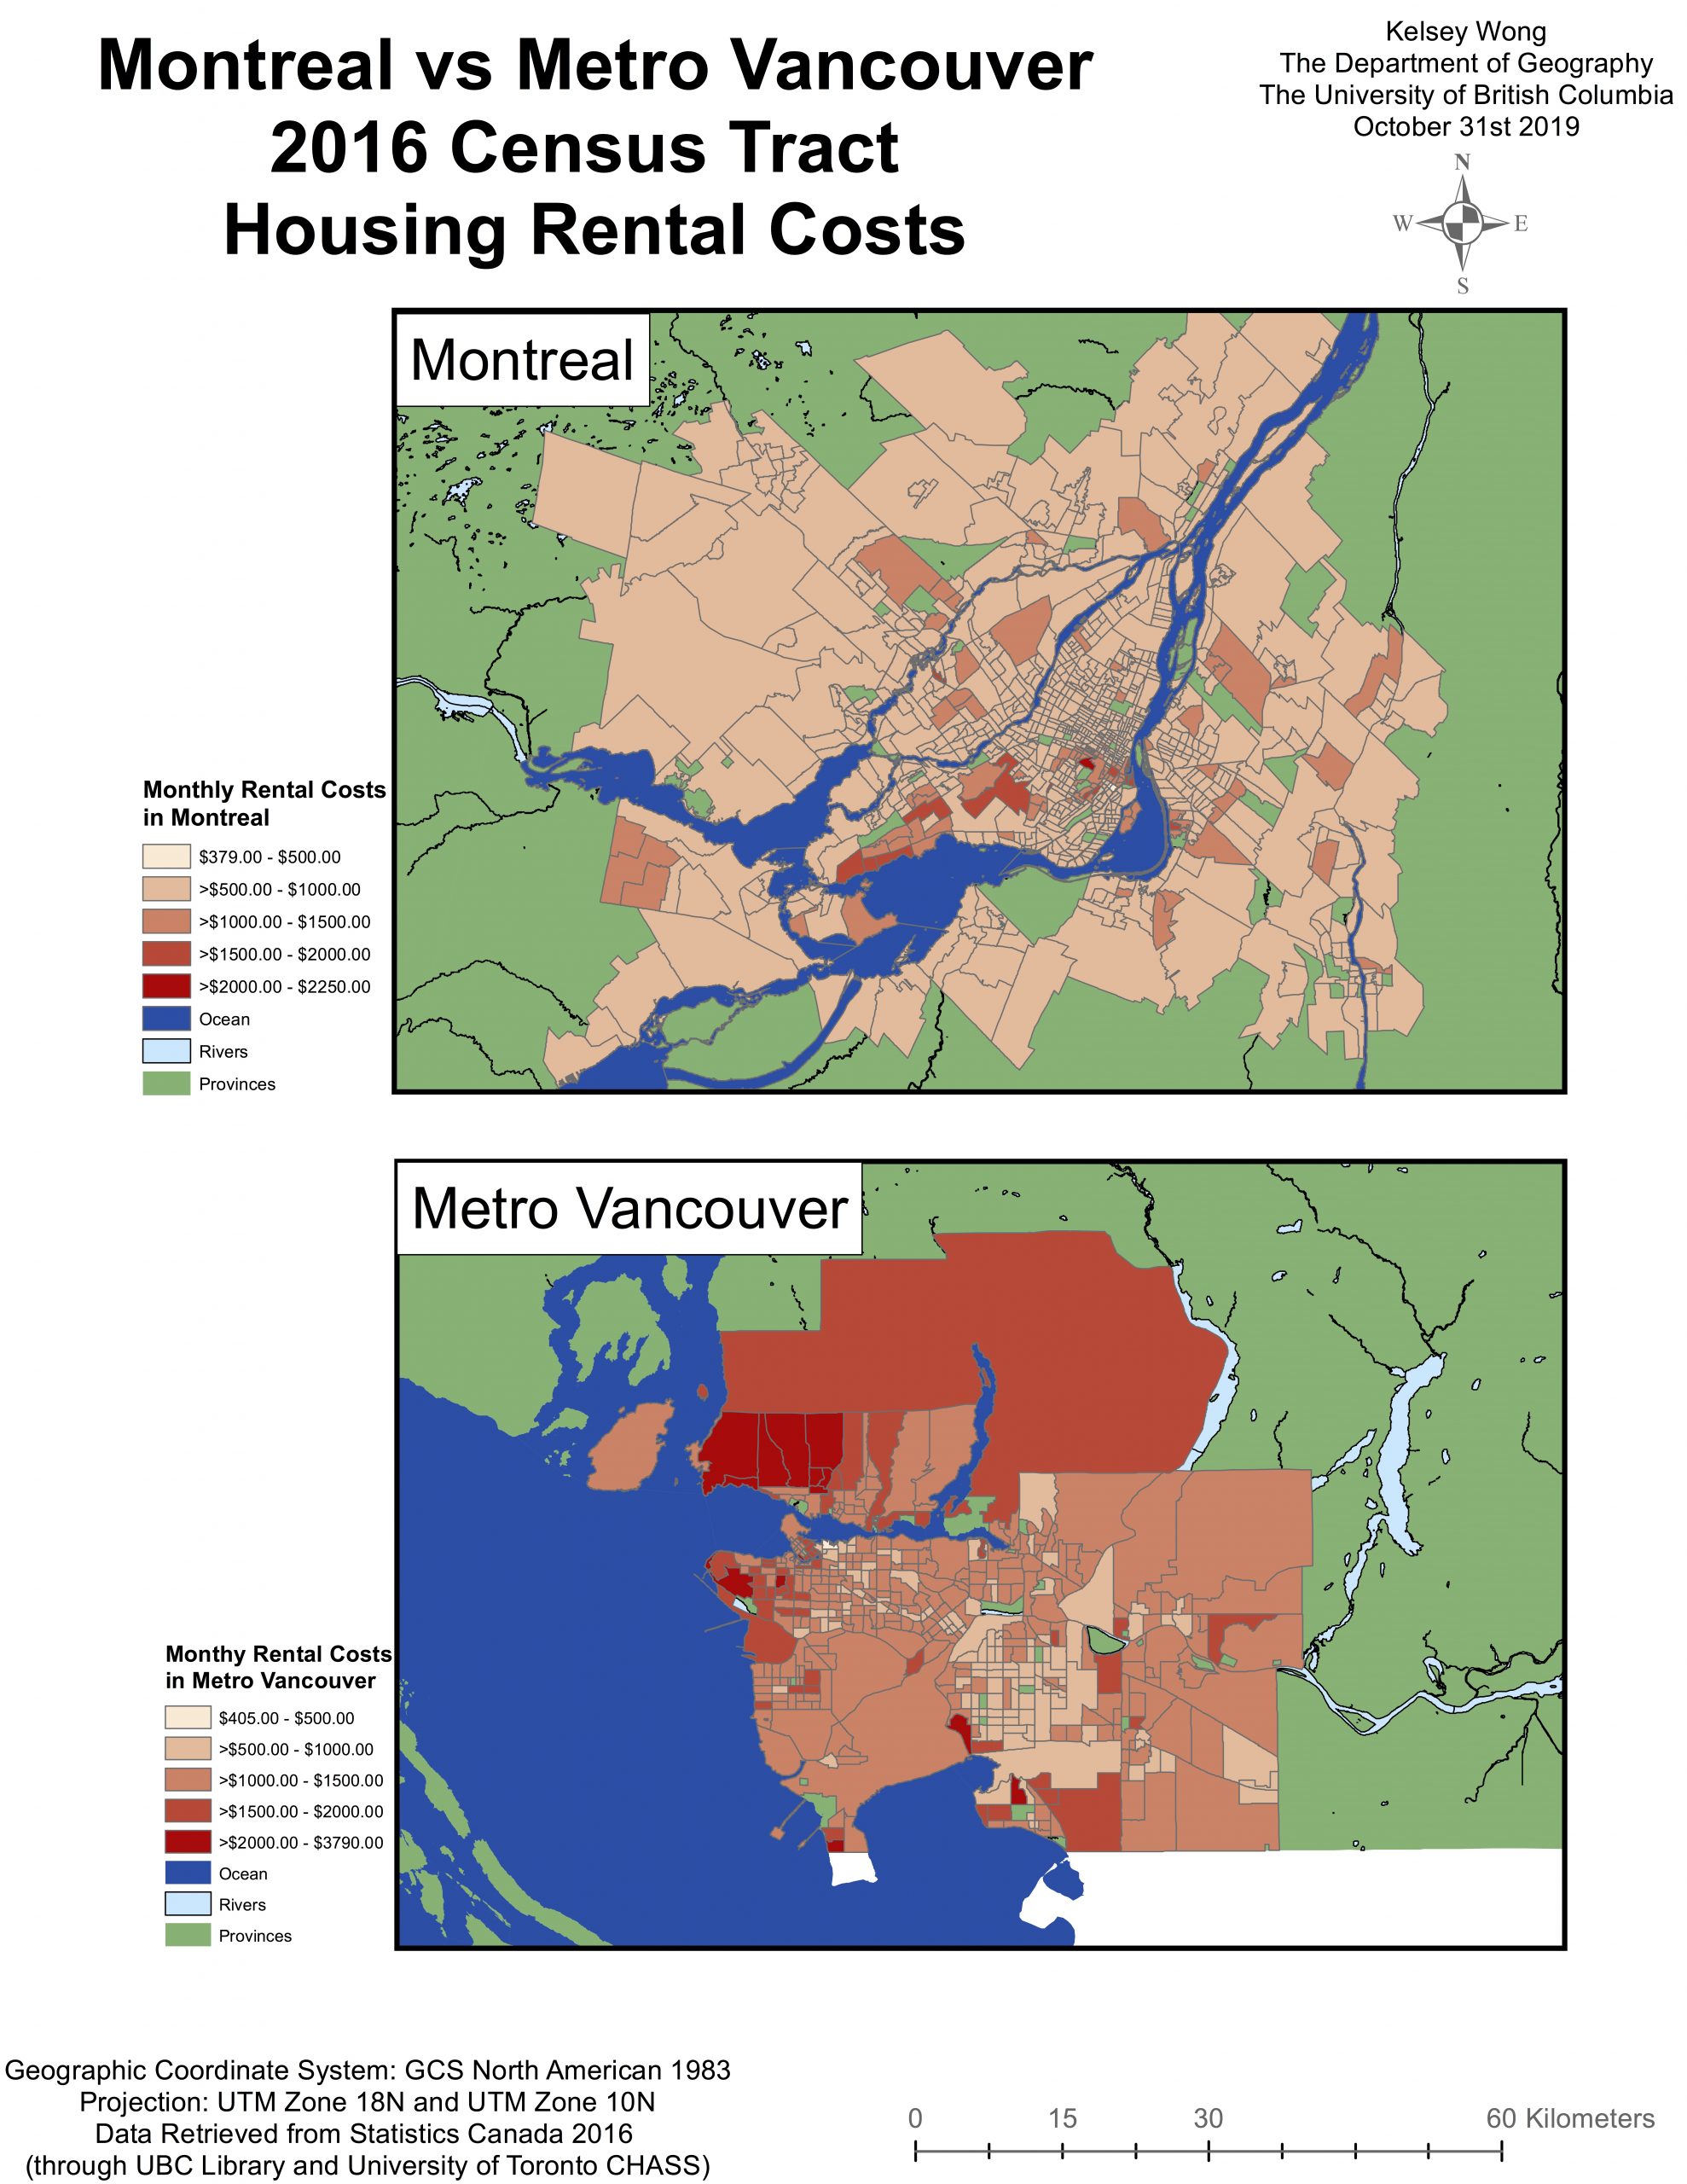
Figure 2. These maps show the median monthly rental costs of housing in Montreal and Metro Vancouver, both of which were classified using manual breaks with data from the 2016 Canadian census. Census tracts that did not have any associated census data for monthly housing rental costs were excluded from this analysis and are shown in white. Oceans, rivers, and provincial and federal boundaries are also shown in these maps.
Affordability of Shelter
The affordability of living in Montreal versus Metro Vancouver was compared by measuring how much people spent on housing rental each month, in comparison to their monthly income, as shown in figure 3. This analysis found that Montreal was generally more affordable than Metro Vancouver, however, the contrast wasn’t as strong as it was in the comparison of rental housing costs in figure 2. According to the Canada Mortgage and Housing Corporation, any household that spends more than 30 percent of their gross income on housing is considered to be unaffordable. The variable used in this analysis to measure the affordability of living was the percentage of people in each of the pre-determined census tracts (CTs) in both Montreal and Metro Vancouver that spend more than 30 percent of their total household income on monthly housing rental costs. This is a better, and more accurate, indicator of shelter affordability than rental cost alone, as in some sectors the average income may vary between cities, but not necessarily linearly with the costs of housing rental. For example, if the income for a certain sector in one city was higher than another city, yet the second city had the same monthly housing rental costs, the first city would be considered more affordable. Affordability is an acceptable basic indicator of a city’s ‘livability’, however, there are many other factors that must also be assessed. The cost of groceries, electricity, natural gas, fuel, transportation, and accessibility to amenities, such as schools, hospitals, and airports are all major factors that can impact the ‘livability’ of a city and must therefore be accounted for when assessing it. CTs that did not obtain the minimum number of responses on this data set were excluded from this analysis.
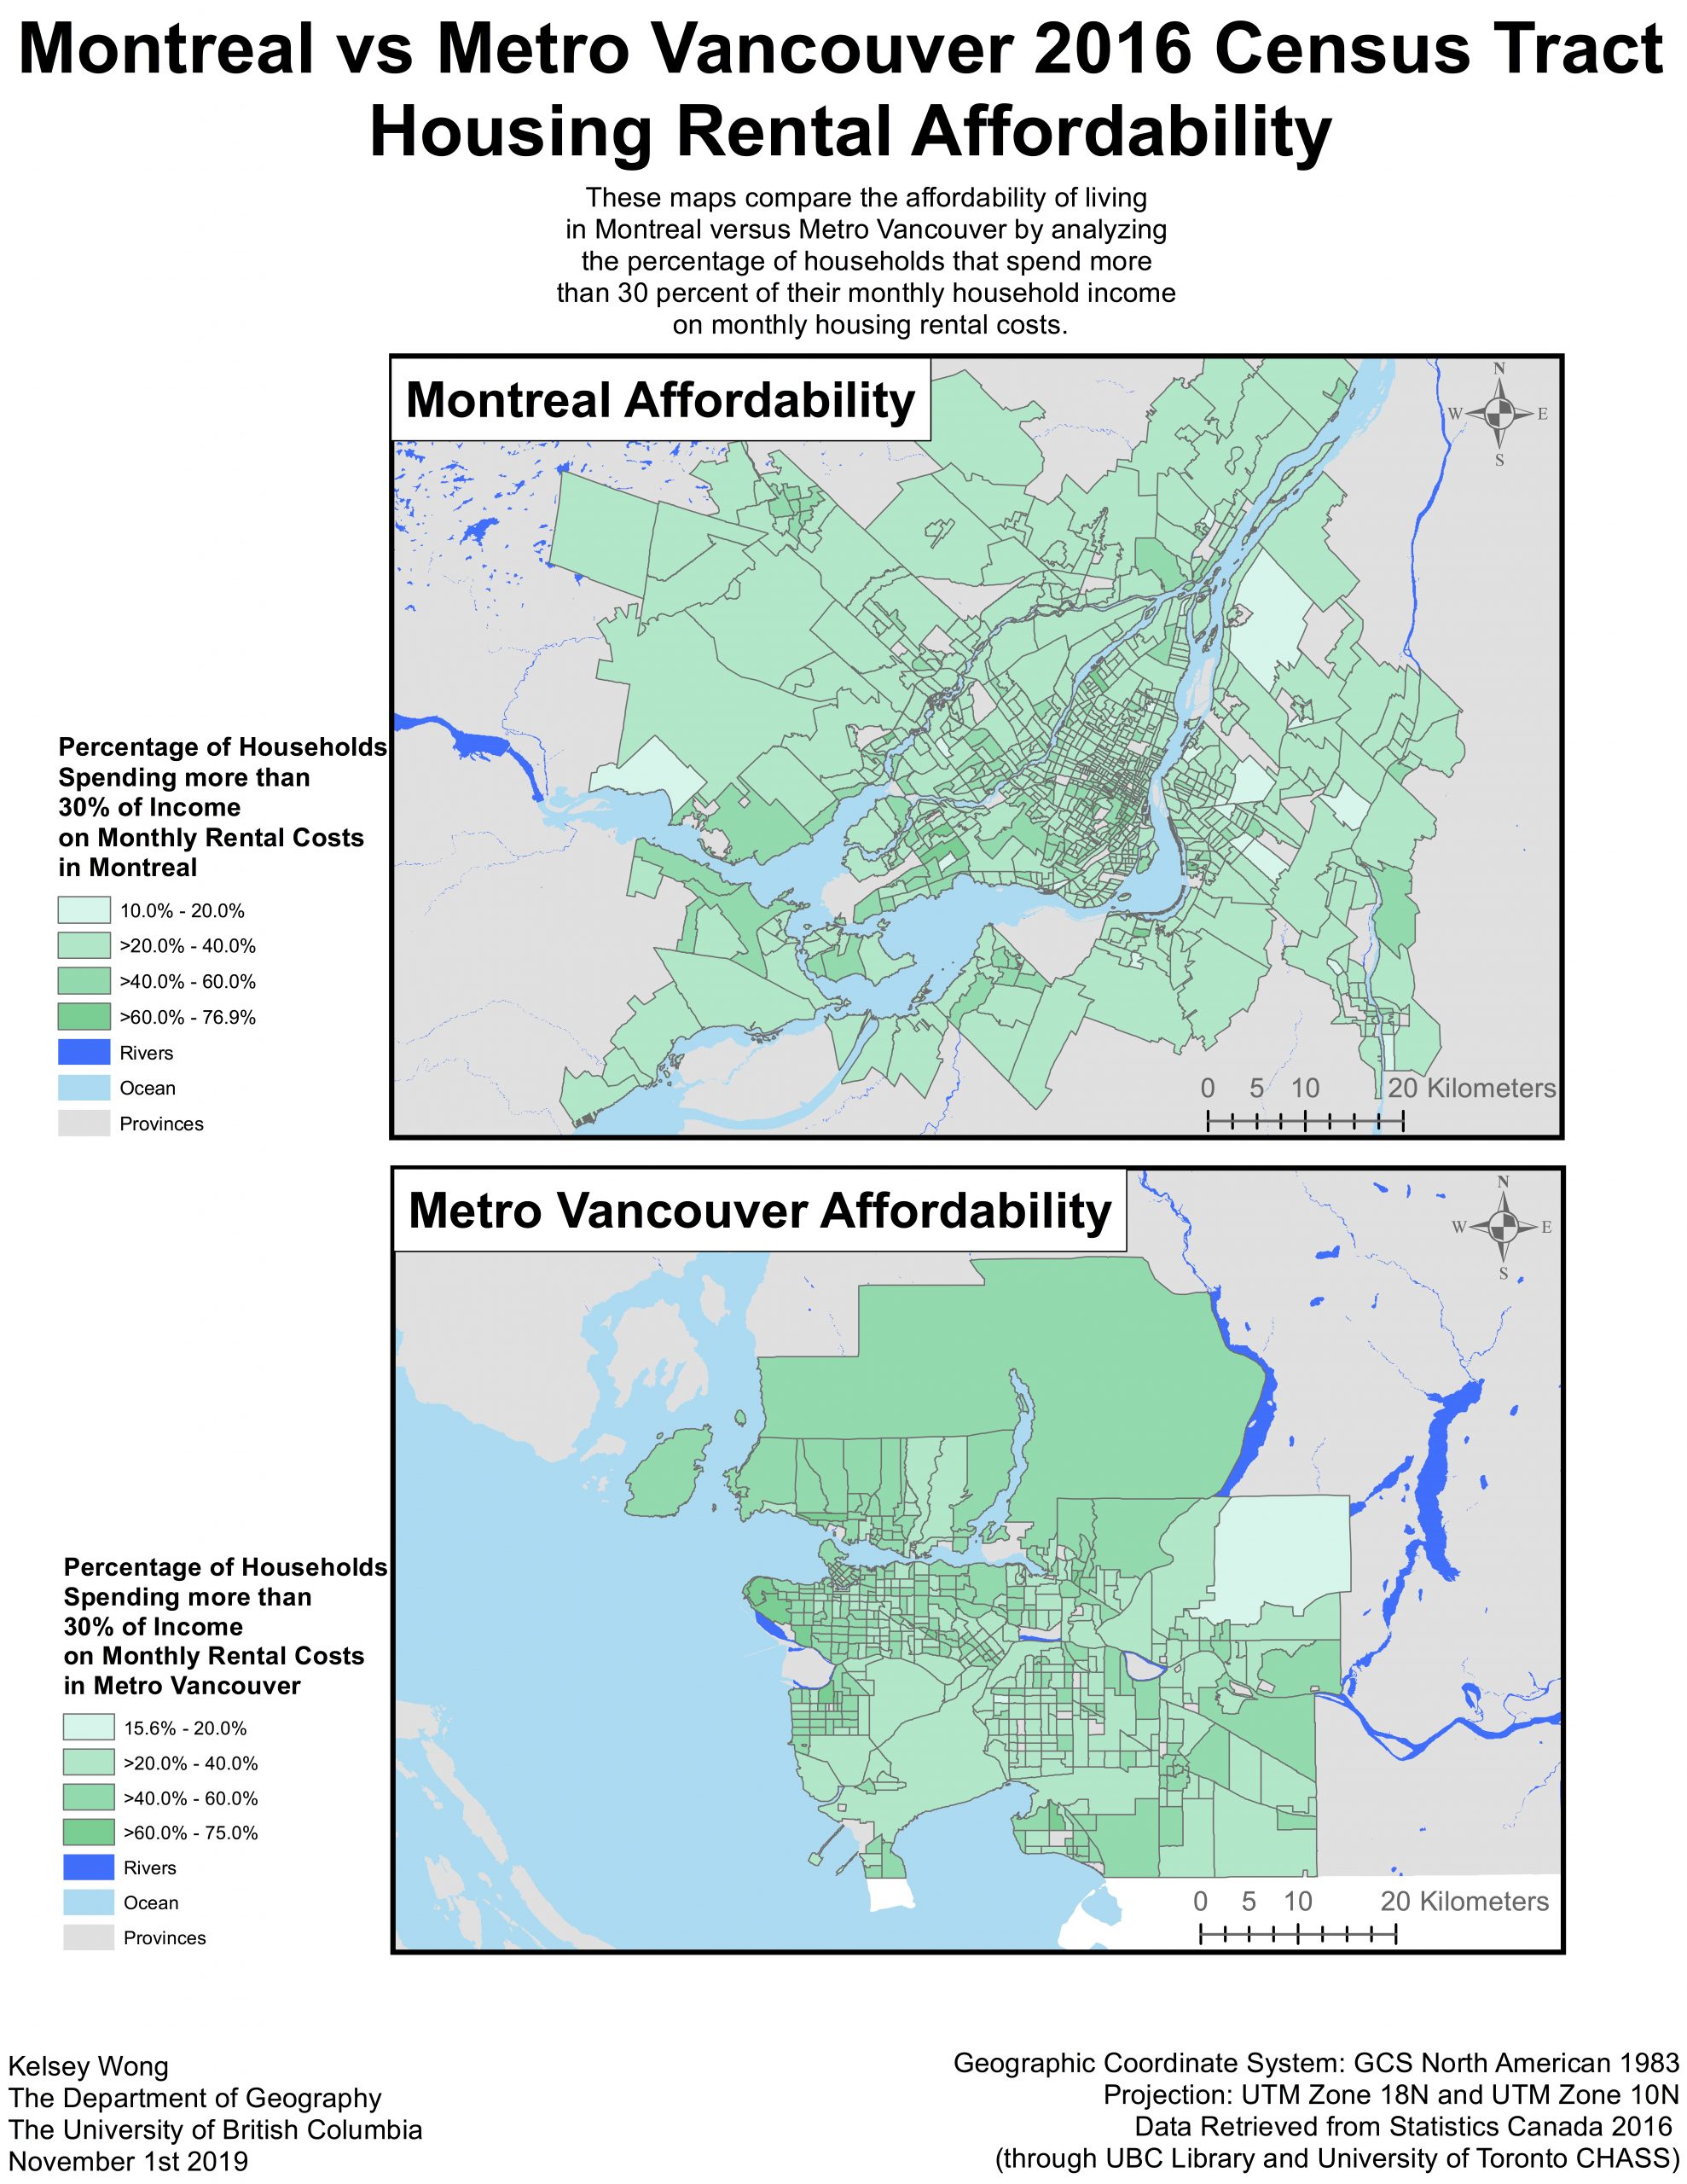
Figure 3. These maps compare the affordability of living in Montreal and Metro Vancouver, by showing the percentage of households in each census tract that spend more than 30% of their total household income on housing rent, based on data from the 2016 Canadian census. Census tracts that did not have any associated census data for monthly housing rental costs and/or total household income were excluded from this analysis and are shown in light grey. Oceans, rivers, and provincial and federal boundaries are also shown in these maps.