
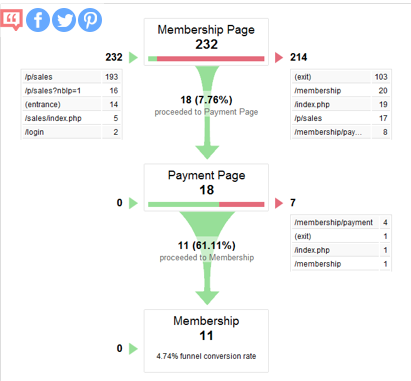
Google Analytics Funnels are shown above. They have several flaws.
Google Analytics allows us to build funnels only with URLs, so it will be challenging for a user wants to track events that do not match with a unique URL.
There are hacks around this with virtual page views in the form of snippets of JavaScript you can add to your site which forces Google Analytics to record a page view at a URL of your site. However, you can only track a series of consecutive steps that people go through all at once. Google Analytics funnels break down if you lack unique URLS to work with and can’t use virtual page views, people leave or bounce around your site between steps. Ultimately, it is challenging to determine when a customer is moving through different steps of the business.
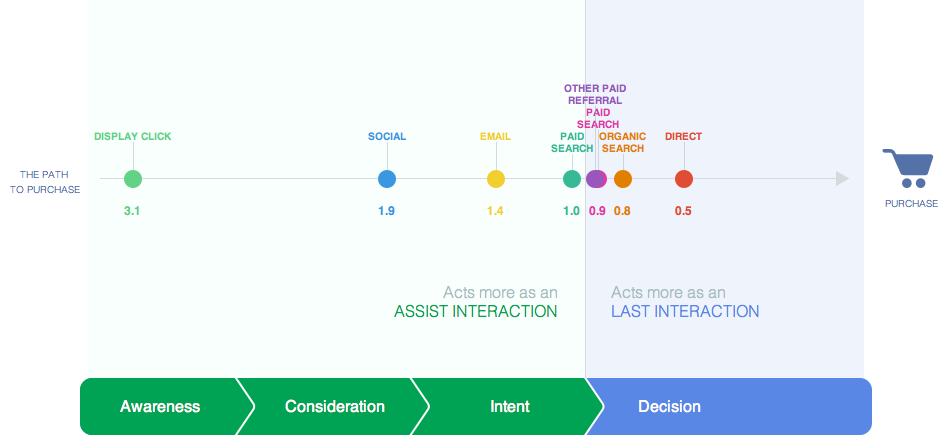
In class, we have been learning about fascinating looped frameworks such as McKinsey’s customer decision journeys and the conversion funnel. In April this year, Google Analytics has added a conversion funnel benchmarking tool which plots the various channels’ impacts on purchase paths by industry.
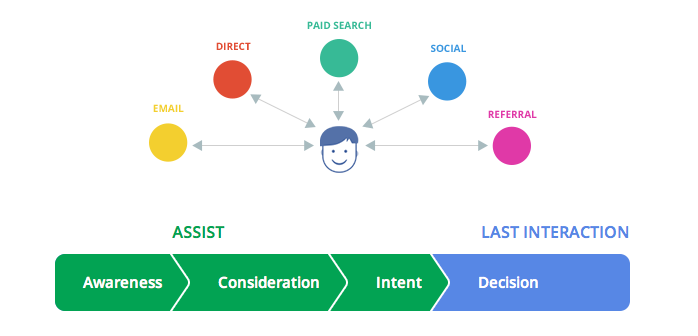
Different marketing channels from Assisting to Last Interaction channels
Under assistance, we comparing the awareness, consideration and intent ratio against the last interaction ratio to determine the channel’s position.
However, as different markets utilize various marketing channels and social media platforms, it will be increasingly challenging for them to figure out which channels to invest in at what point in a customer’s decision journey.
The Customer Journey – Assist or Last Interaction
This channel provides a clear quantifiable spectrum for whether each channel plays more of an “assist” or “last interaction” role. There are also paths for different industries and regions.
Furthermore, there are so many ways to determine how the length of the customer journey (in number of days and number of interactions) differ depending on the kind of purchase.
Below are some of the ways you can do this:
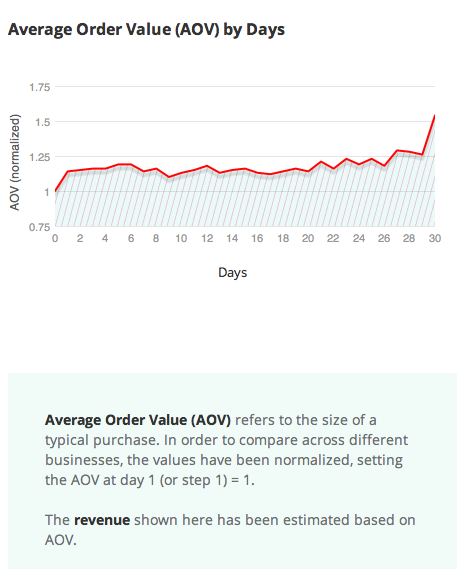
Average order value (size of a typical purchase)
Marketers can observe the typical path to conversation and how that affects the average order value.
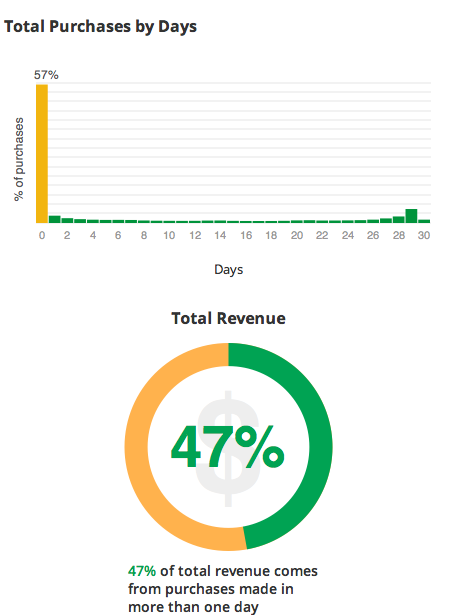
Total Purchases by Days – Total Revenue comes from purchases made in > 1 day
Credits:
http://www.google.com/think/tools/customer-journey-to-online-purchase.html
http://www.adweek.com/news/technology/google-analytics-adds-conversion-funnel-benchmarking-tool-148874
http://blog.kissmetrics.com/use-conversion-funnels/