Ian is a Learning Technology Specialist in UBC’s Faculty of Education, and will talk about the Mattermost tool: what it is, how it works, and whether we can get data out of it that might tell us anything useful about learning or engagement. He writes:
“Mattermost is an open source communication tool that facilitates communication and collaboration in a chat-type environment. You could call it an open source and UBC-hosted Slack alternative. I’ll be going over the pilot so far, how Mattermost was selected, how it is currently being used in Education, followed by a hands-on demonstration and then opening things up for discussion. That discussion might include analytics potential as well as whether it would be useful for the LAVA group to connect between meetings.
A PhD student from the Department of Language and Literacy Education will be joining me, as he’s interested in using Mattermost as part of a study on team collaboration tools for language learning. I’m hoping he will be willing to share a little about his research.”
Ahead of the meeting, Ian would like to encourage people to register for the Mattermost LAVA group. This was created a few months back in conversation with Leah. It’s just an experiment for now but who knows!
In January 2017, the Institute for the Scholarship of Teaching and Learning and the Learning Analytics Visual Analytics group held Hackathon 2.0 at UBC. The two-day event brought together over 80 students, researchers, faculty and staff to explore educational data. Organizers welcomed participants with a range of expertise, and encouraged beginners to sign up to the event.
“My interest in having a hackathon was to bring people together who either want to learn more about doing data analysis, know about data analysis but want to bring into a new context, which is learning analytics, or don’t know anything about either of those things but are generally interested,” said Alison Myers, data analytics specialist at the UBC Sauder School of Business.
This year the hackathon began with a series of workshops on visual analytics, temporal data analysis and statistics using the R software. The idea was to support participants in expanding their knowledge base and making first steps with their analyses.
Hackathon participants were given data from two UBC Massive Open Online Courses: one course focused on Chinese philosophy, the other focused on the science behind climate change. Data included event-trace data, student demographics, discussion-forum posts, attitude surveys, and summative data, enabling a broad range of analytical approaches. Participants formed groups depending on their expertise and interests.
“I have done research on learning data in the past. Patrick is doing computer science so he knows more about coding. And Vesta has experience with visual analytics,” explained Mario Cimet, a student studying Cognitive Systems at UBC, about his team.
The event was an opportunity for like-minded people to meet and share their passion for data analysis. The hackathon was also aimed at raising the profile and visibility of learning analytics. Learning research data can give instructors feedback about their teaching approaches and resources, and how they’re working in their classrooms. It can inform departments about why certain classes are more popular than others and thus support planning at the program level.
“Learning analytics is using evidence about learners to improve the process [of teaching],” said Cimet. “I think it’s important because any decision that you make that is going to deal with their education, you should do it with as much evidence as possible. You should do based on facts.”
Here are three examples of what the participants were able to achieve during the hackathon weekend:
Course tree, where circle size shows either activity level across all learners, time spent per learner, or frequency of this being the last visited page of the course: http://link.landfood.ubc.ca/courseTree/ by Anh Nguyen, Shirley Lin and Justin Lee
Another course tree, where the width of a line represents the movement from node to node, the size of the circle is the number of unique learners, and the colour of a circle shows whether this was a student’s last activity in the course: http://static.useit.today/ubcxhack.html by Patrick Coleman, Mario Cimet and Vesta Sahatciu
Reflections on the hackathon experience by data presenter/scientist/instructor Dr. Megan Barker
I’d been looking forward to the hackathon for a few months, and it completely blew away my expectations! As a data presenter at the hackathon, my role was to share ideas and data from my collaborative project characterizing classroom practices in UBC biology – all in the hopes of tempting data-savvy hackers to play with the data for the weekend. In my research project team, we currently have pedagogical expertise but are sorely lacking skills in visual and data analysis. This hackathon was a perfect opportunity for us to share the dataset with analysts and students looking for real educational data to work with. The event was a smash success: we built teams, worked on real projects together, and had tangible successes by the end.
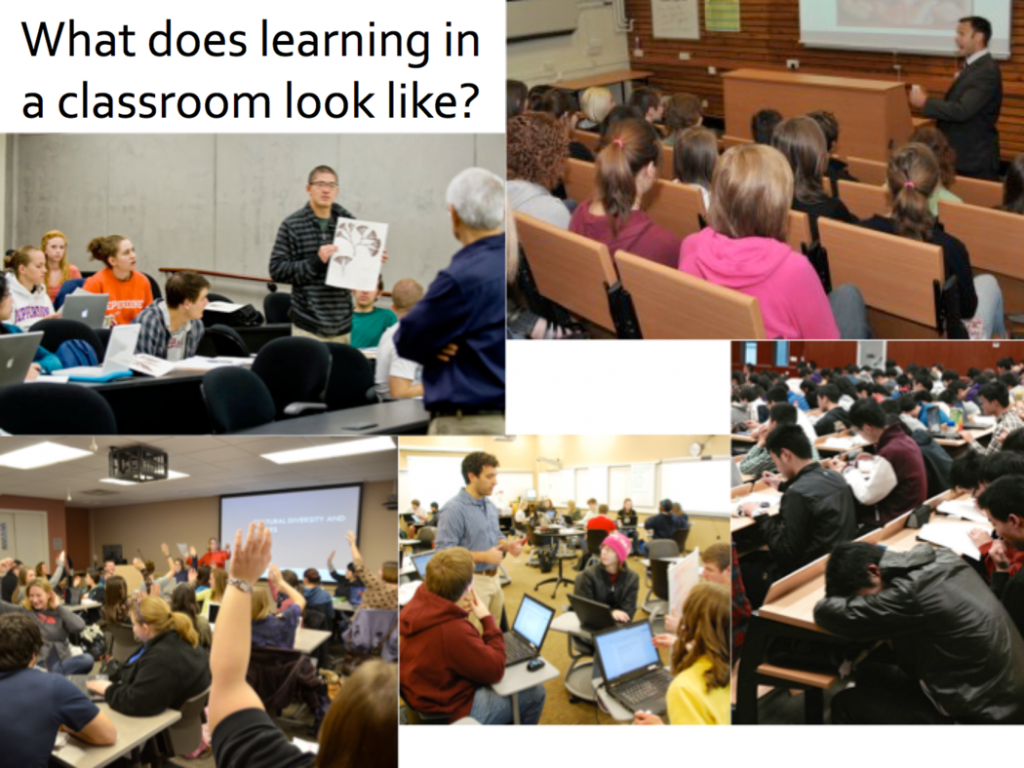
In our research, my colleagues and I ask the basic question:
We approach this by observing and collecting data from many classes in our department…..Read the full article.
Meetings have moved to a new time (every other Monday, 3pm) this term.
Note temporary different meeting space on Feb 1st: DL-011 (the boardroom in the Sauder building where we have met in previous terms)
This first meeting will be a planning and brainstorming session. Pleasesend Alison 2-3 slides that a) introduce yourself and your work and b) propose a presentation/demo/workshop/paper/talk that you would be willing to give to the group. We will then spend time on the 1st by going through the slides and creating a schedule for the coming meetings.
If you can’t make the meeting, please still send the slides along with a little blurb and I will share with the group.
Work in Progress: Development of an app to visualize a learner’s own learning data
In this session, final year COGS student Valerie Wyns will give a ‘work in progress’ presentation on her project to develop an app, ‘modusloci’, that will allow learners to visually analyze their own ‘learning data’ (e.g. school notes). This development project builds on the hypothesis that if learners can visually make the connections between sources, subjects, topics (particular->general) it will offer them a new perspective on the meta-system in which their knowledge resides, and allow them to understand what they need to understand in a deeper way. Valerie will offer more details of the logic of her project and will explain her plan to visualize both a data map of a learner’s input data, and patterns of the learner’s habits. In particular, she will concentrate on the data mapping function, asking: What aspects of data are salient in a meta-system way? How can she create a platform that is playful, fun, and ultimately useful to the end user?
Visiting scholar and HCI pioneer Dr. Ben Shneiderman will lead an informal workshop meant to teach use of EventFlow software – a tool developed by his team for temporal sequence analysis and visualization. Bring your laptop and your data!
ABSTRACT Event Analytics is rapidly emerging as a new topic to extract insights from the growing set of temporal event sequences that come from medical histories, e-commerce patterns, social media log analysis, cybersecurity threats, sensor nets, online education, sports, etc. Our current work on EventFlow (www.cs.umd.edu/hcil/eventflow) supports analysis of point events (such as heart attacks or vaccinations) and interval events (such as medication episodes or long hospitalizations). In this hands-on session, Dr. Shneiderman will show how domain-specific knowledge and problem-specific insights can lead to sharpening the analytic focus so as to enable more successful pattern and anomaly detection.
BEN SHNEIDERMAN (http://www.cs.umd.edu/~ben) is a Distinguished University Professor in the Department of Computer Science and Founding Director (1983-2000) of the Human-Computer Interaction Laboratory (http://www.cs.umd.edu/hcil/) at the University of Maryland. He is a Fellow of the AAAS, ACM, and IEEE, and a Member of the National Academy of Engineering, in recognition of his pioneering contributions to human-computer interaction and information visualization. His contributions include the direct manipulation concept, clickable web-link, touchscreen keyboards, dynamic query sliders for Spotfire, development of treemaps, innovative network visualization strategies for NodeXL, and temporal event sequence analysis for electronic health records.
Ben is the co-author with Catherine Plaisant of Designing the User Interface: Strategies for Effective Human-Computer Interaction (5th ed., 2010) http://www.awl.com/DTUI/. With Stu Card and Jock Mackinlay, he co-authored Readings in Information Visualization: Using Vision to Think (1999). His book Leonardo’s Laptop appeared in October 2002 (MIT Press) and won the IEEE book award for Distinguished Literary Contribution. His latest book, with Derek Hansen and Marc Smith, is Analyzing Social Media Networks with NodeXL (www.codeplex.com/nodexl, 2010).
Changing Students Learning Behaviour via Learning Analytics
Abstract: Three main audiences for learning analytics are institutions, instructors & course designers, and students. Our focus is on students. We take a stance that a goal of learning analytics for students should be not only to inform them about their performance, but rather clearly influence learners to modify their learning behaviour and lead to better learning outcomes. As learning sciences show, students’ learning is heavily influenced by their individual differences. Our research aims at developing understanding of how information presented in and a form of Learning Analytics visualizations affects individual students. In this talk I will elaborate on these theoretical concepts and present results of our study showing varying effect of Learning Analytics visualizations on students with different goals. Our findings highlight the methodological importance of considering individual differences and pose important implications for future design and research of learning analytics visualizations.
Dr. Marek Hatala is a Professor at the School Interactive Arts and Technology at Simon Fraser University and a Director of the Laboratory for Ontological Research. He received his PhD in Artificial Intelligence from the Technical University in Kosice (Slovakia). His research is driven by the problems arising between the computing systems and their users. The areas of his prior interests include configuration engineering design, organizational learning, semantic interoperability, ontologies and semantic web, user modeling in ubiquitous and ambient intelligence environments, and software engineering and service oriented architectures. Dr. Hatala’s current research is framed within the area of Learning Analytics. Specifically, he builds on the learning sciences to establishing the theories of effects of open learner models on learner’s motivation with the goal to improve their learning outcomes in the online learning environments.
In October 2015 the Learning Analytics Visual Analytics (LAVA) group held the first ever learning analytics hackathon at UBC. During the two-day event, more than 70 participants with a wide range of backgrounds and expertise applied a variety of approaches to analyzing learning-related data. Some used classroom observation data to better understand how learning unfolds, while others used data from a learning management system to identify patterns in how learners use available materials.
According to Leah Macfadyen, program director of Evaluation and Learning Analytics at the Faculty of Arts, the idea for the hackathon came about in one of the group’s weekly meetings, after a member brought in a large data set and asked for help. The group had a lot of fun tossing around ideas about how to analyze the data and how to best present the results. The outcome was so successful that the group wondered, “Why not make it bigger? Why not have a hackathon?”
Macfadyen and other event organizers were pleasantly surprised with the large turnout. “People are interested in doing this?” asked Megan Barker, a Science Teaching and Learning Post-Doctoral Fellow with the Carl Wieman Science Education Initiative and data presenter at the hackathon. “We had no idea. We thought maybe a couple of people would find this interesting. Then all of the sudden our registration was full and we had people on the waitlist.”
The event began with five researchers from across UBC pitching learning data sets to participants. Each data set captured a different aspect of learning, for example, student interactions with video content and moment-by-moment actions in a virtual physics lab. Data presenters then challenged participants to find the story behind the data.
The hackathon attracted undergraduate and graduate students as well as faculty, staff and professionals. Participants formed groups depending on which of the five data sets they chose to work on as well as their disciplinary area of expertise and preferred analytics approach. “We wanted to bring together people who were interested in working with data. If they didn’t have the same background it’d be even better. They could learn from each other,” said Macfadyen.
“The hackathon was really useful to keep myself sharp and experience different data sets,” said Tyler Robb-Smith (right), one of the event’s participants.
Tyler Robb-Smith is a student at the British Columbia Institute of Technology and has a background in Nanohydrodynamics. He came to the event to meet people and build on his data analysis skills. “It’s interesting looking at different perspectives. It’s interesting how everyone has an area of expertise, and added together it made [the process] quite easy,” he said. “You are able to go a lot further in a project that individually would take you a lot longer.”
The event was an opportunity for like-minded people to meet and share their passion for data analysis as well as learn about LAVA. The group started with Macfadyen and a few students who were interested in working with learning research data, but it quickly grew. It wasn’t long before other faculty and staff started asking to join the weekly meetings.
“A lot of people didn’t know then and still don’t know that this type of research actually exists at UBC. Learning analytics is a new field,” said Macfadyen. According to her, the university already has a lot of learning and teaching data available, for example, from student registration systems and course evaluation systems. “These goldmines of potential insight are just sitting around and they could and should be used to inform decisions about planning throughout departments,” she added.
That’s why the event was also aimed at raising the profile and visibility of this emerging field and showing what can come out of this type of analysis. Learning research data can tell instructors about what the most effective teaching methods are and how they’re working in their classrooms. It can inform departments about why certain classes are more popular than others. It can help instructors plan for courses.
“We really wanted to raise awareness about how data can be used to improve teaching and learning practices,” said Ido Roll, senior manager for Research and Evaluation in the Centre for Teaching, Learning, and Technology and one of the event’s organizers. “The hackathon was a great way to combine interesting questions about how people learn, large data sets and a group of eager and motivated experts.”
This year’s event was a success. At the end of the hackathon nine participant-led groups presented their research findings. Several of these projects have become full-scale research projects following the event. According to Roll and Macfadyen, the most common question from participants was how soon would there be another hackathon.
An NLP-informed learning analytics approach for extracting and measuring aspects of argumentation
Venue: Buchanan C105C
Abstract
This paper/presentation reports on a work-in-progress and shares preliminary results for an attempt to use NLP-informed learning analytics methods to extract and measure aspects of students’ argumentation while they learn how to think and argue like scientists. The approach explored in this paper caters to aspects of deep learning and detects the flow of the argumentation directly from the structure and the composition of the language that the students use in their writings. The model integrates insights from natural language processing techniques and argumentation theory in such a way that derives the metalinguistic features of argumentation directly from the linguistic units produced in students’ written language.
Hackathon participants, please share your files with us! :
– Manipulated data
– Presentation
– Results (including failed results)
– …
Please include a readme.txt file with the following information:
– Names of group members
– Names and descriptions of the included files
– A short description of the process – what was your approach and what have you found (or did not find)? (do not spend much time on this)
Please create a zip file with the readme.txt file and the original files, and upload it at dropitto.me/lava-hackathon.