by MICHAEL PIDWIRNY
Introduction
During the winter months of December, January, and February, the climate of the northwest USA and southern British Columbia is defined by cooling temperatures and an increase in precipitation. Temperatures cool mainly because of the reduction in heat energy supplied by the Sun. During these months, the intensity of the solar radiant energy declines because of lower Sun angles and a shortening of day length. Figure 1 describes the average near-surface temperature (2 meters above ground level) for the winter season. Temperatures along the west coast are moderated by the stored heat energy found in the surface waters of the Pacific Ocean.
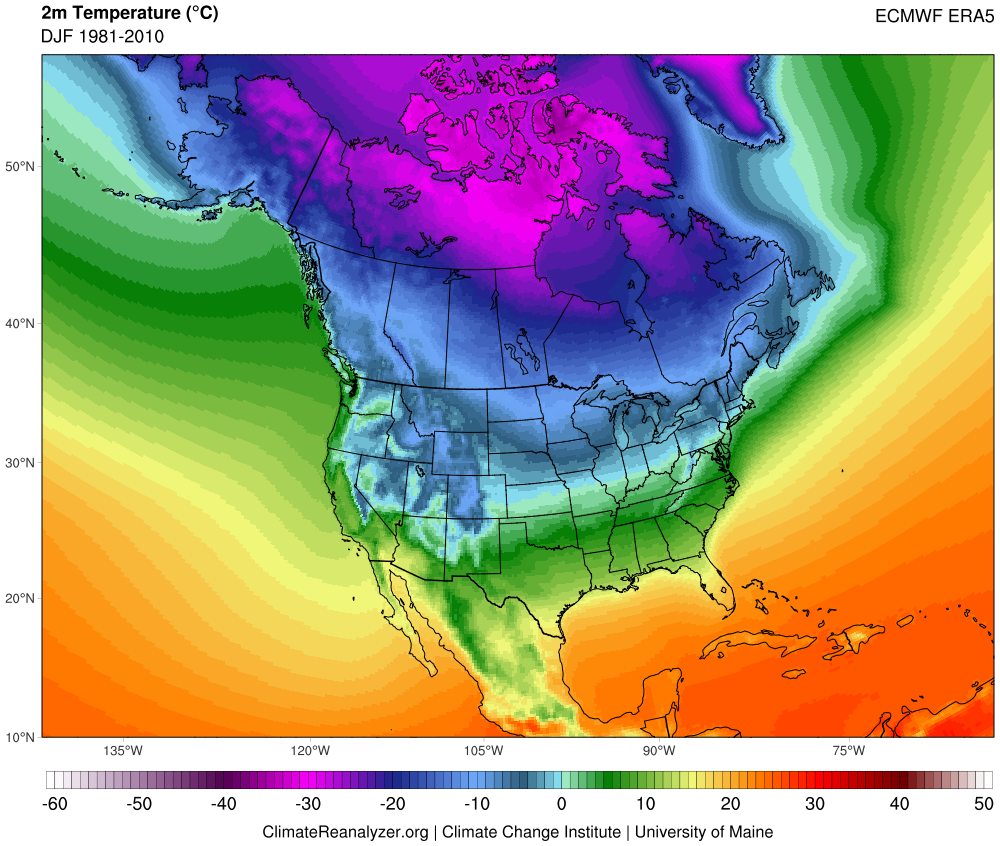
Figure 1. Average winter near-surface mean temperature (°C) for the North American continent and adjacent oceans for the period 1981-2010. Source: Climate Reanalyzer – https://climatereanalyzer.org.
Figure 2 describes the typical patterns of winter precipitation for North America. High amounts of precipitation occur along much of the west coast because of the interaction between mid-latitude cyclones and orographic uplift. During winter, mid-latitude cyclones often originate in the northeastern Pacific Ocean and then move in an easterly direction. Orographic enhancement of the quantity of precipitation falling from these storm systems occurs because of the presence of mountains found running from Alaska to California. Central North America is relatively dry compared to the west coast because most of the precipitable water held in the clouds of the mid-latitude cyclones previously precipitated out and the cold continental air masses frequently found here hold little moisture.
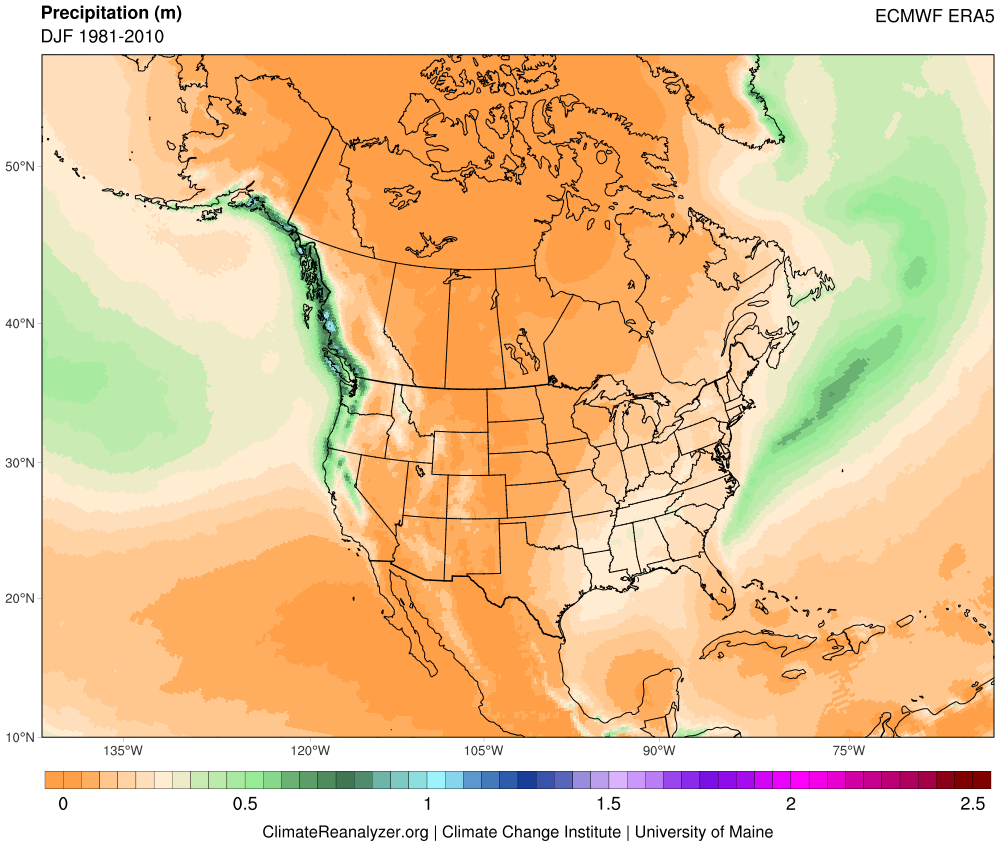
Figure 2. Average winter precipitation over the North American continent and the adjacent oceans for the period 1981-2010. Source: Climate Reanalyzer – https://climatereanalyzer.org.
Variation in year-to-year winter weather of the northwest USA and southern British Columbia is strongly influenced by several large-scale cyclic climate phenomena which modify large-scale atmospheric circulation and sea surface temperatures in the Pacific Ocean. Further, these climate factors tend to have a significant impact on temperature and precipitation trends during the winter months over southern British Columbia and Washington state. Seesawing on a time scale of a few years are El Niño and La Niña events located along teh tropical Pacific Ocean. El Niño – usually brings warmer than average winters and below-average precipitation to this area of the Pacific Northwest. La Niña – is often associated with cold winters with average to above-normal precipitation. Generally, the effects of significant El Niño and La Niña are limited to one or maybe two consecutive winter seasons. Operating on a much longer timescale of one to three decades is another cyclic climate factor of importance known as the Pacific Decadal Oscillation. The Pacific Decadal Oscillation alternates between a warm or a cold state and these states seem to amplify the climatic effects of co-occurring El Niño and La Niña events, respectively.
El Niño
El Niño is the name given to the cyclical development of warm ocean surface waters on the east side of the Pacific Ocean at the equator. This climate event usually occurs around Christmas and usually lasts for a few weeks (weak) to a few months (strong). El Niño is created by a reduction in the speed of the Trade Winds right along the equator which results in a shift in atmospheric circulation and pressure patterns in this region of the planet (Figure 3). Sometimes an extremely warm El Niño can develop and last for more than a year. Since 1935, significant El Niño events have developed in 1958, 1966, 1978, 1983, 1987, 1990, 1992, 1993, 1998, 2005, 2010, and 2016. Figure 4 shows the general global patterns of winter surface temperature warming and cooling associated with El Niño.
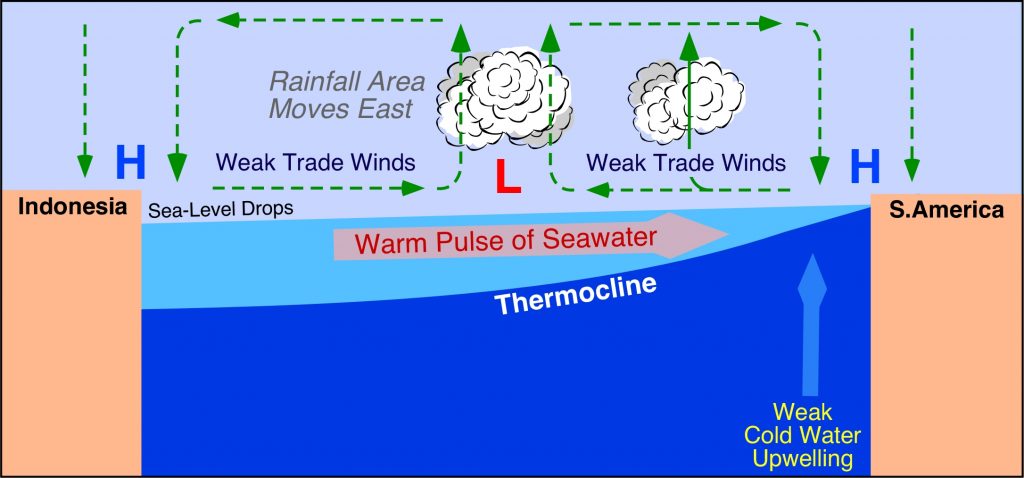
Figure 3. Cross-section along the Pacific Ocean at the equator during an El Niño event. Notice associated atmospheric circulation patterns and direction of warm seawater pulse in the ocean.
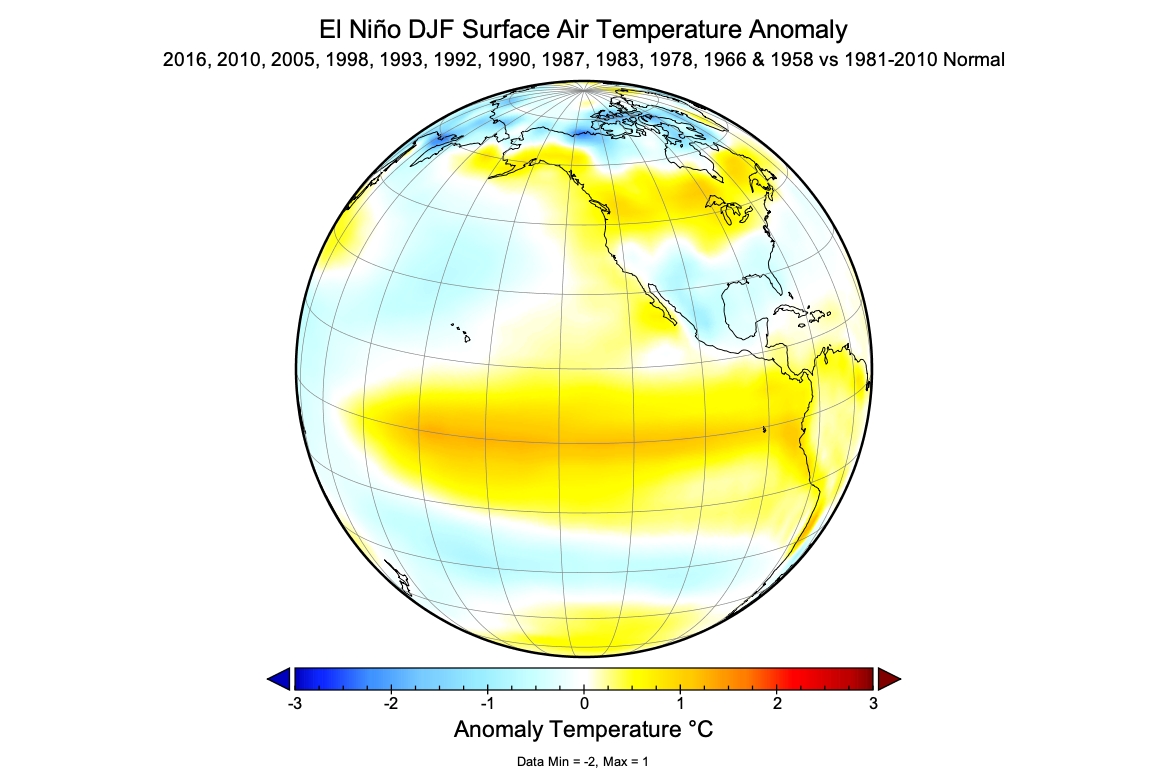
Figure 4. December to February near-surface temperature anomaly based on the average of twelve El Niño years relative to the 1981-2010 normal average.
La Niña
La Niña is the name given to the cyclical development of cold ocean surface waters on the east side of the Pacific Ocean at the equator. Similar to El Niño, a La Niña climate event usually occurs around Christmas and normally lasts for a few weeks (weak) to a few months (strong). La Niña is created by an increase in the speed of the Trade Winds along the equator which results in a shift in atmospheric circulation and pressure patterns in this region of the planet (Figure 5). Sometimes an extremely cold La Niña can develop and last for more than a year. Since 1935, significant La Niñas have occurred in 1950, 1956, 1967, 1971, 1974, 1976, 1999, 2008, 2011, and 2021. Figure 6 shows the general global patterns of winter surface temperature cooling and warming associated with La Niña.
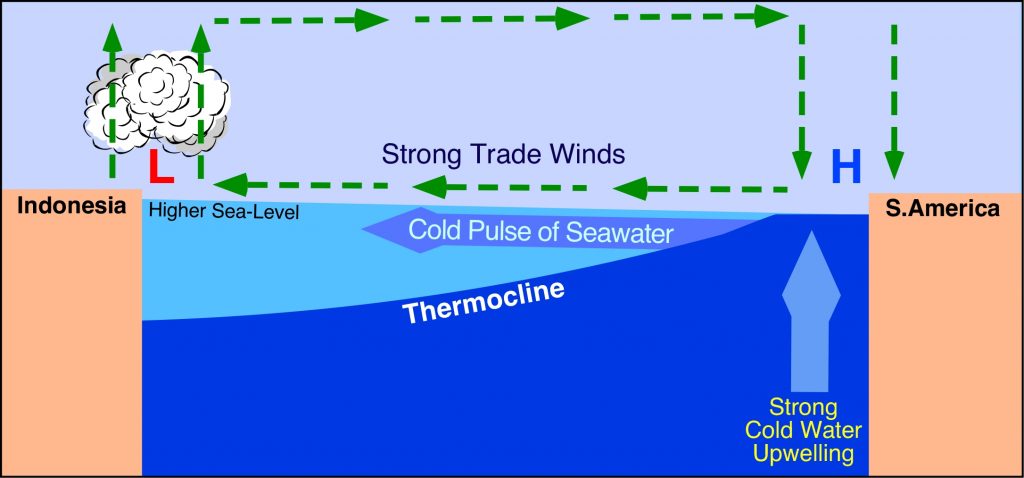
Figure 5. Cross-section along the Pacific Ocean at the equator during a La Niña event. Notice associated atmospheric circulation patterns and direction of cold seawater pulse in the ocean.
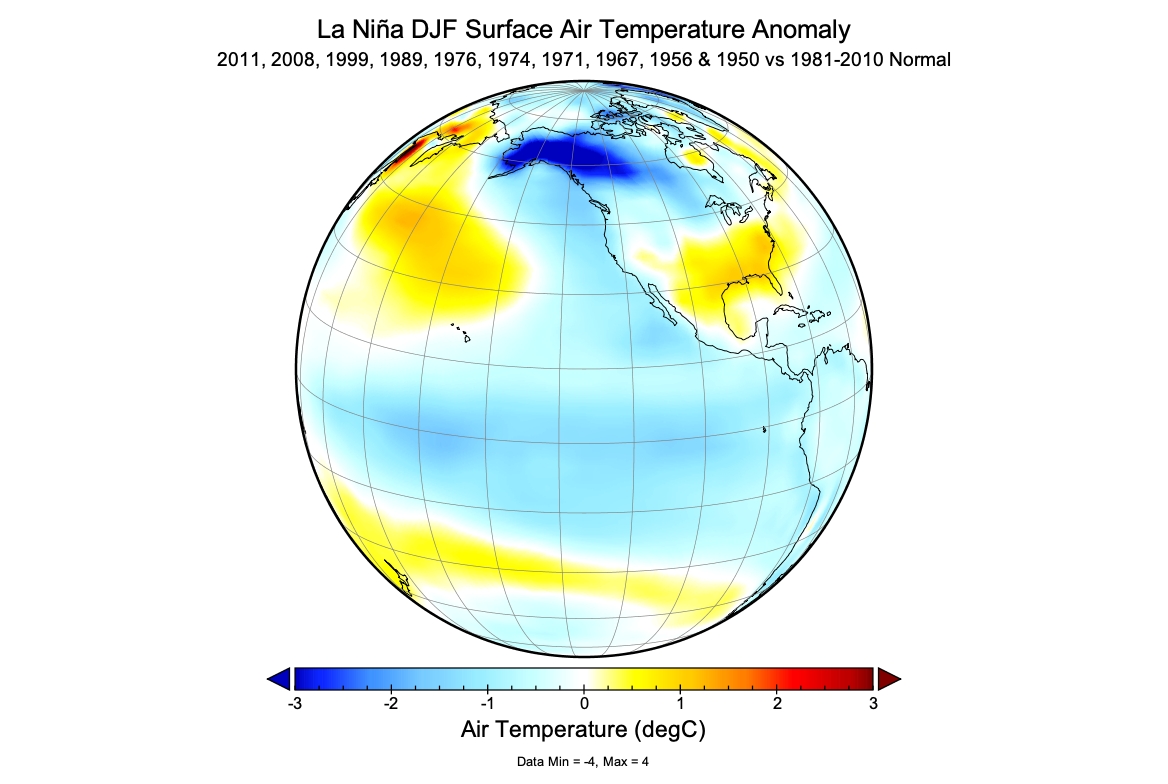
Figure 6. December to February near-surface temperature anomaly based on the average of ten La Niña years relative to the 1981-2010 normal average.
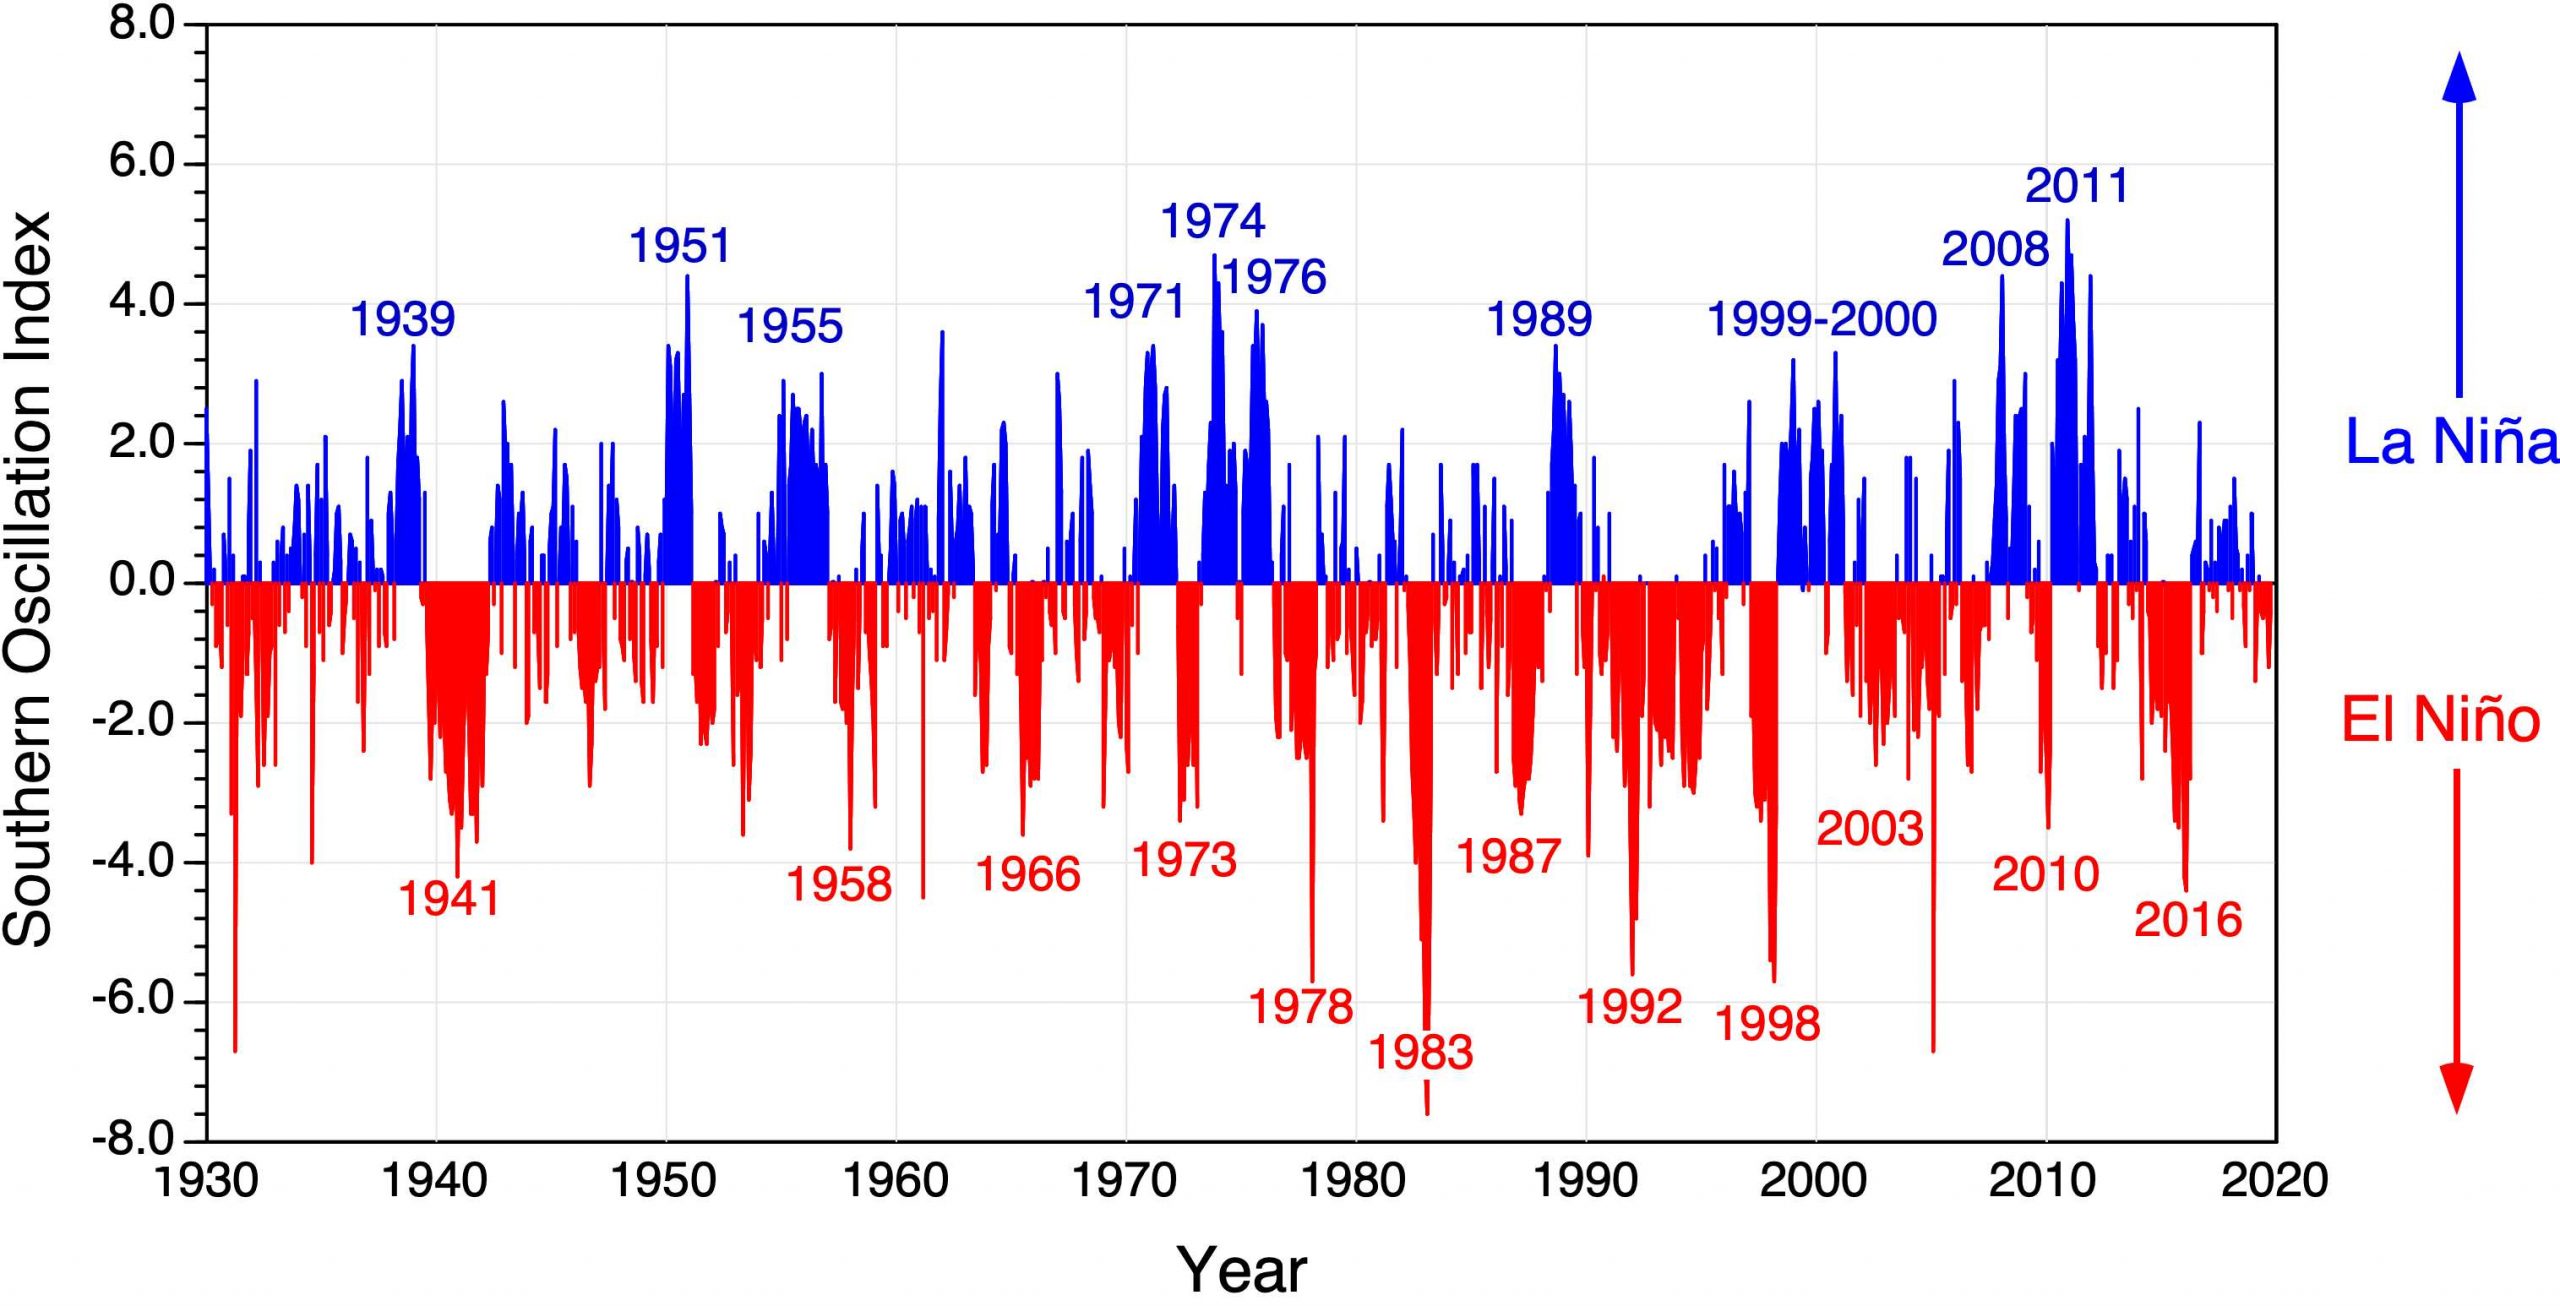
Figure 7 shows the relative strength of El Niño and La Niña events from 1930 to 2021 according to the Southern Oscillation Index (SOI). On this figure, negative values indicate El Niño conditions with lower values suggesting stronger events. High positive values indicate significant La Niña events.
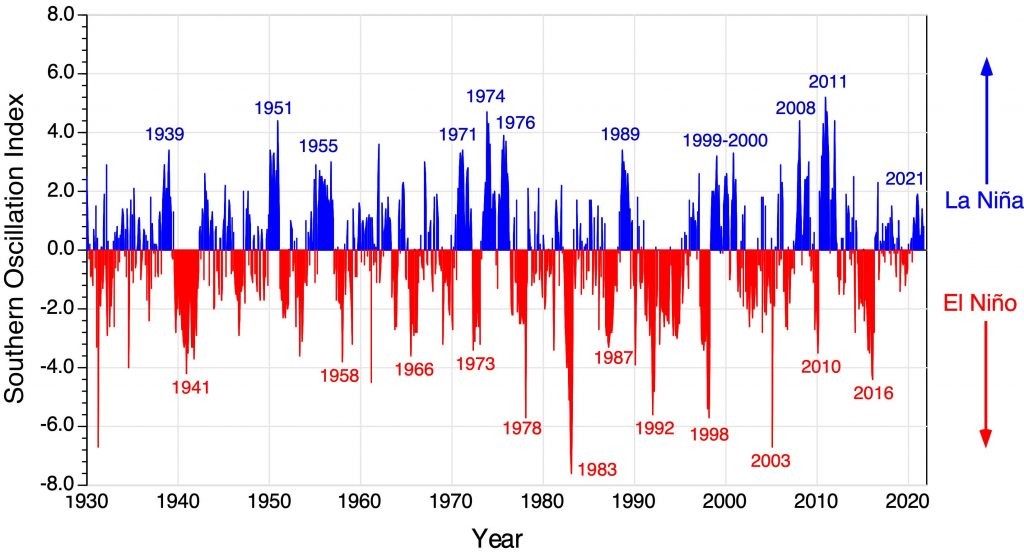
Figure 7. Relative strength El Niño and La Niña events from January 1930 to September 2021. Red indicates El Niño event while blue identifies La Niña event.
The Pacific Decadal Oscillation
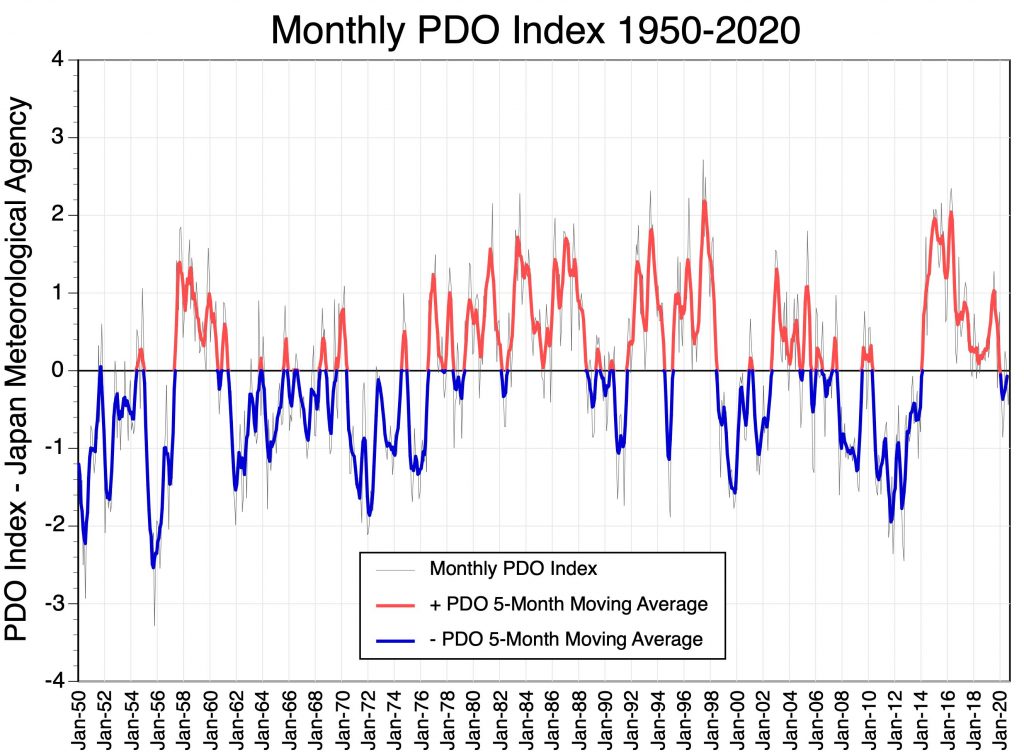
The Pacific Decadal Oscillation (PDO) is a cyclical pattern of ocean-atmosphere climate variability that occurs in the North Pacific Ocean. The PDO is detected as a change in sea surface temperatures over the Pacific Ocean from 20 to 60° North latitude. There are two phases that can last many years to several decades as shown in Figure 8. During the warm or positive phase, sea surface temperatures in the western North Pacific Ocean become cooler, while the eastern side of this ocean warms (Figure 9). The warm phase results in a zone of warm seawater hugging the west coast of North America from Alaska down to the Baja Peninsula. During the cold or negative phase, sea surface temperatures in the western North Pacific Ocean becomes warmer, while the eastern part of this ocean cools down (Figure 10). Significant reversals in the prevailing phase of the PDO have occurred around 1957, 1961, 1977, 1998, 2014, and 2020 (Figure 8).
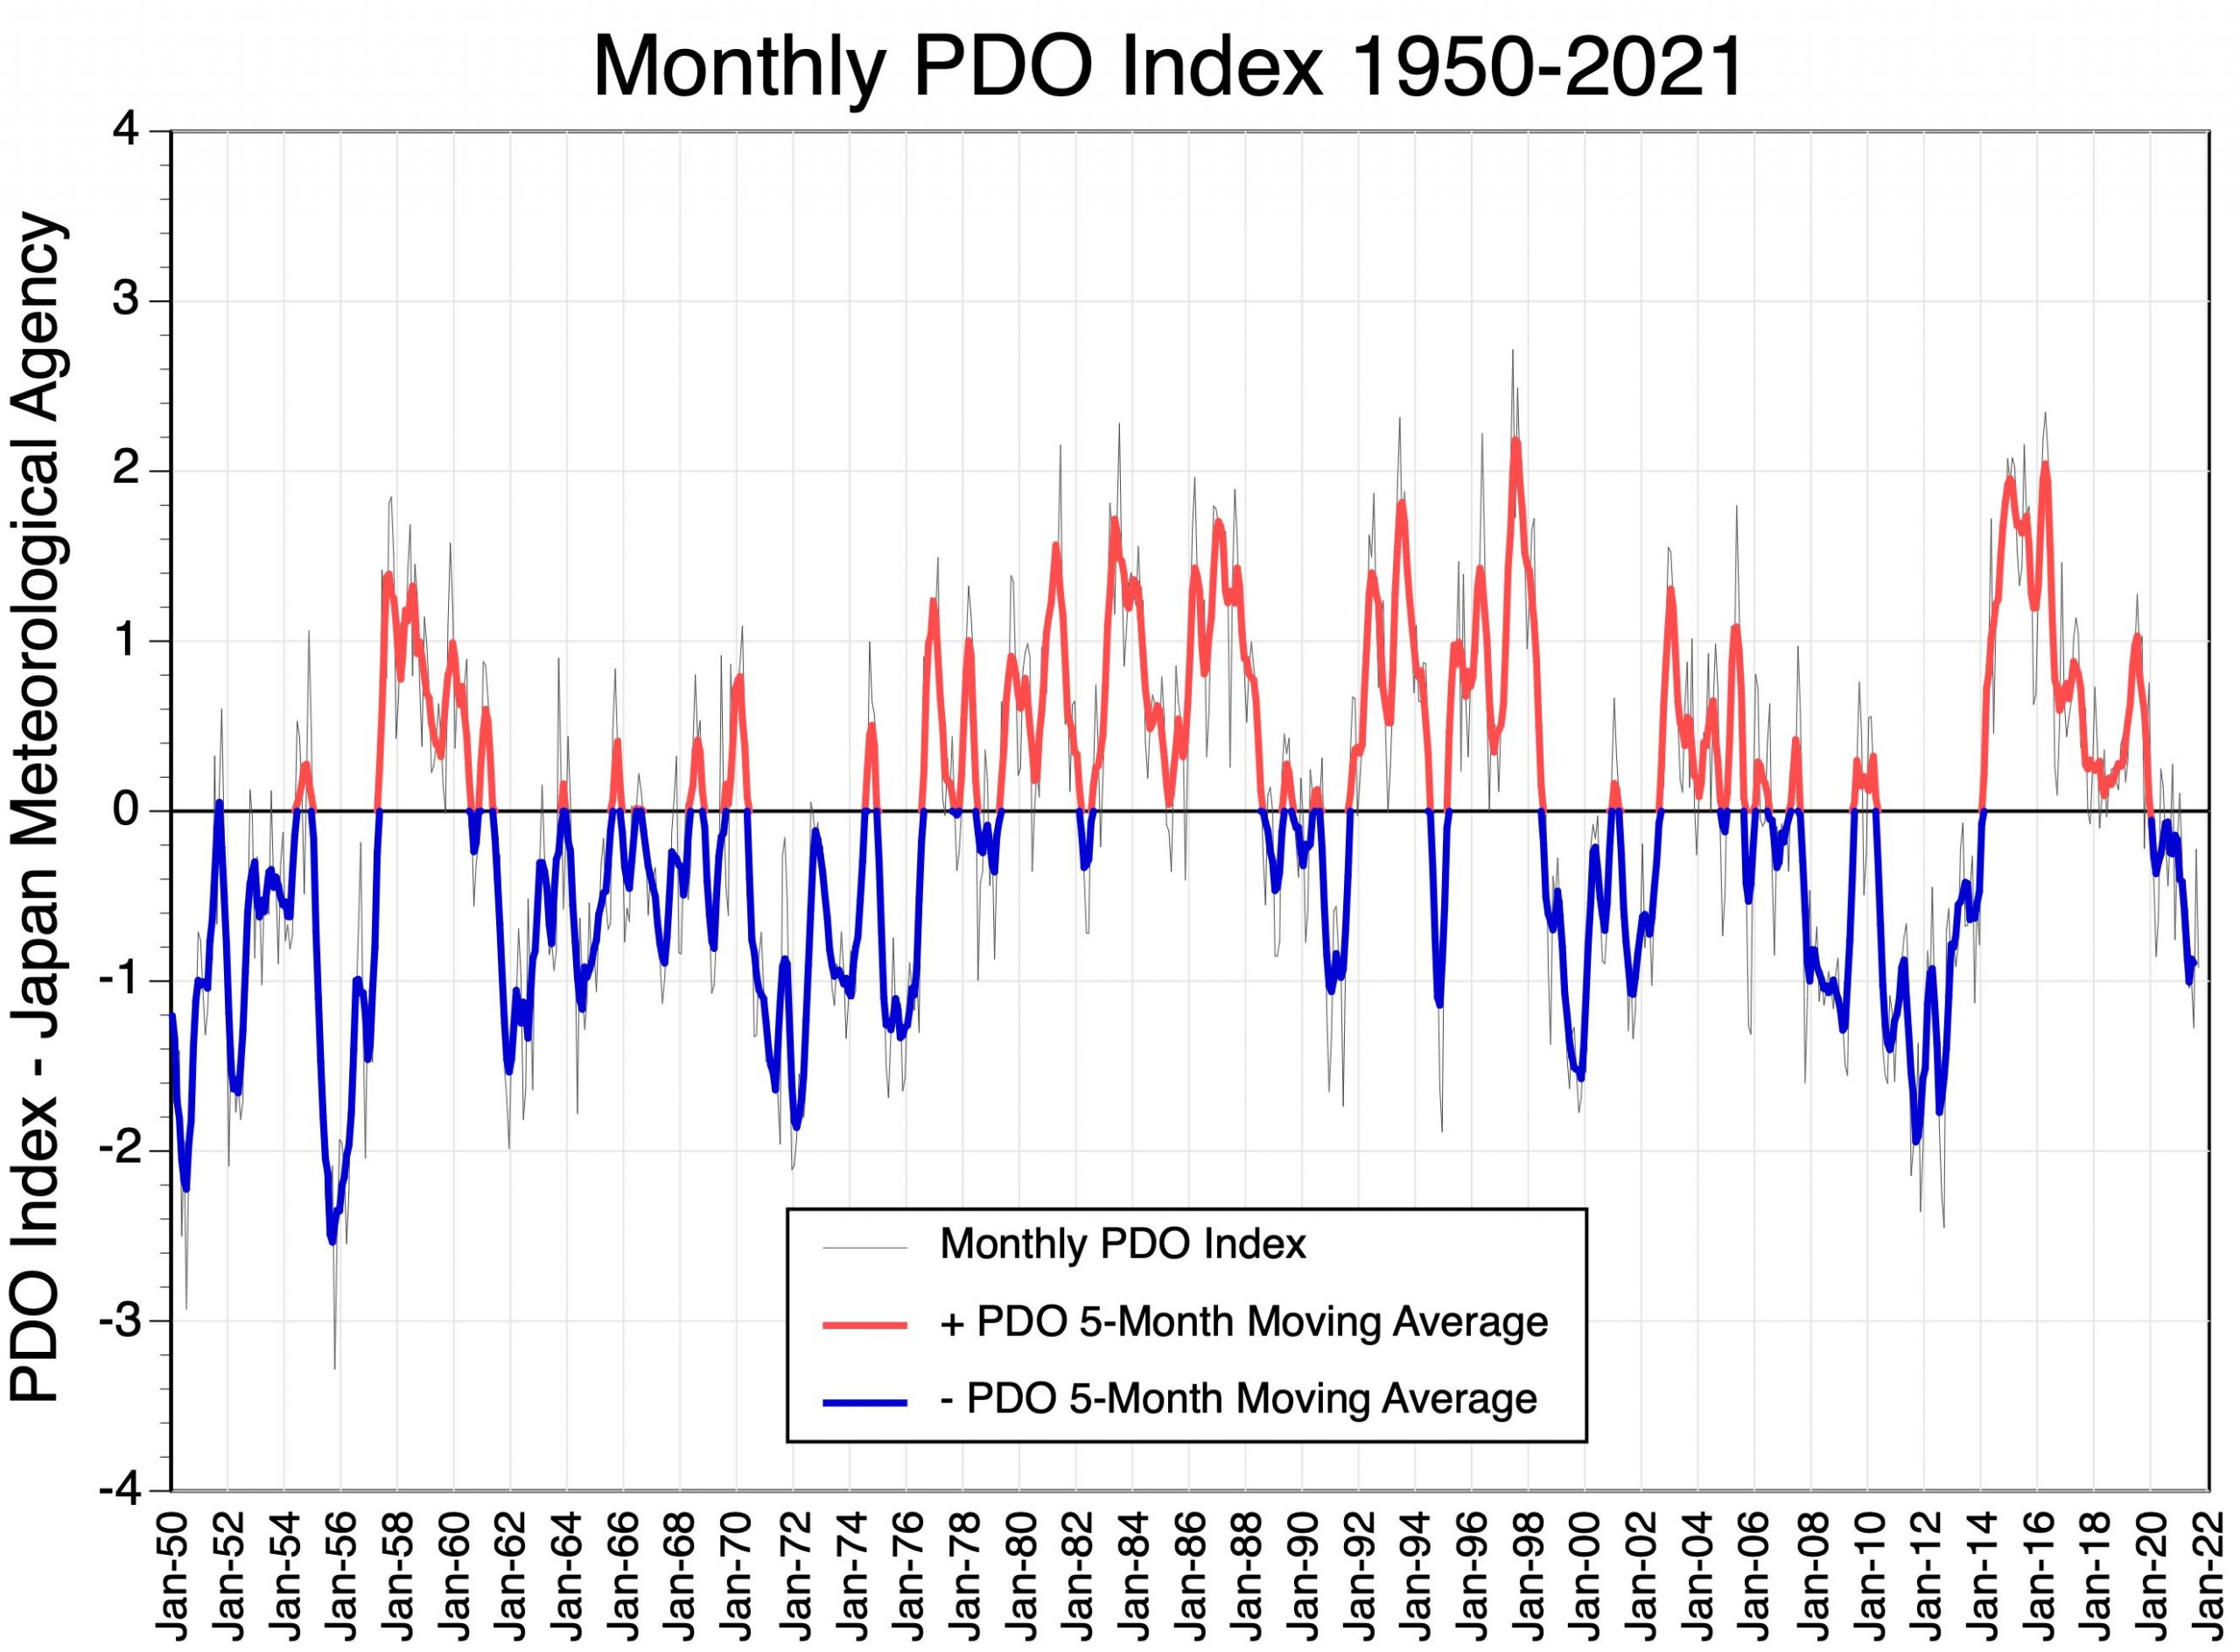
Figure 8. Relative strength and phase of the monthly Pacific Decadal Oscillation Index from January 1950 to September 2021. Values above zero indicate the warm or positive phase of the PDO and are colored red on the moving average line. Values below zero identify the cold or negative phase and are colored blue on the moving average line.
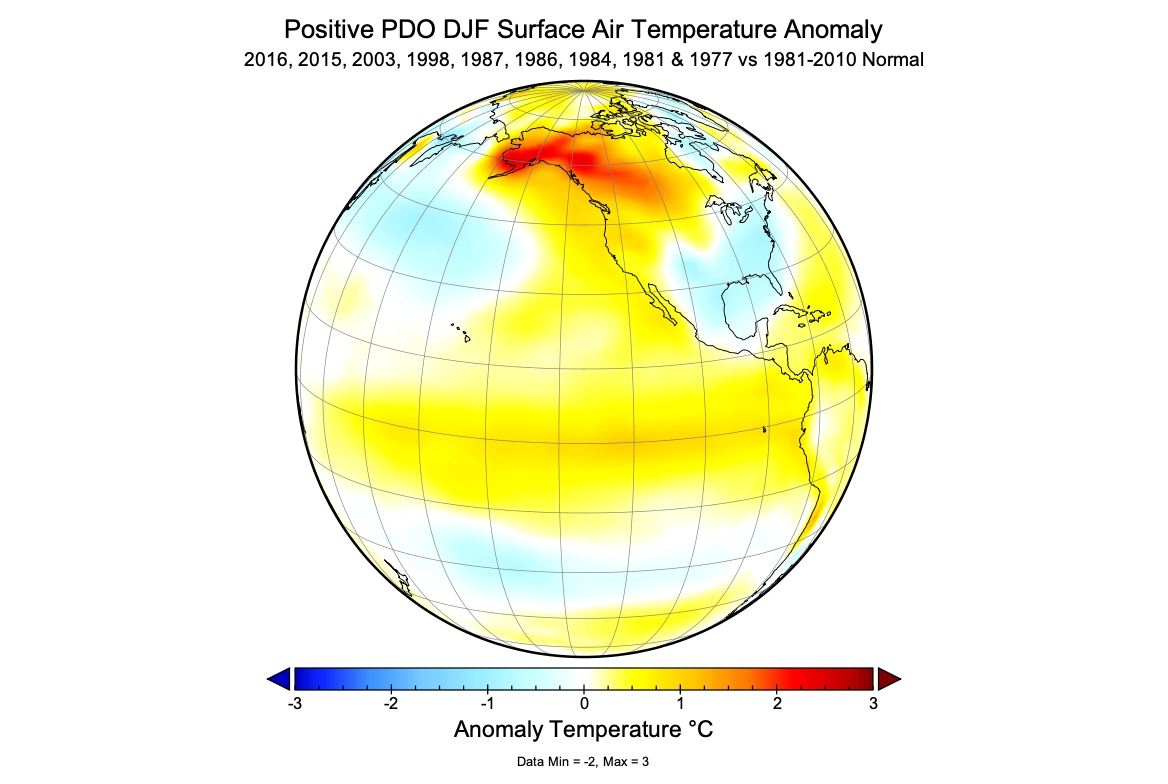
Figure 9. Surface temperature effects of the warm (positive) phase of the Pacific Decadal Oscillation during the winter season (December, January, and February) for the North American continent and the Pacific Ocean. This map describes the average temperature anomaly of nine significant warm episode years to the 30-year average 1981-2010.
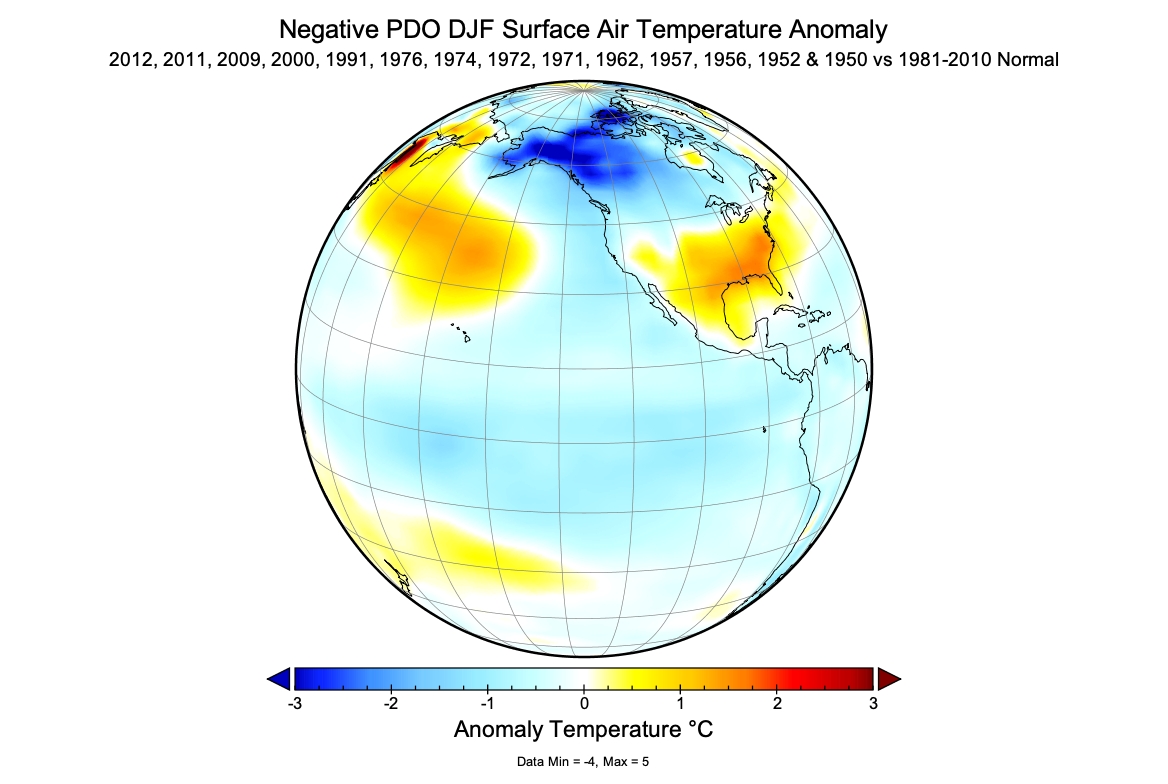
Figure 10. Surface temperature effects of the cold (negative) phase of the Pacific Decadal Oscillation during the winter season (December, January, and February) for the North American continent and the Pacific Ocean. This map describes the average temperature anomaly of fourteen significant cold episode years to the 30-year average 1981-2010.
Forecast Winter 2021/22
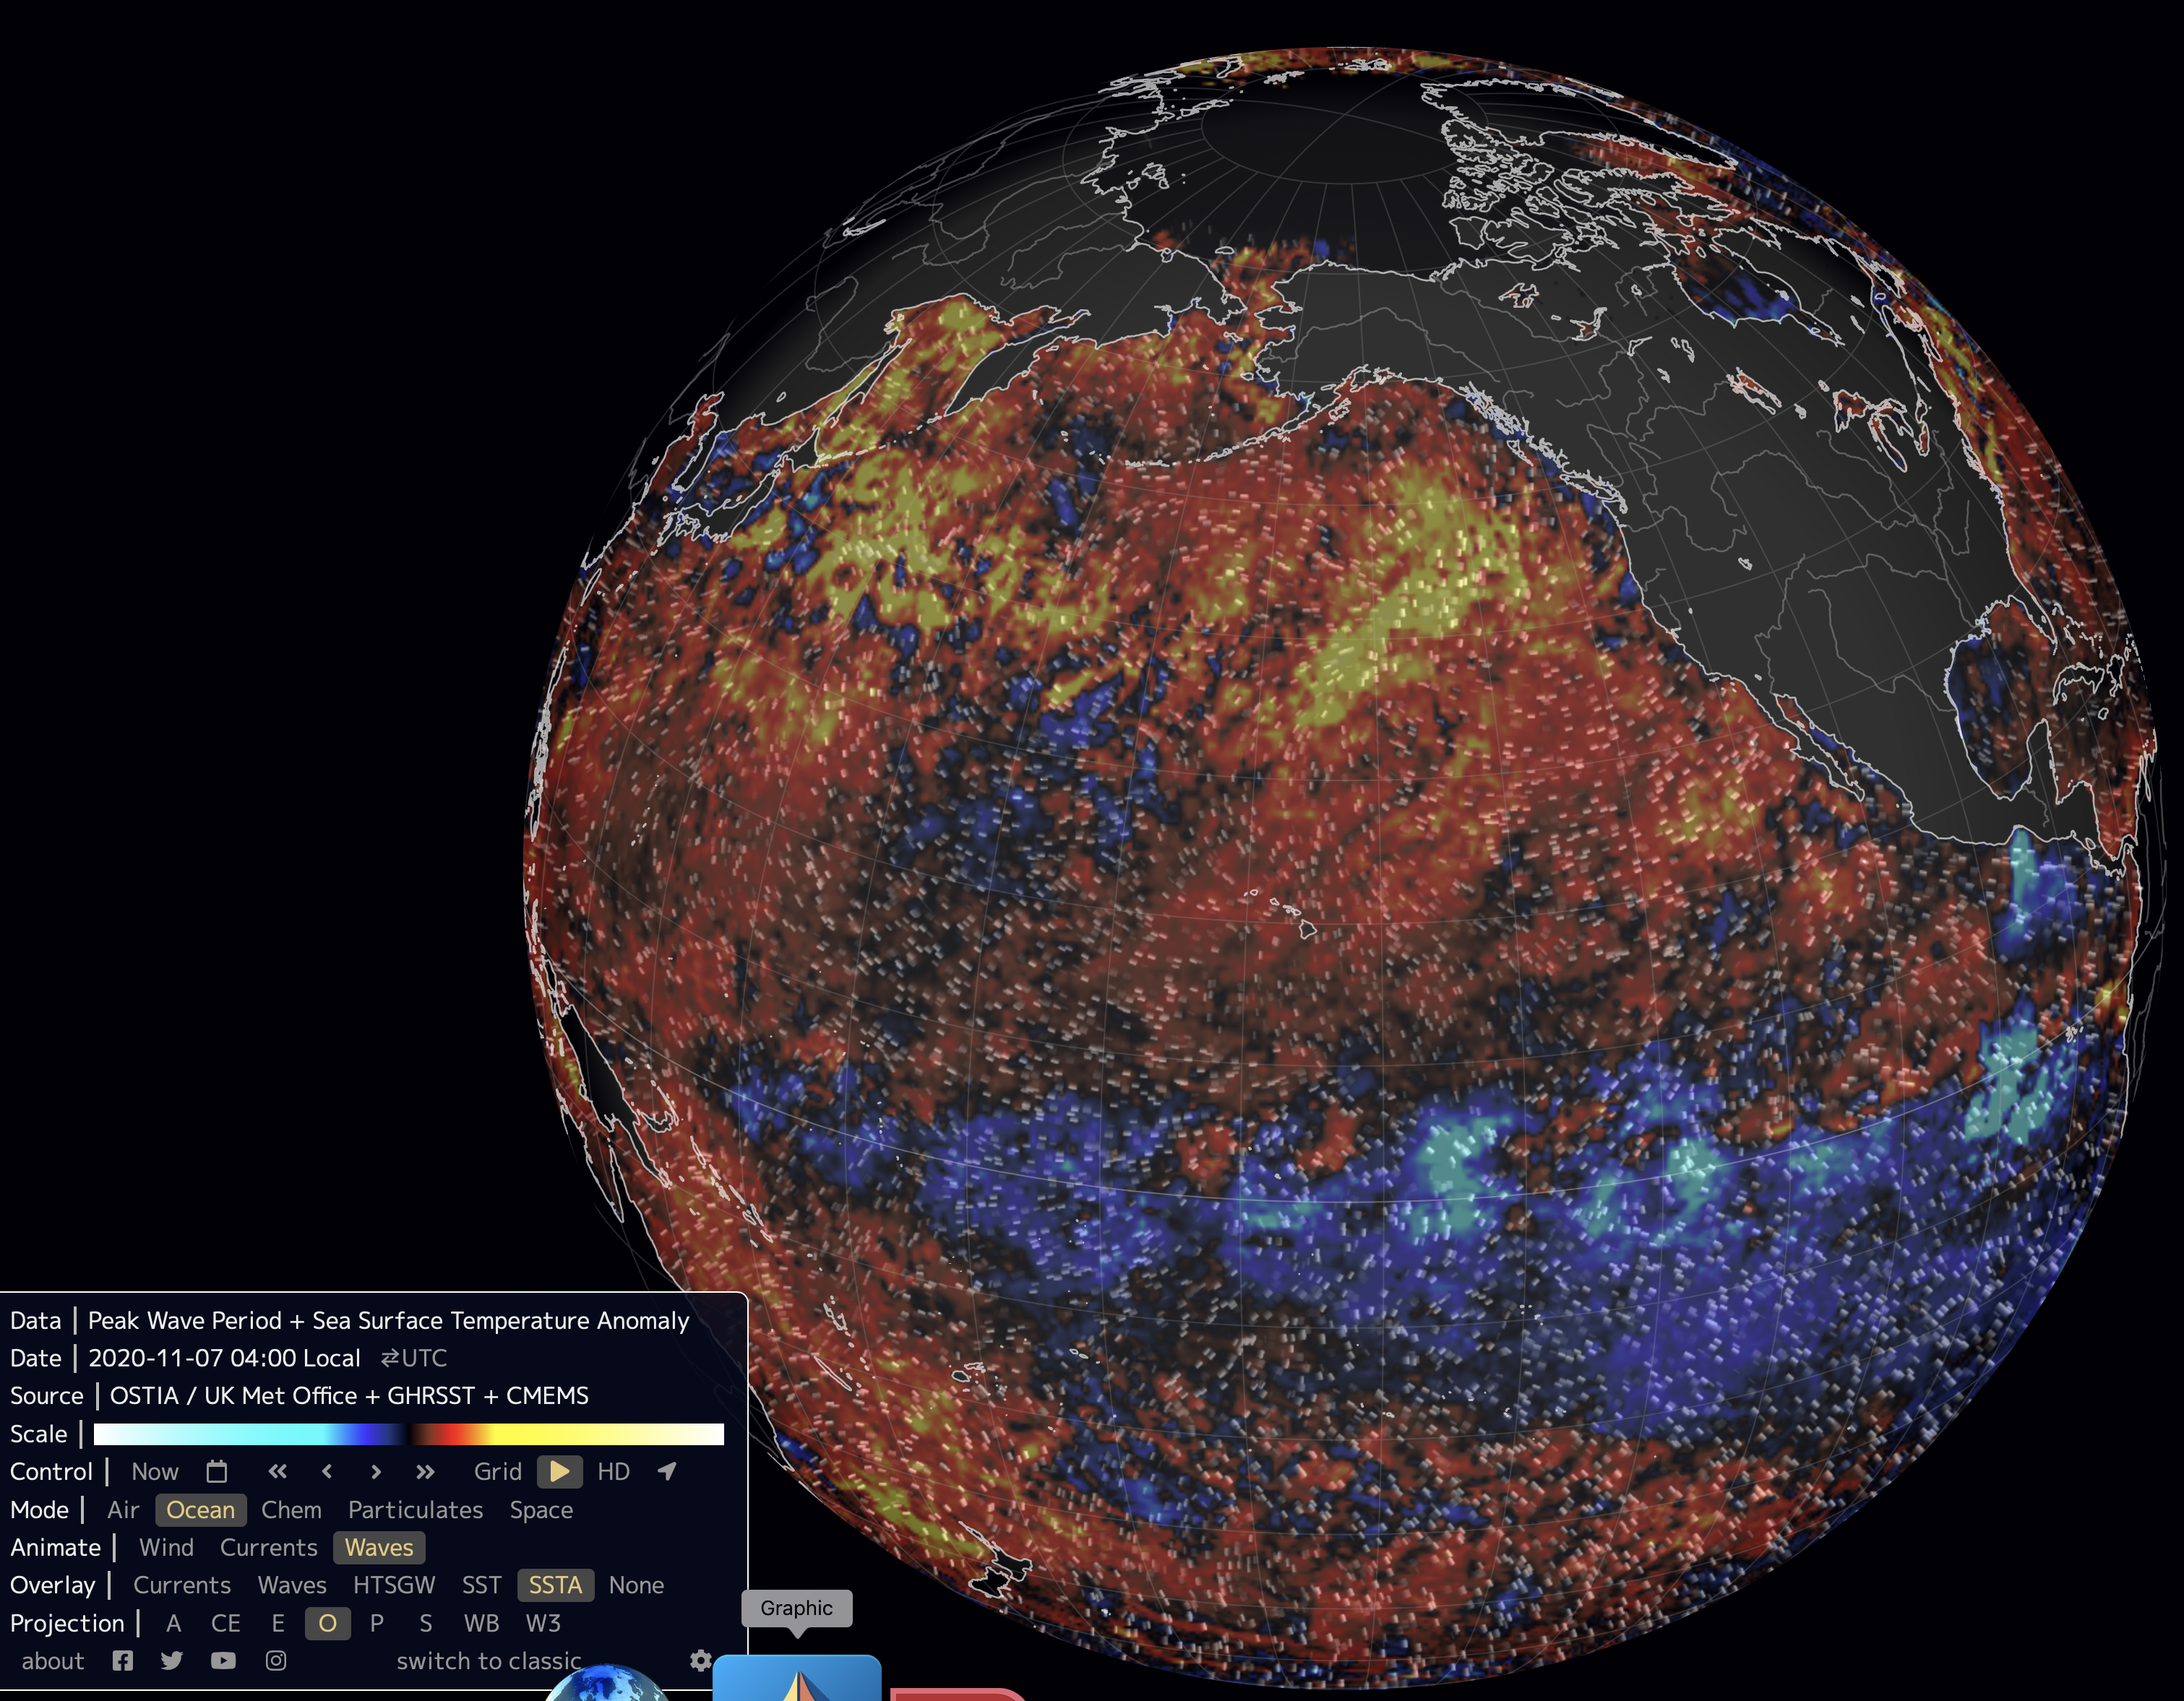
La Niña conditions are now being observed over the equatorial Pacific (Figure 11). Computer models suggest there is an 87% chance that La Niña will continue to exist in December, January, and February.
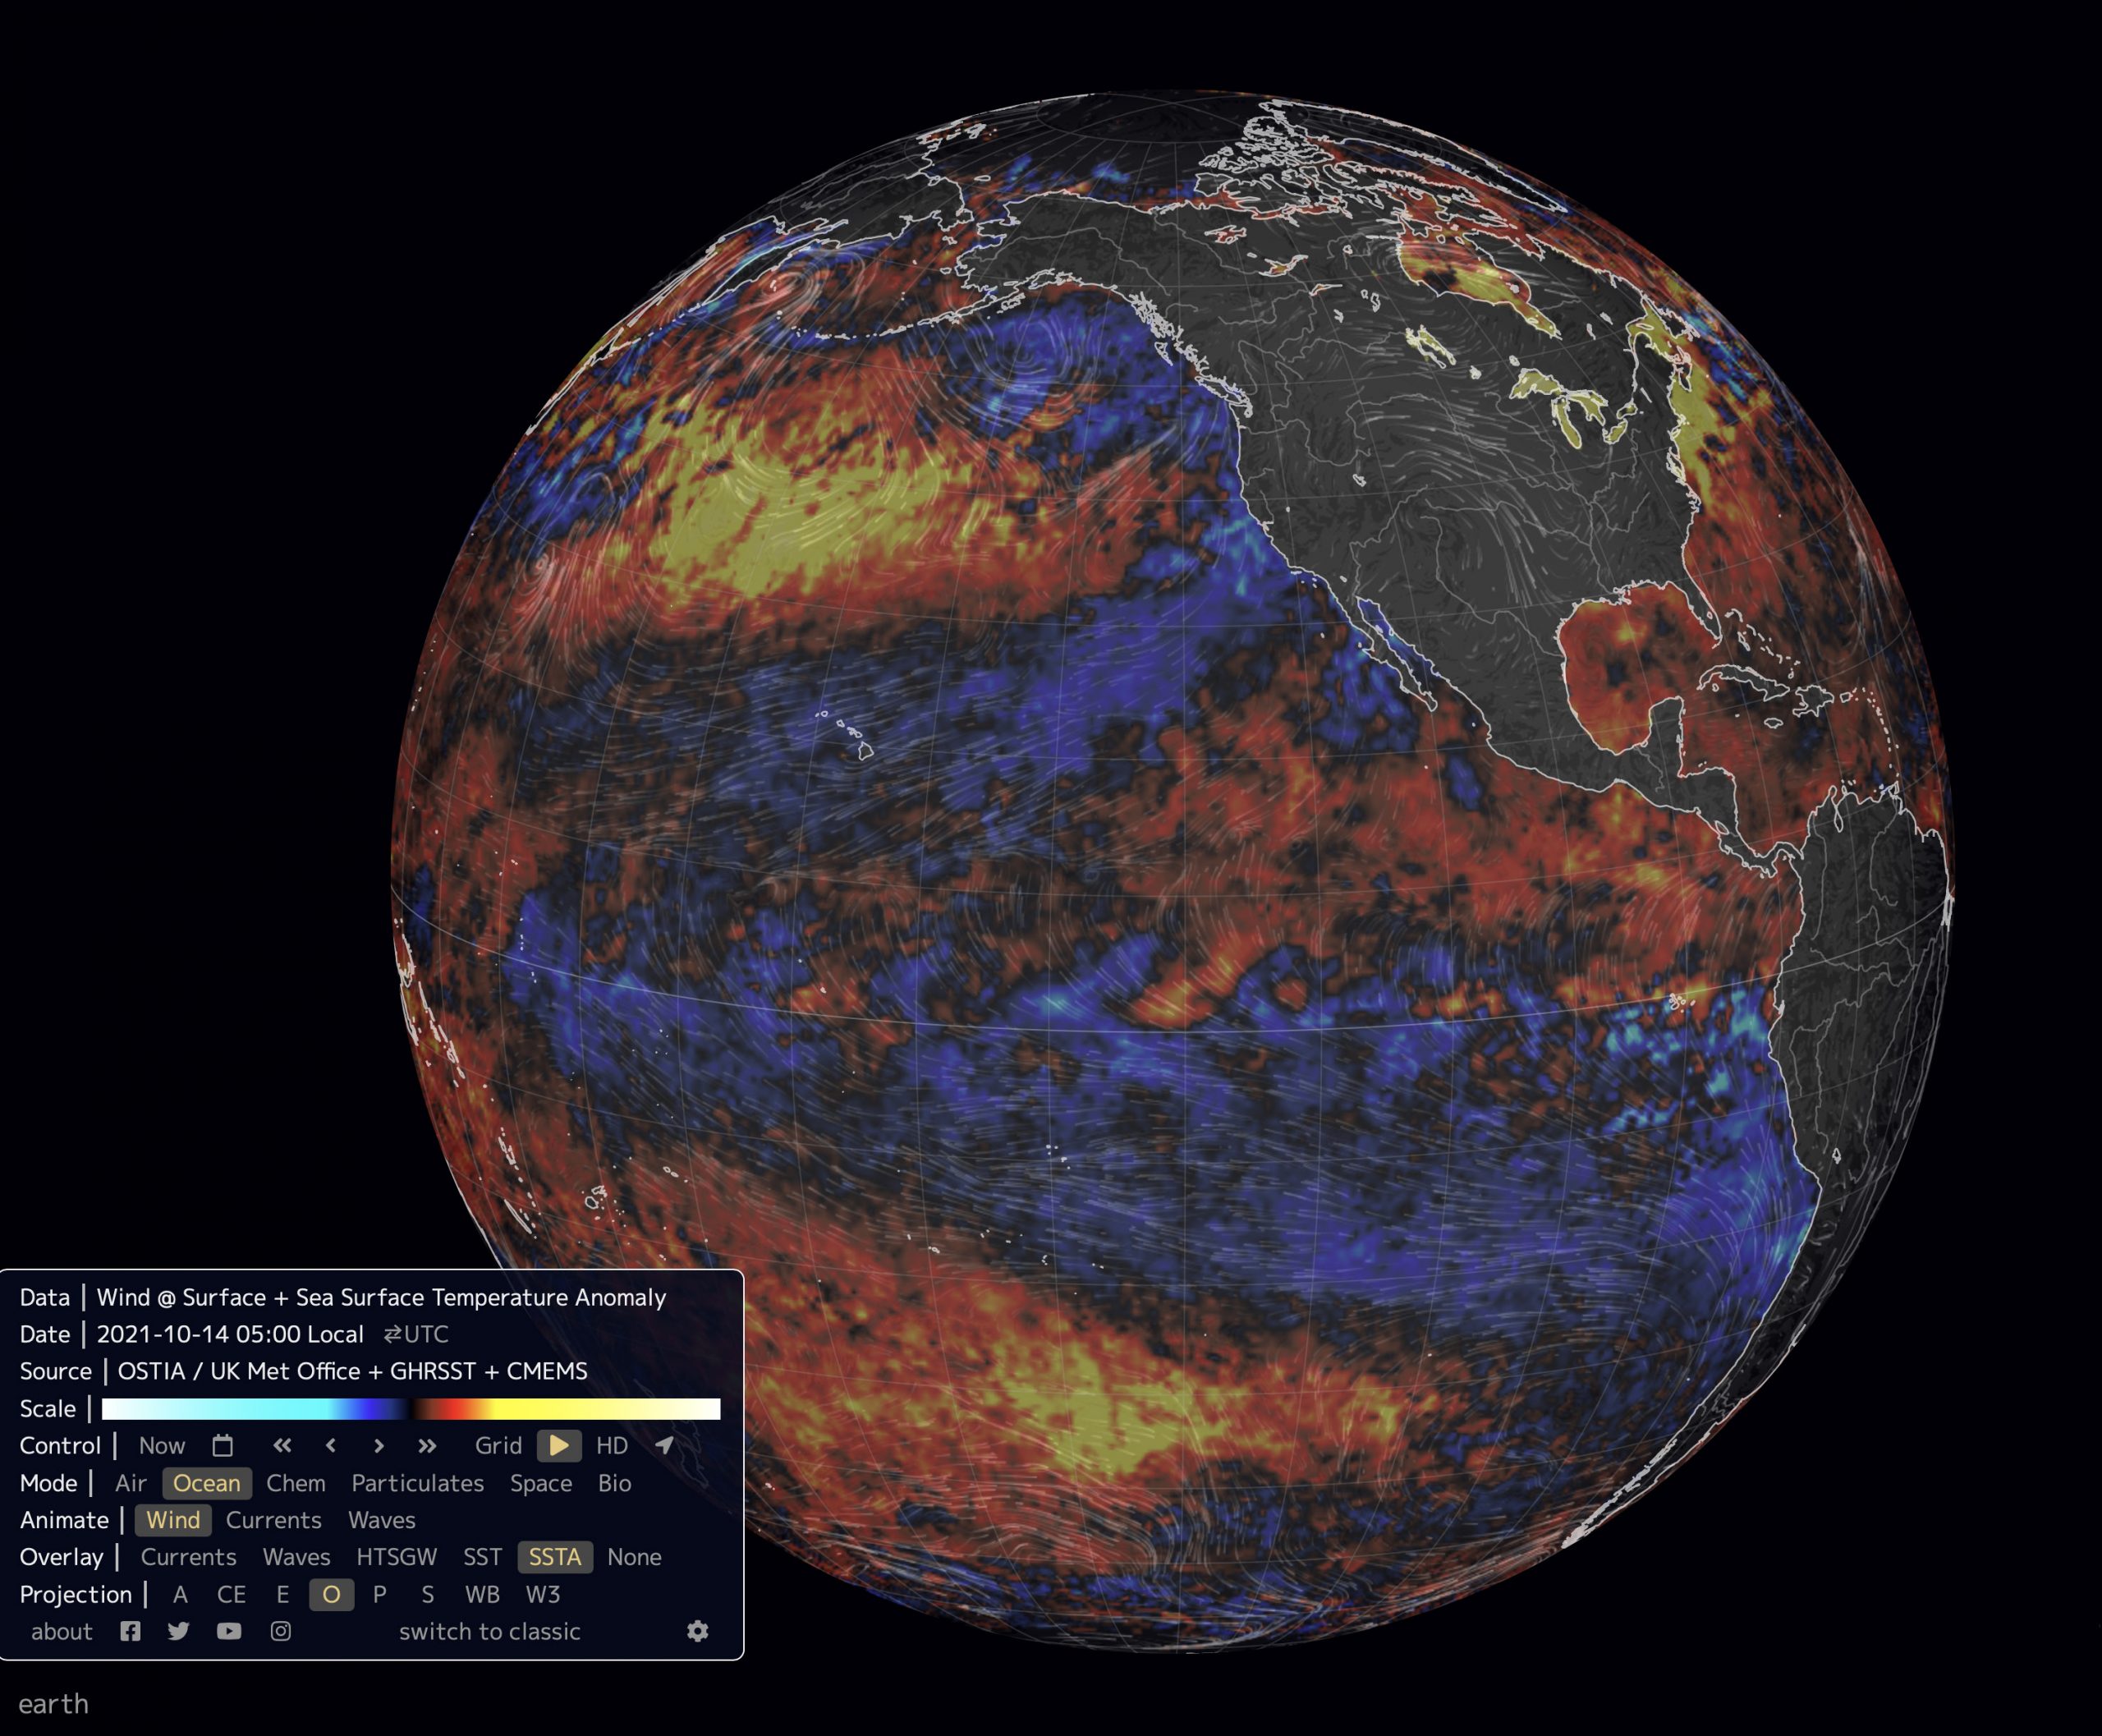
Figure 11. Pacific Ocean sea surface temperature anomalies for October 14, 2021. In this image, black represents a temperature no different than the 1981-2010 thirty-year average. Red to yellow indicates an above-normal temperature anomaly. Blue to light blue indicates a below-normal temperature anomaly. La Niña conditions are now observable along the equatorial Pacific. Also, an extensive area of cooler than average sea surface temperatures exists off the west coast of Canada and the USA. This pattern usually occurs when PDO is in its negative phase. (Image Source: https://earth.nullschool.net).
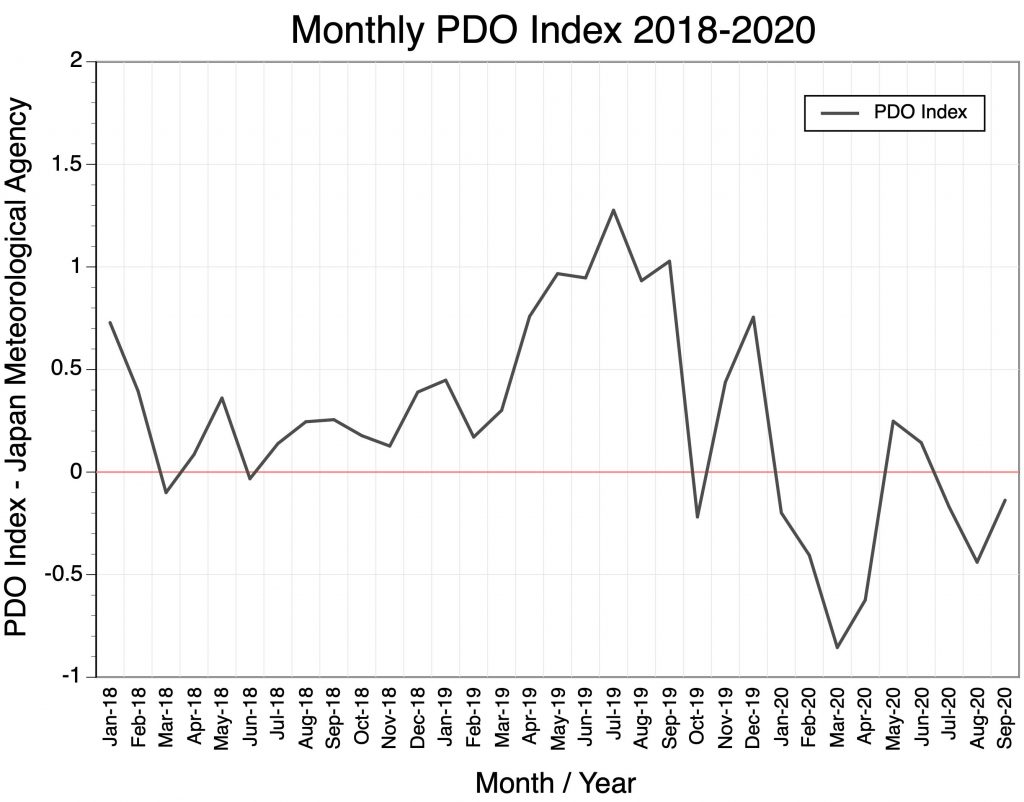
The Pacific Decadal Oscillation (PDO) index from January 2018 to September 2021 is shown in Figure 12 (and see web page Monthly PDO Index). From the summer of 2018 until fall 2019 the monthly PDO index rose from near zero to around +1.0. A sudden decline into negative territory occurred in October 2019, then a rebound to higher values in November and December, and mainly negative values from January 2020 to September 2021.
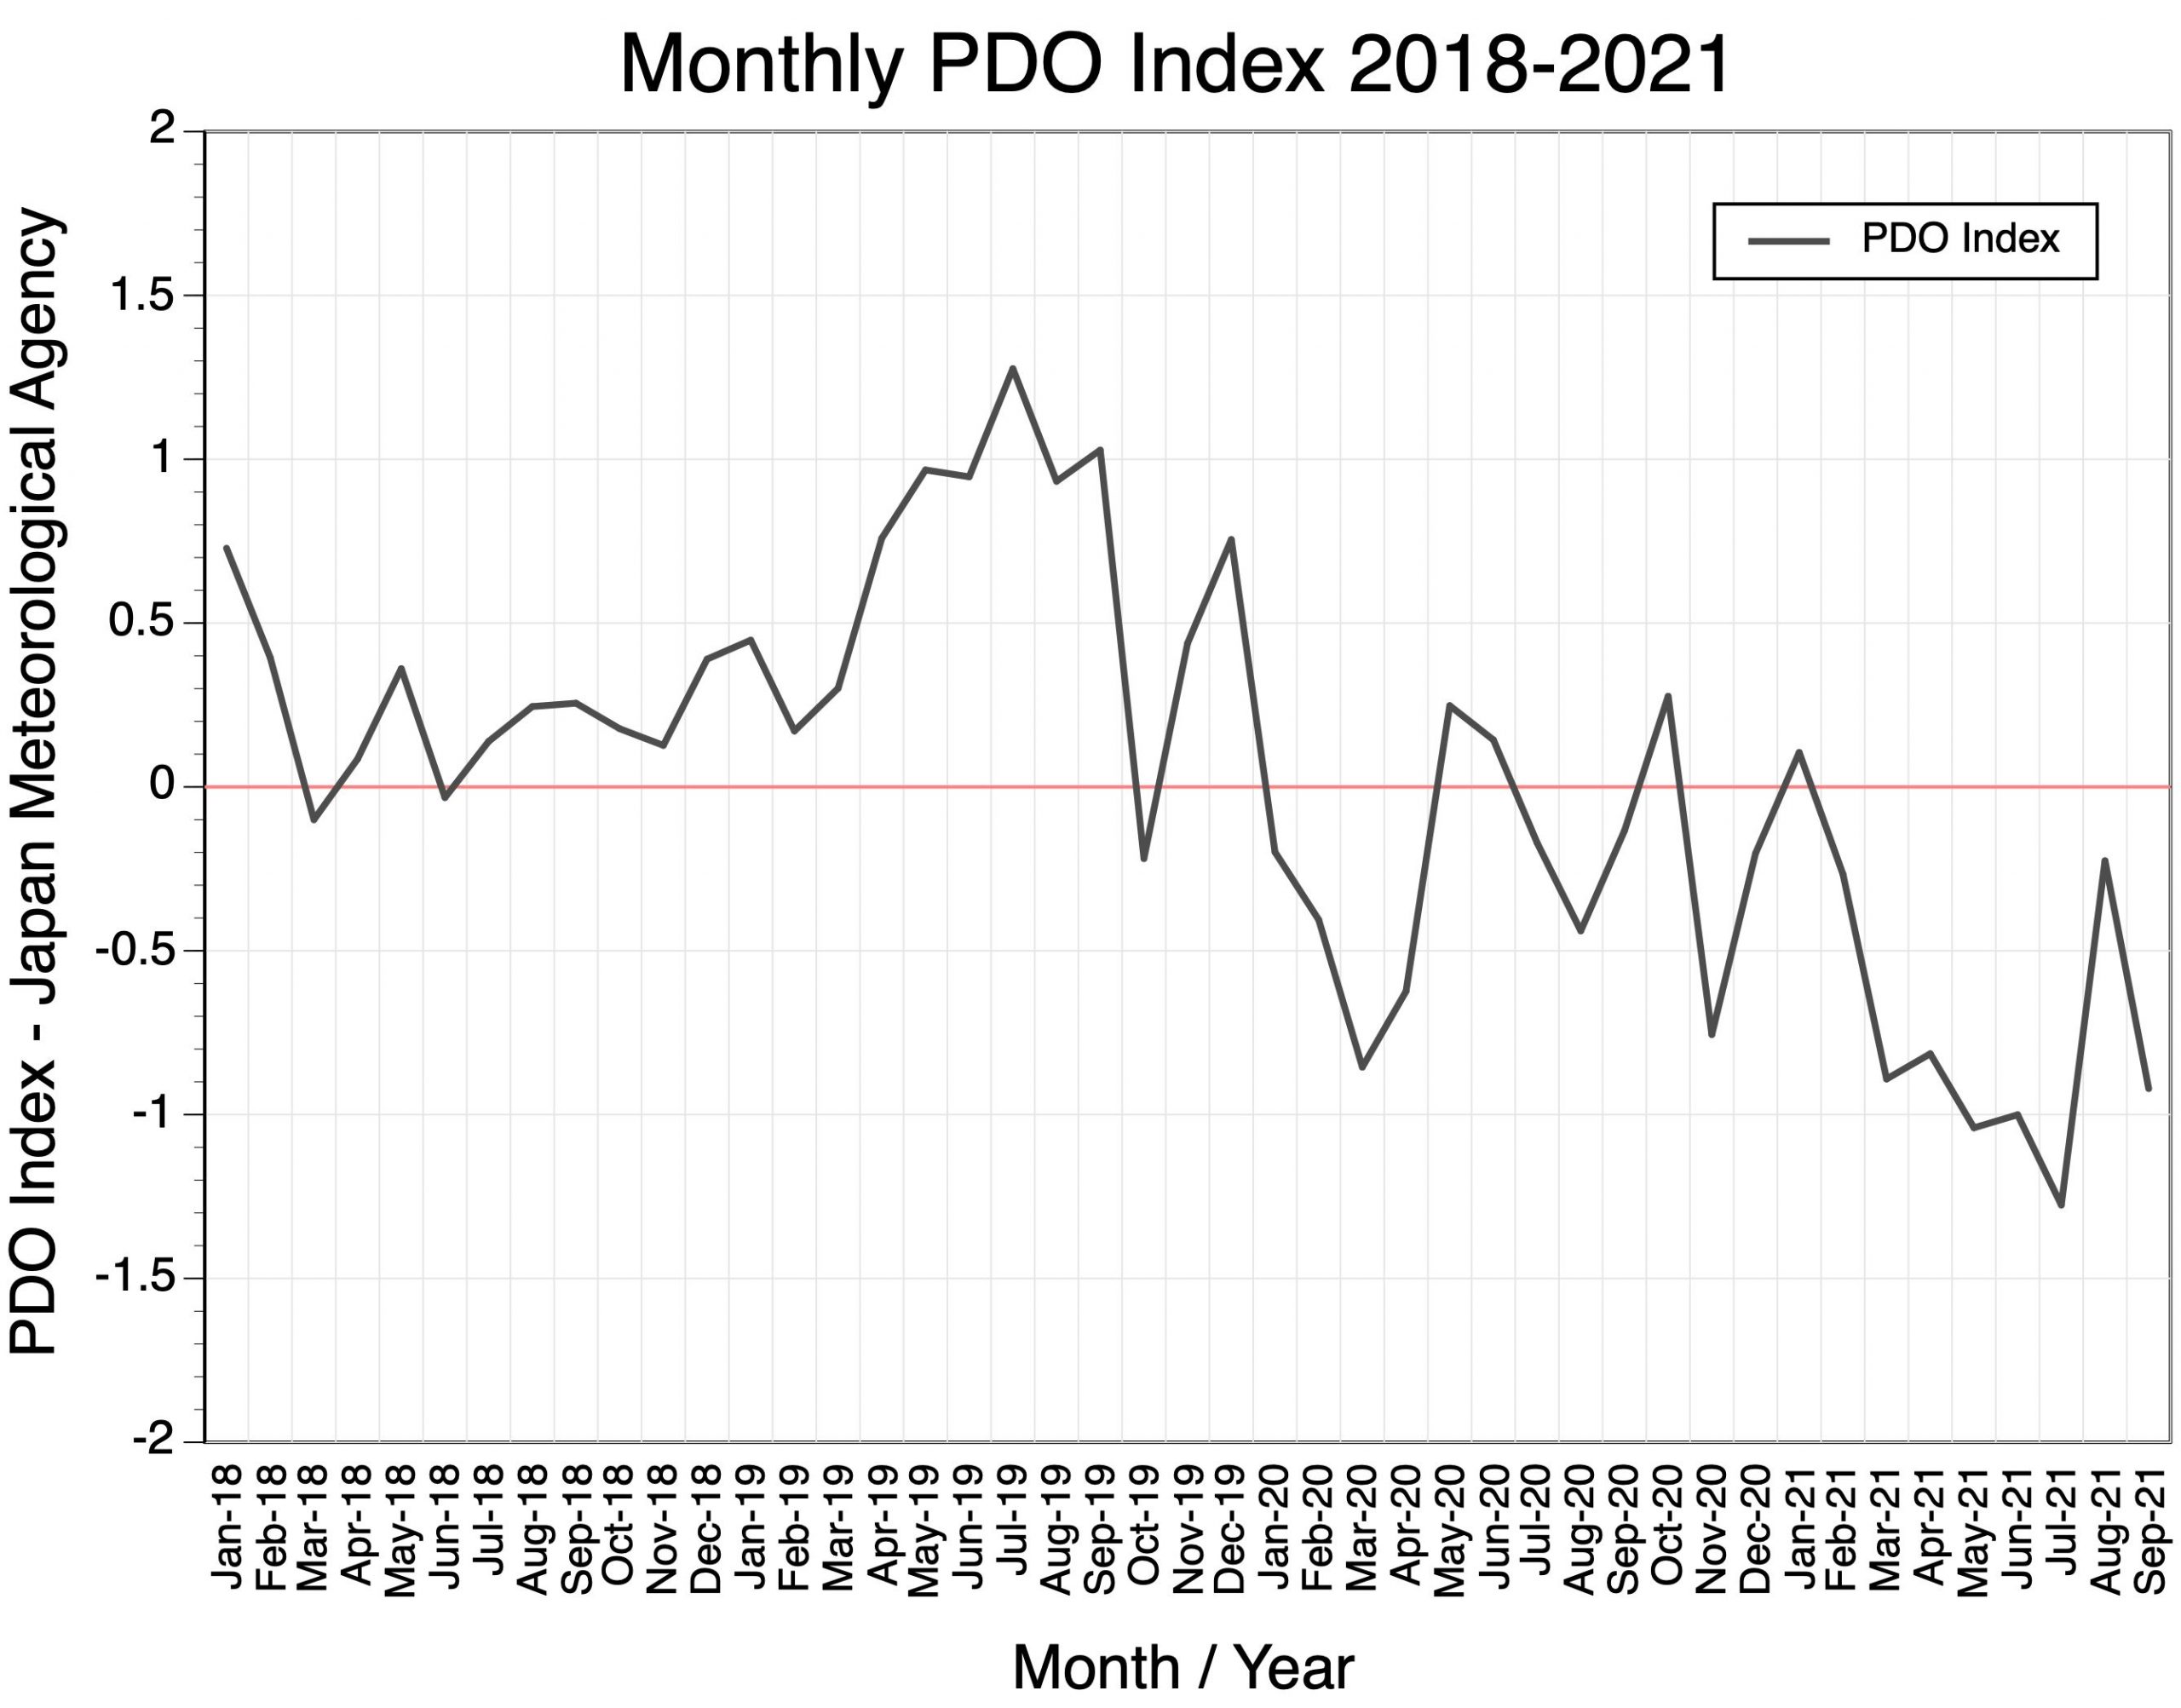
Figure 12. Relative strength and phase of the monthly Pacific Decadal Oscillation Index from January 2018 to September 2021. Values above zero indicate warm or positive phase, while values below zero identify cold or negative phase.
In conclusion, current patterns associated with La Niña and the Pacific Decadal Oscillation suggest that the climate of the winter of 2020/21 will be colder than normal with higher than normal precipitation for southern British Columbia and western Alberta.
Climate Prediction Center – North American Multi-Model Ensemble Long-Range Monthly Forecasts – October 2021
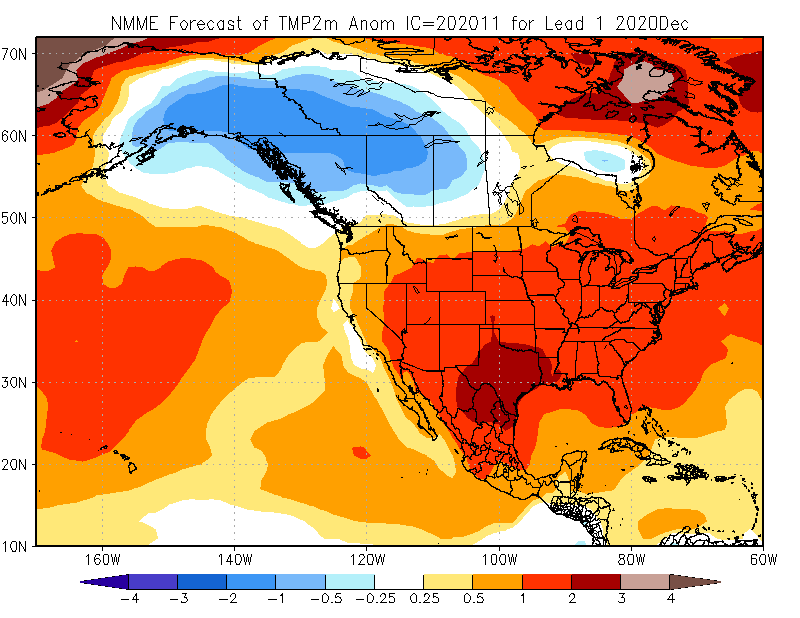
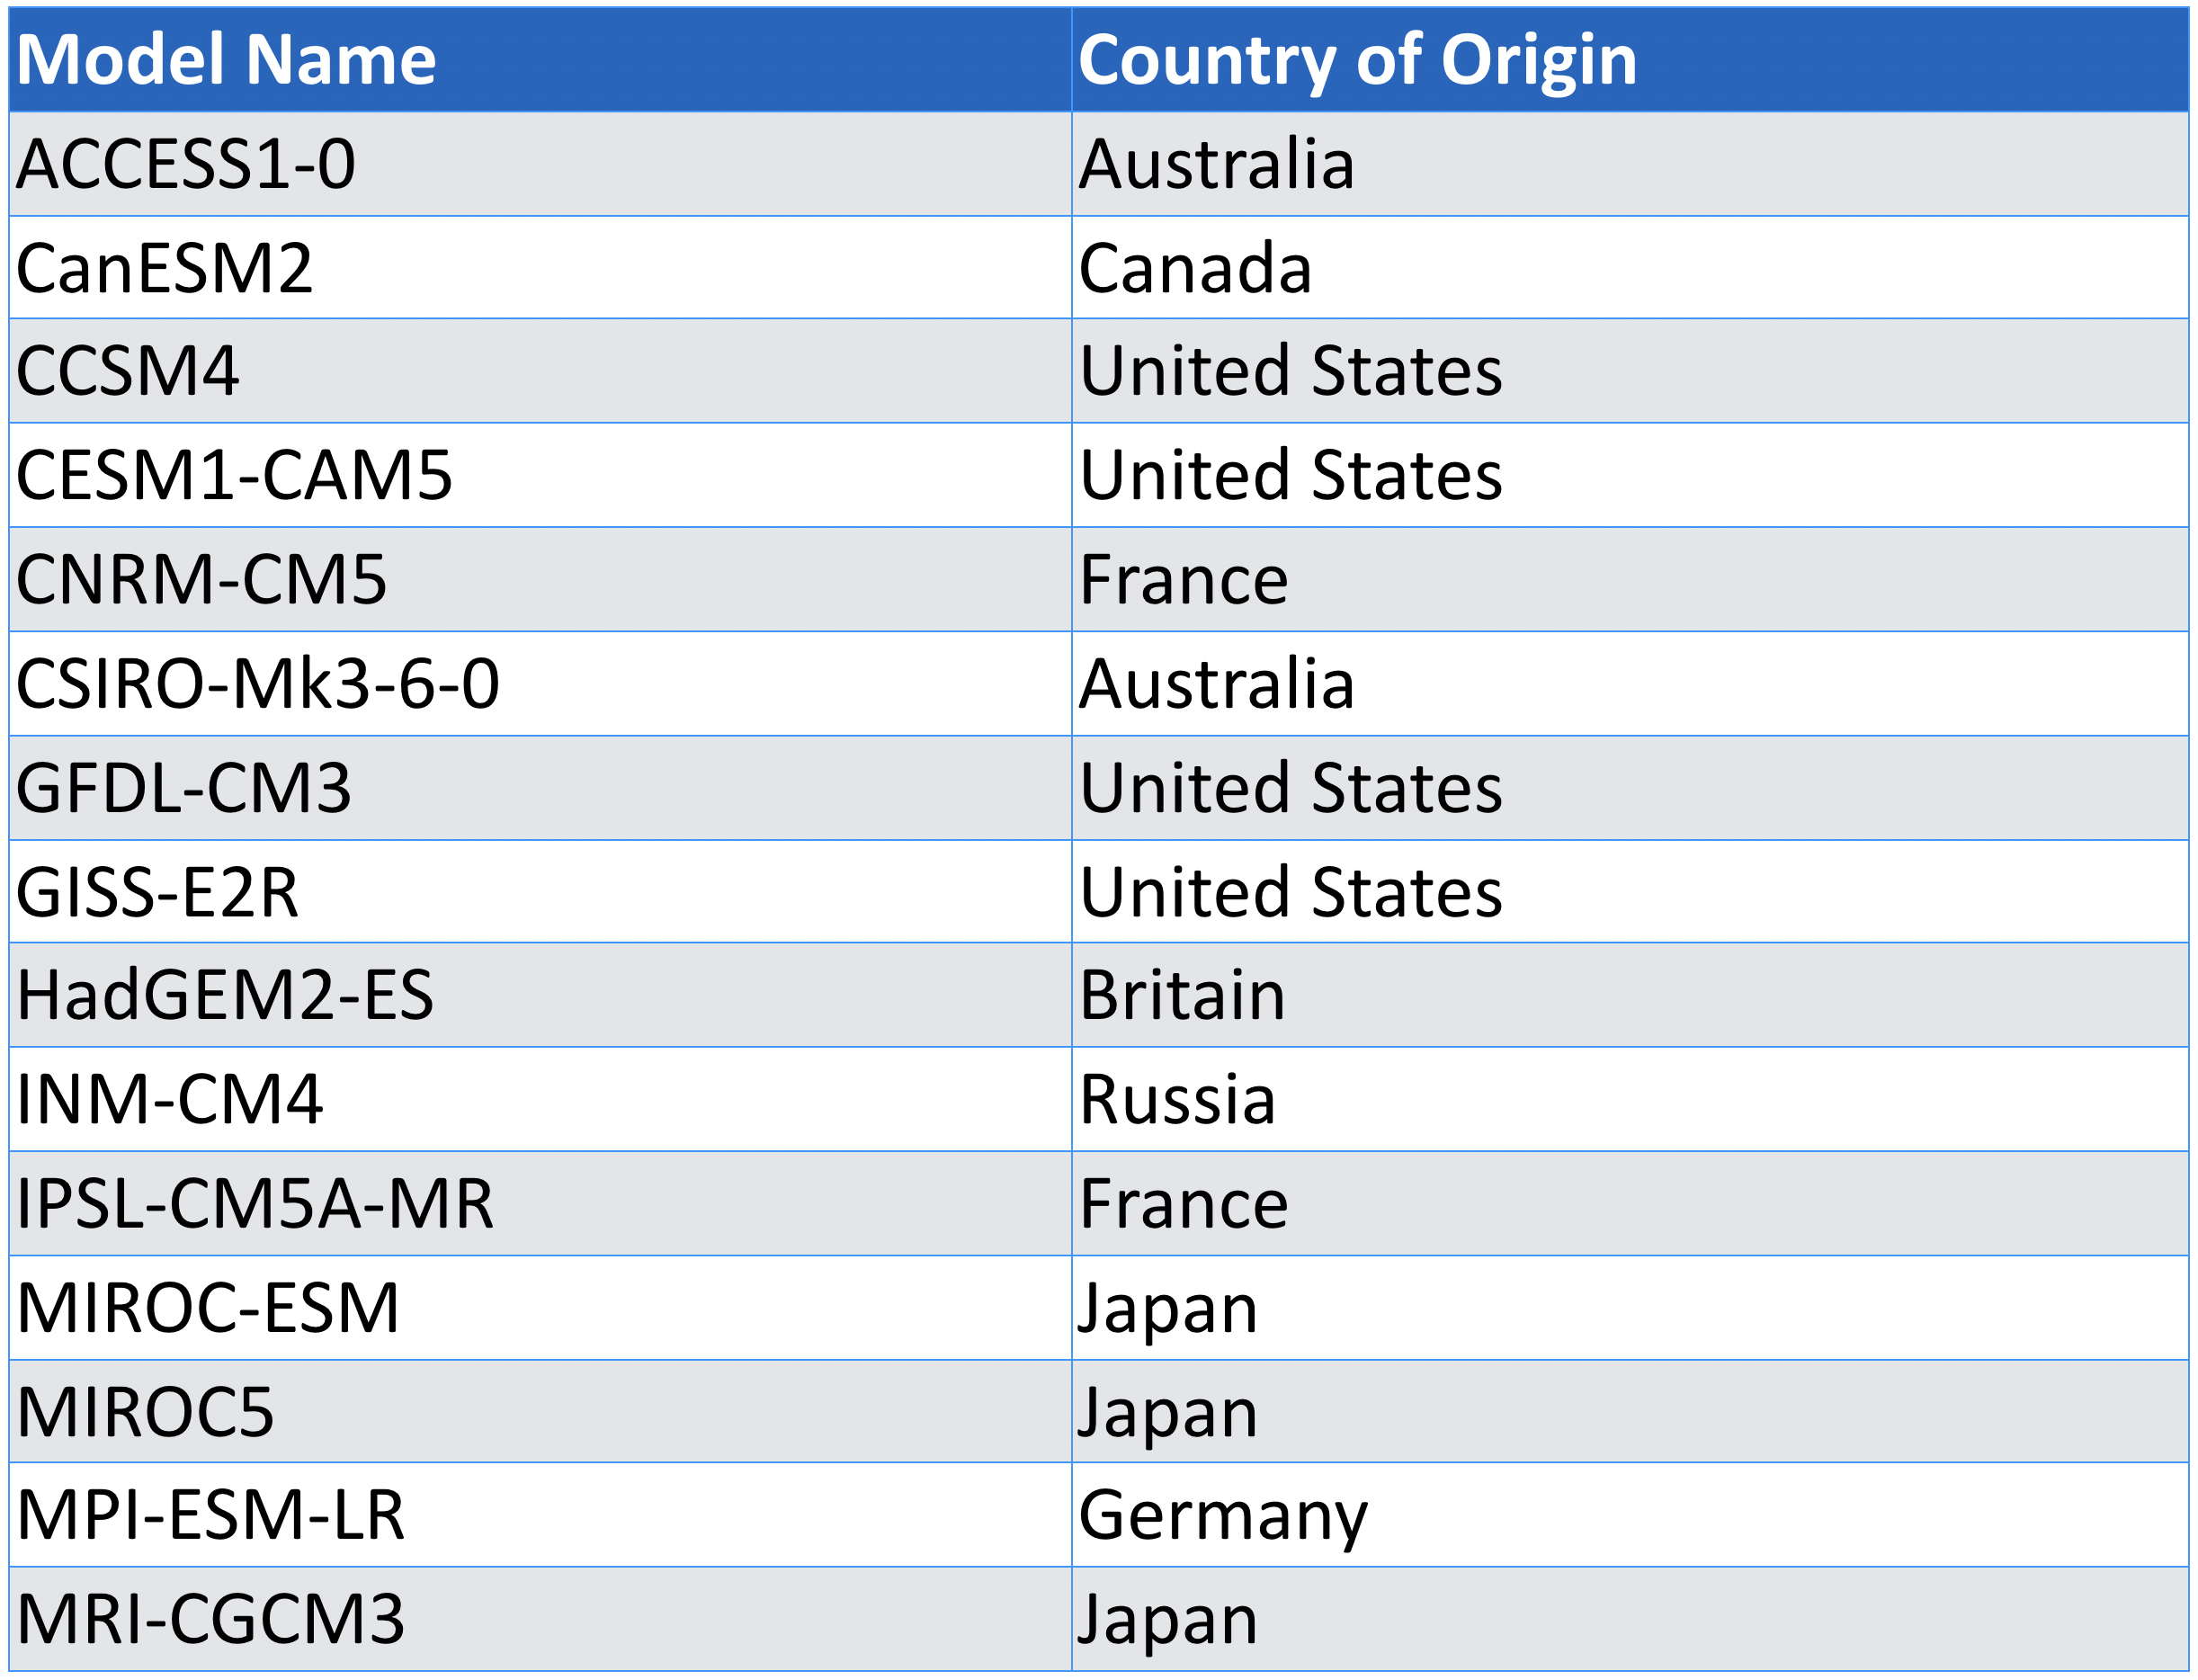
There is one more important piece of information that can provide us with some insight as to what the winter season will be like in Pacific Northwest USA and southern British Columbia in 2021/22. National Oceanic and Atmospheric Administration’s Climate Prediction Center creates long-range seasonal forecasts based on the average of seven different General Circulation Model simulations. Figure 13 describes the December surface mean temperature forecast for North America released in October 2021. This forecast suggests temperatures will be normal to slightly above-normal for southern British Columbia and Alberta, and 0.25 to 2.0°C above-normal for Washington state, eastern Oregon, Idaho, Montana, Utah, and Colorado.
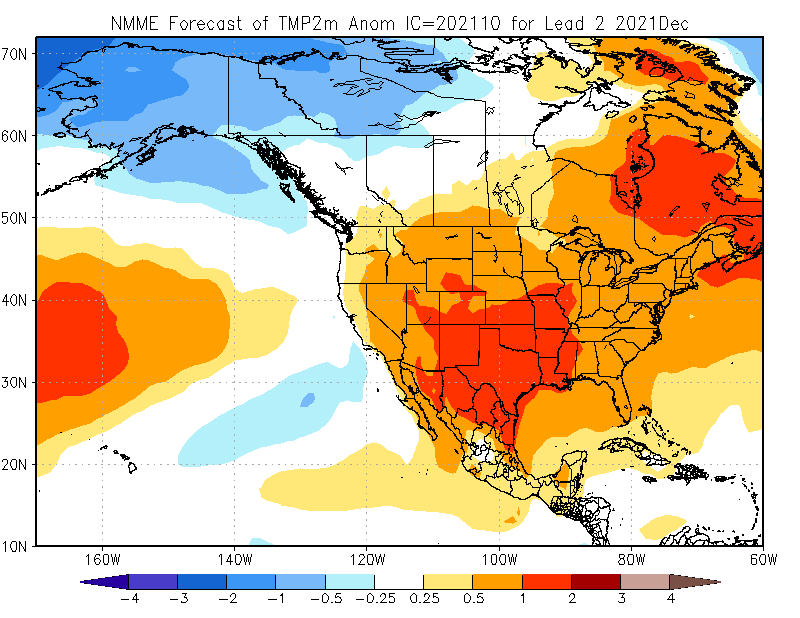
Figure 13. Climate Prediction Center – North American Multi-Model Ensemble surface temperature forecast for December 2021. October 2021 model run. Shown is the forecasted temperature anomaly relative to the 1981-2010 thirty-year average.
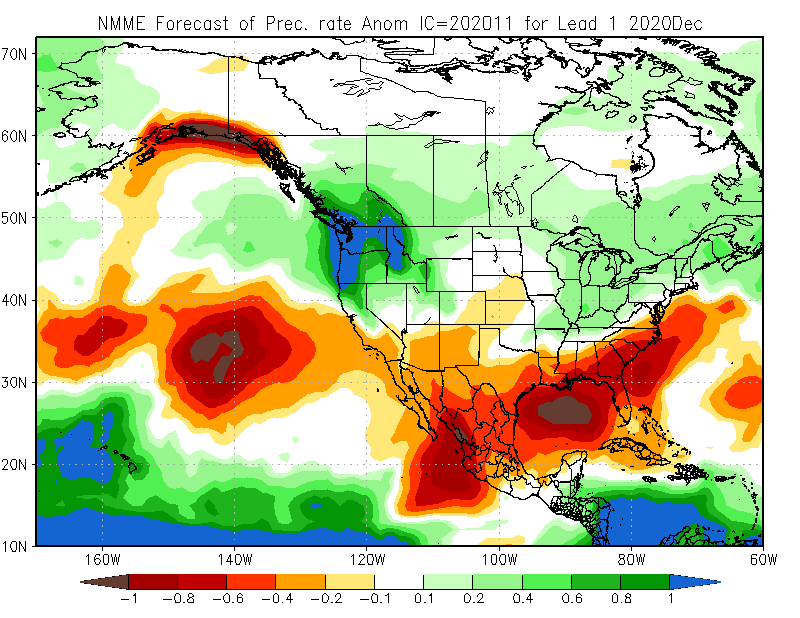
Figure 14 describes the December precipitation forecast for North America from the Climate Prediction Center released in November 2020. This forecast suggests well above-normal precipitation for much of British Columbia, Alberta Rocky Mountains, Washington state, Oregon, northern Idaho, and western Montana.
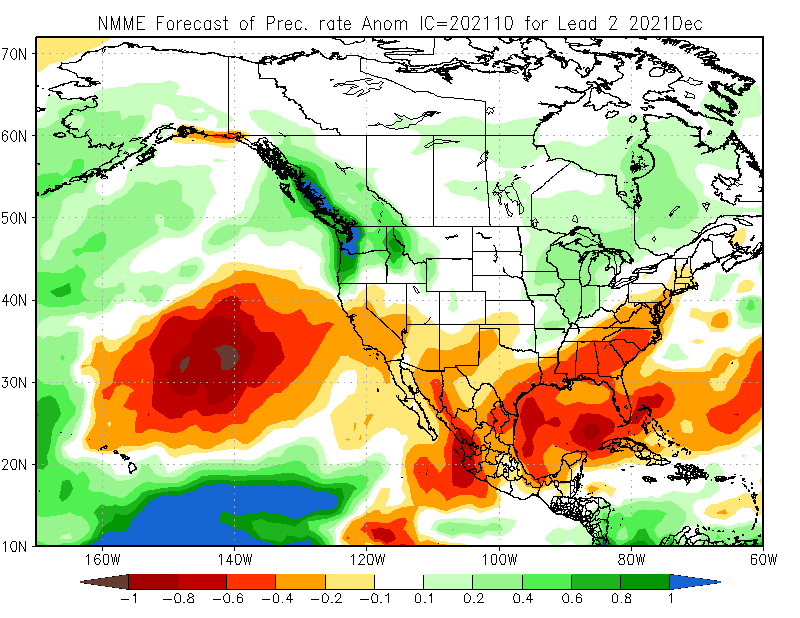
Figure 14. Climate Prediction Center – North American Multi-Model Ensemble precipitation forecast for December 2021. October 2021 model run. Shown is the forecasted precipitation anomaly relative to the 1981-2010 thirty-year average.
Climate Prediction Center – North American Multi-Model Ensemble Long-Range Seasonal Forecasts – January 2021 and February 2021.
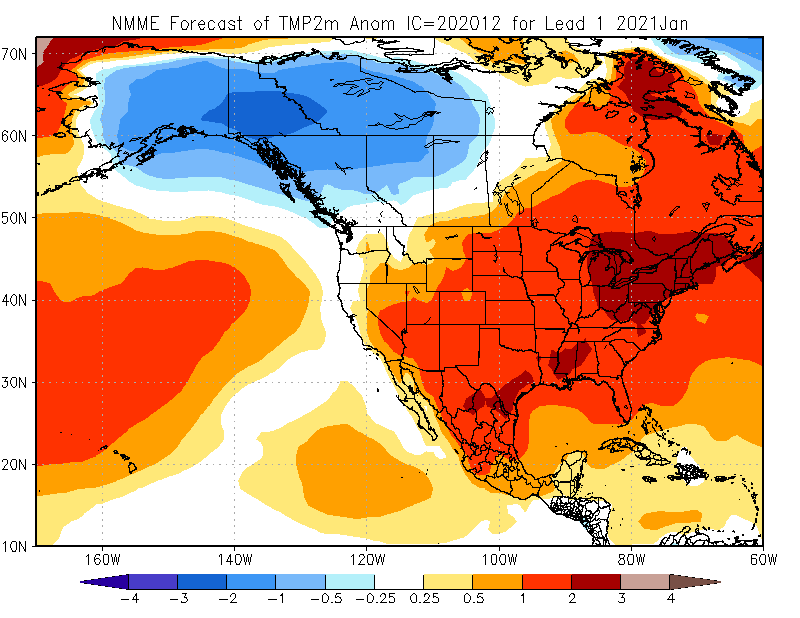
Figures 15 and 16 describe respective January and February surface mean temperature forecasts for North America released in December 2020. The January forecast suggests temperatures will be below-normal for British Columbia, Alberta, Washington State, western Oregon, Montana, and northern Idaho (Figure 15). While southern California, Utah, Arizona, New Mexico, and Colorado will see above-normal temperatures.
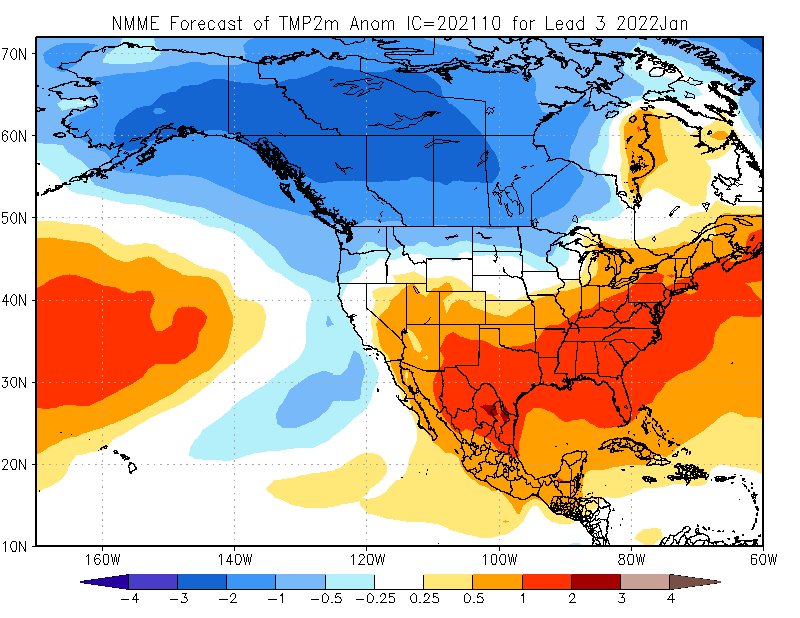
Figure 15. Climate Prediction Center – North American Multi-Model Ensemble surface temperature forecast for January 2022. October 2021 model run. Shown is the forecasted temperature anomaly relative to the 1981-2010 thirty-year average.
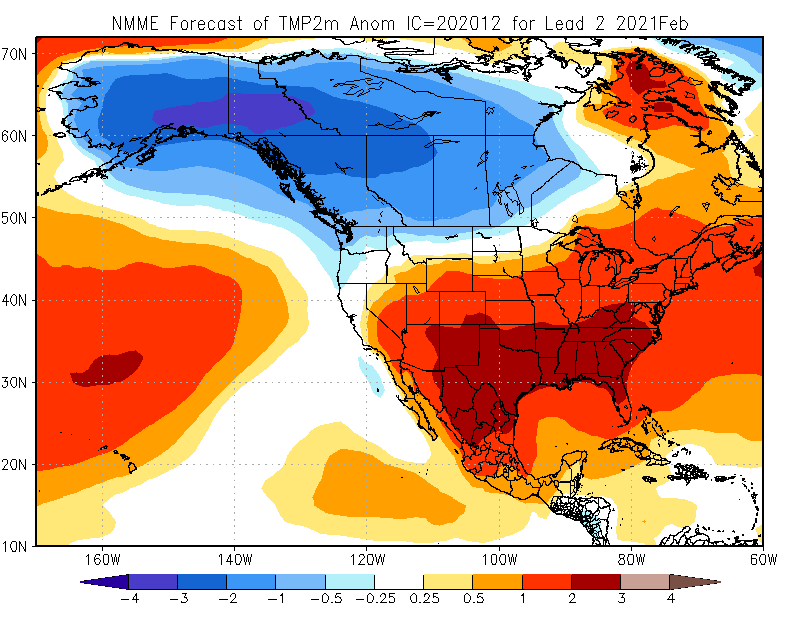
The February forecast suggests temperatures will be below-normal for most of British Columbia and Alberta (Figure 16). Normal temperatures will prevail in and Alberta, northern Montana, northern California, Oregon, and Washington state. While southern California, southern Idaho, southern Montana, Wyoming, Utah, Nevada, New Mexico, and Colorado will see above-normal temperatures.
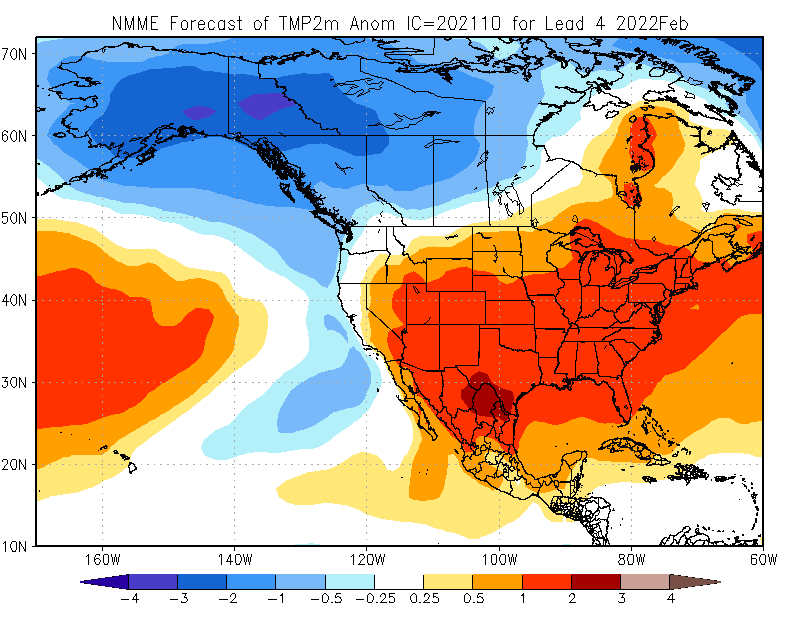
Figure 16. Climate Prediction Center – North American Multi-Model Ensemble surface temperature forecast for February 2022. October 2021 model run. Shown is the forecasted temperature anomaly relative to the 1981-2010 thirty-year average.
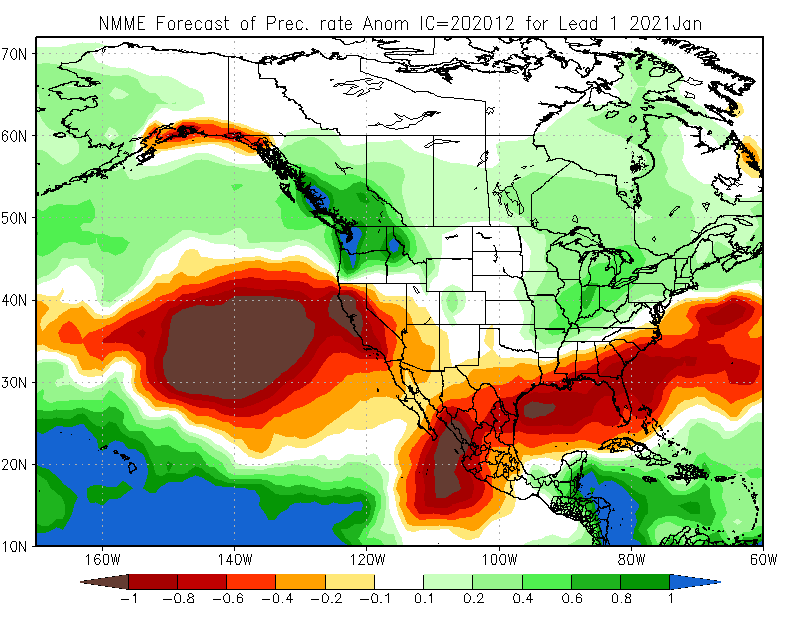
Figures 17 and 18 describe respective January and February precipitation rate forecasts for North America released in October 2021. The January forecast suggests precipitation will be above-normal for southern British Columbia, southern Alberta, Washington state, Oregon, Idaho, western Wyoming, and Montana (Figure 17). Below-normal precipitation will occur in California, southern Nevada, southern New Mexico, and Arizona. Elsewhere precipitation conditions will be near normal.
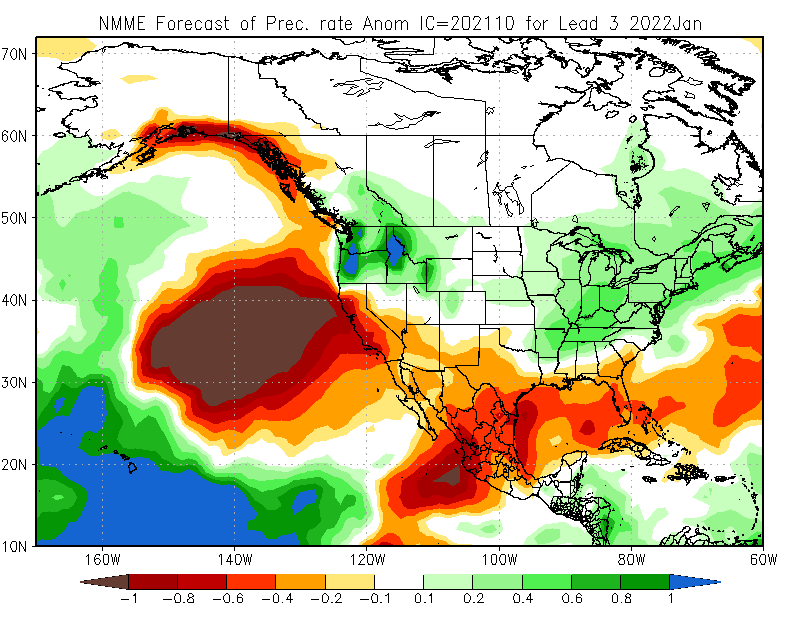
Figure 17. Climate Prediction Center – North American Multi-Model Ensemble precipitation forecast for January 2022. October 2021 model run. Shown is the forecasted precipitation rate anomaly relative to the 1981-2010 thirty-year average.
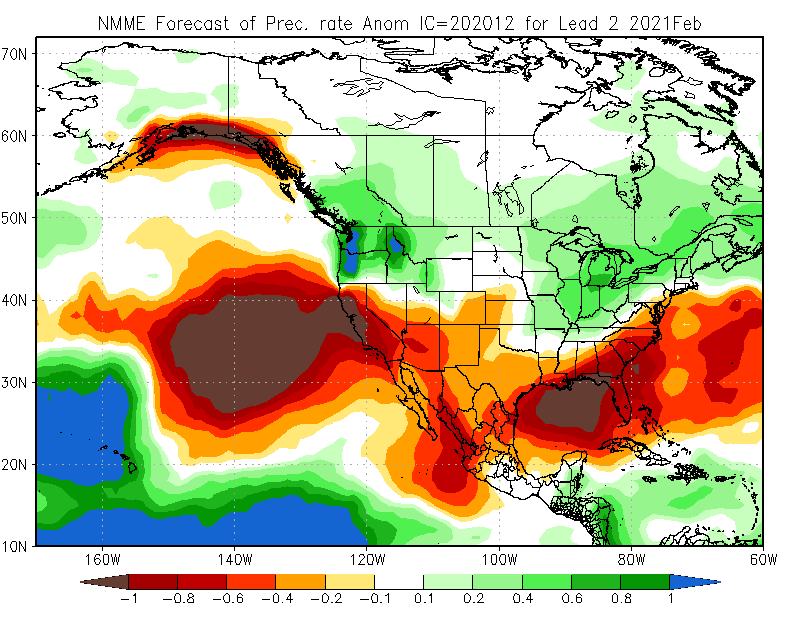
The February forecast suggests precipitation will be above-normal in Washington state, most of Idaho, Oregon, western Montana, much of British Columbia, and western Alberta (Figure 18). California, New Mexico, Utah, Colorado, and Arizona will see below-normal precipitation.
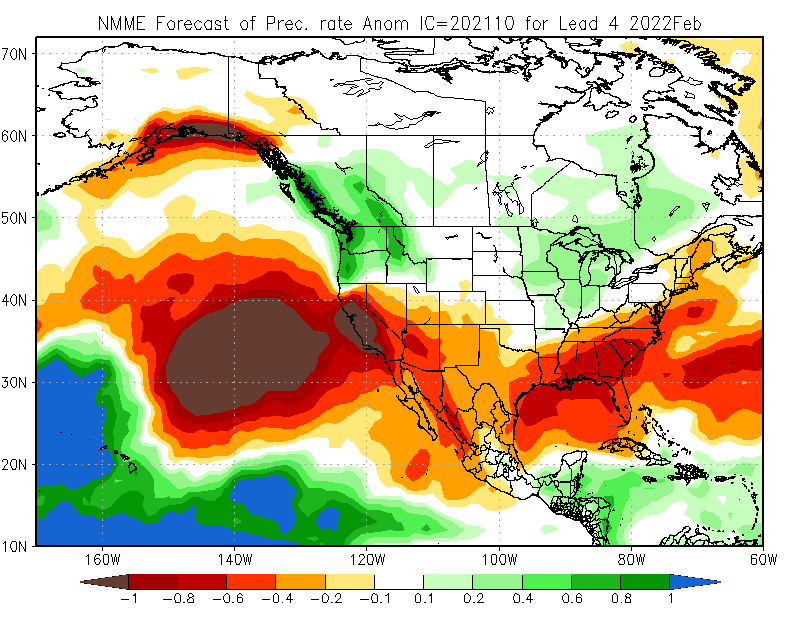
Figure 18. Climate Prediction Center – North American Multi-Model Ensemble precipitation forecast for February 2022. October 2021 model run. Shown is the forecasted precipitation rate anomaly relative to the 1981-2010 thirty-year average.