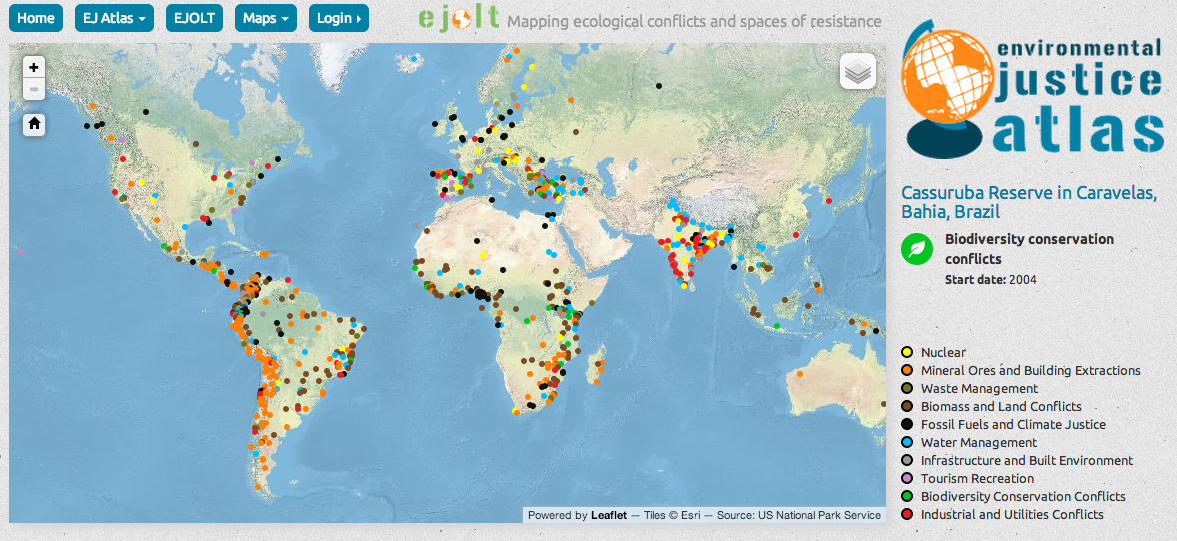
There are ever more good examples of using images to illustrate big data, trends, and connections. A nice example is the Environmental Justice Atlas, an EU project to catalogue “ecological distribution conflicts and confront environmental injustice,” which creates interactive maps of commodities, companies, and types of conflict around the globe.