Category Archives: data analysis

CAQDA ~ helpful hints and resources

Online QDA is a good resource to orient yourself to what computer assisted data analysis is and is not, preparing data for various software programs, and coding.

This site has videos, details about the most commonly used software packages, and useful references throughout.

Resources

QDA Software

ATLASti
DeDoose
The Ethnograph
HyperQualLite
HyperRESEARCH
MAXQDA
NVivo
QDA Miner
TAMS Analyzer
Textalyser
The Observer Collection
VisualText™
webQDA  
WEFT QDA
WordStat

Other Tools

Digital Research Tools Directory: DiRT
Evernote
Storyspace

Coding

Coding is the basic building block of analysis, and while it seems straightforward to code your data, it usually turns out to be quite mysterious.

The first step in any analysis is to remind yourself of the methodology you have chosen, and analysis will be impossible (or at least atheoretical, merely descriptive) if you have not chosen a methodology! This provides the context for first deciding what purpose codes will serve. For example, if you are doing narrative analysis codes may be useful in specific ways related to the methodology, such as:

  1. identifying narrative components, such as characters, time sequences, plot elements
  2. counting particular words, phrases, metaphors, and so on
  3. labelling the concepts within the narrative

So codes can serve many purposes, and even within the same analysis often do serve many purposes. We are often examining the trees, but with an interest in seeing the forest.

Perhaps most commonly we use codes to identify concepts/bigger ideas reflected in our data and then look for intensity of concepts and patterns among concepts. In addition, codes can be counts (of words, phrases, ideas); markers for magnitude (how much of something is present/absent, simplistically perhaps as high, medium and low); and organizational (keeping track of demographics, labelling particularly evocative quotes, or as bookmarks during the coding process). But these purposes should not be muddled together.

Occasionally the question arises: how many codes do I need? There is no answer for this question, you need as many codes as you need for the purpose they serve. And, the number of codes evolves, ebbs and flows, in relation to answering the research questions posed within a particular methodological framework.

Coding, again informed by the tenets of a methodology, may be done inductively (from the bottom up; from the data to theory), deductively (from the top down; testing a theory with the data), or most commonly abductively (moving iteratively back and forth between data and theory). This is a decision that needs to be made explicitly.

Keeping track of codes, used for various purposes and changing, is greatly facilitated by CAQDAS… computer assisted qualitative data analysis software.


Story Maps

A story map visually displays data in relation to places, location, or geography, and story mapping is the process of finding and analyzing the connections among human experience and place. Story maps can be simple or complex, low or high tech. And, story maps help in analyzing complex social issues such as human rights, climate change, refugee resettlement, student transcience, and community integration.

First, a simple example.

In a study of climate change, researchers worked with Ecuadorian subsistence farmers, used Post-It notes to facilitate a community discussion on climate change. Using a map as the basic reference, farmers in the mountainous central Ecuadorian province of Cotopaxi answered three questions: Has your community changed since you were a child? How has the climate changed since then? Are there any past climate-related events that affected you the most?

Responses were posted to the map, illustrating connections between place and observed human (such as illness) and climate (such as agricultural pests) events.

While this data collection and analysis was part of larger mixed methods approach, it illustrates how mapping human experience enhances our understanding of climate change. (Here is the article.)

More sophisticated examples.

Using existing web based templates (like StoryMapJS) or even Google Maps a story can be build that illustrate events and relationships. These tools rely on a narrative that moves through geographical space and the flow can be in space or time and space. An example of the former might be a subway line or interstate highway along which events, places or people can be placed. This story map of the Green Line train in Minneapolis is a good example. A static map example is of Pioneer Square in Seattle as a center for Queer history in that city. An example that combines movement through time and space is a story map illustrating the shifting population throughout USA history.

Often, story maps use GIS (geographical information systems) software, most commonly ArcGIS. Here is a link to Environmental Systems Research Institute, the most common portal for the use of this software, with illustrations from marketing, social science, and natural sciences. There are lots of examples on this website, but this story map of the experience of Rohingya refugees is a good place to start.

Story maps are often web-based, which facilitates interactivity and reveals movement within the story.

What applications might this have in educational research? Here are just a few ideas.

  1. Student mobility is an issue in the lives of some students, the quality of education received, experiences in school, and the experiences of schools. Mapping student mobility within a district or city combined with interviews, performance data, family characteristics, school environment and so on could provide insight into the experience of transcience and help schools plan better for the inevitability of student mobility.
  2. We know standardized test scores correlate as much with social class as with ability. Social class is closely linked to neighbourhoods and so mapping scores onto neighbourhoods, with additional information about income, types of housing, and cost of housing would reveal this relationship succinctly.
  3.  Generally, one might examine issues of space and educational inequality. Inequality that stems from race, ethnicity, or special needs are geographically unevenly distributed and revealing that distribution in communities, districts, schools and even classrooms could be done with story mapping.

Tips on data analysis

Hop over to the QualPage, where Kathryn Roulston has an informative post on strategies and tips for thinking through data analysis.

Becker reminds us that we can only “see” using the ideas that inform our thinking. Since our training as researchers shapes the kinds of ideas we can think with, it is useful to think about how our perceptions are shaped by our individual fields of studies and ways that research is usually done. Becker (1998, p. 18) writes:

… in a strong sense, there aren’t any “facts” independent of the ideas we use to describe them….Recognizing the conceptual shaping of our perceptions, it is still true that not everything our concepts would, in principle, let us see actually turns up in what we look at.

publicity for research brings fame AND scrutiny

Two recent studies have captured the attention of the media and considerable publicity: Alice Goffman’s book On the Run and Michael LaCour’s now retracted Science article. In both cases, the researchers’ work garnered substantial attention in the popular media, and while each also has important possibilities for social change the primary focus has been on how the research was done, including the ethicality of the researchers.

9780226275406Goffman’s work is unusual in academe, research that has so captured the public attention that it has led to a TED talk, a speaking tour, possible TV and movie deals, and a trade paperback reprint. Stunning success for any assistant professor. The University of Chicago Press has had a hand in the promotion of the book, marketing it as one would a trade book including an NPR interview.

Her work has won accolades within academe as well ~ Goffman won the American Sociological Association dissertation award for her work, which is described as a major contribution to the study of U.S. poverty and racial inequality. It has also been favorably reviewed within the discipline ~ here, for example. This is a potentially important study in the wake of recent police violence against Black Americans that especially captured media attention when a white cop killed Michael Brown, a young black man in Ferguson, MO.
RetractionNoticeSSMstudy0515

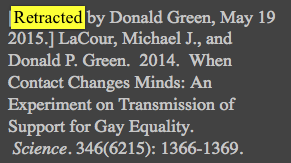
LaCour’s study also won the attention of the popular media because of the incredible claim that people’s views about same sex marriage could be changed through a short conversation with someone who supported the position. Ground breaking findings in political science! This study appeared in a peer reviewed highly regarded journal, one that is directed to a very broad audience of scientists rather than a specific discipline.

The reasons for retracting the paper are as follows: (i) Survey incentives were misrepresented. To encourage participation in the survey, respondents were claimed to have been given cash payments to enroll, to refer family and friends, and to complete multiple surveys. In correspondence received from Michael J. LaCour‘s attorney, he confirmed that no such payments were made. (ii) The statement on sponsorship was false. In the Report, LaCour acknowledged funding from the Williams Institute, the Ford Foundation, and the Evelyn and Walter Haas Jr. Fund. Per correspondence from LaCour‘s attorney, this statement was not true. (ii) The statement on sponsorship was false. In the Report,LaCour acknowledged funding from the Williams Institute, the Ford Foundation, and the Evelyn and Walter Haas Jr. Fund. Per correspondence from LaCour‘s attorney, this statement was not true.

Retraction Watch has chronicled the events around the retraction and responses of the two authors.

Research Issues 

It is a good thing when research findings become part of the public discourse about important issues… that is a critical role for researchers and research in contemporary society. With that publicity (whether fostered by a publisher or a researcher) comes a level of scrutiny perhaps with a spoonful of envy from other researchers. In both these cases, it was other researchers who are calling Goffman and LaCour out.

So what might we learn from these two cases. Here are some initial thoughts.

The Data Record ~ Goffman destroyed her data claiming she needed to protect her research participants and LaCour destroyed his claiming that was standard protocol. Neither position is tenable nor standard practice. While protecting research participants is of critical importance (and too often researchers blithely make a promise they may not be able to keep) but Goffman should be prepared to stand behind her promise and retain her data. And, it would seem now that LaCour may never have had data to destroy, he just said he destroyed it.

Triangulation ~ Goffman was either naive or is depending on the naiveté of her readers. Many of the critiques are reasonable requests for either corroboration, explanation or clarification. One example is her claim that, “The officers told me they had come to the hospital with a shooting victim who was in custody, and as was their custom, they ran the names of the men on the visitors’ list” has been challenged on many levels, including the unlikelihood that hospitals would release this information and that no one (and several researchers have tried) has been able to find hospitals, police departments or officers who actually do this. There are several other examples of this sort.

The onus on any researcher is to ask how to provide the best explanation of their data and this requires looking at those data in different ways, often collecting more data to clarify and test veracity.

Ethics ~ There are two contexts for thinking about research ethics: the ethics of the research practice and then ethics within the research practice. Destroying data isn’t acceptable and the ethics of research practice dictate how and for how long data ought to be kept, how to best maintain confidentiality and anonymity of research participants, honesty about sponsorship, and so on. Both Goffman and LaCour made major mistakes, and one can safely assume they acted purposefully and wrongly. In other words, there is no reason to believe they didn’t know better. LaCour’s fabrications are most egregious and his response has served only to confirm his unethical research practice.

But there is also the ethics within research practice, a much murkier gray area. Researchers, especially those doing the kind of fieldwork Goffman conducted, will necessarily encounter ethical dilemmas that arise as a result of being in the field. Her decision to live in the community she studied, and to live with some of her research participants isn’t a wrong choice (for all the critics that claim this is so, they would deny years of ethnographic research??) but it does inevitably challenge the researcher to make difficult choices. Likewise the criticism that she was not like the research participants (young black men) is an old irrelevant criticism ~ as Brian Fay has argued, “you don’t have to be one to know one.”

A number of critiques of Goffman’s work center on the ethics within research practice and are good fodder for discussions about how to do research well, in ways that respect research participants, and that leave room for researchers to explore areas of social life that may involve the illegal, immoral and unconventional fabric of human existence. These discussions are healthy for research, and the issues raised reinforce the importance of educating novice researchers about ethics beyond the ethics of research practice dictated by institutional conventions, like research review boards.

Grounded Theory ~ a brief note

grounded-theory-new-4-638
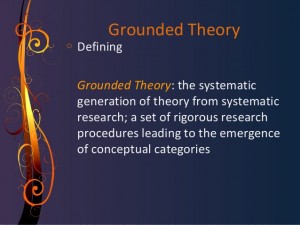
Few research methodologies have been so beguiling as grounded theory. Even when researchers are not working squarely within this methodology, many strategies for data analysis are liberally borrowed from the work of grounded theory methodologists. For those who claim to be doing grounded theory, the ground on which they stand has and continues to shift from the original positions proffered by Glaser & Strauss in the mid 60s. Most especially Glaser’s realist ontology has been left behind.

Certainly, Juliet Corbin pushed that process along in her 9780857029140collaborations with Anselm Strauss and more recently Kathy Charmaz has offered what she calls a constructivist grounded theory approach. On the latter, you can watch this interview with Charmaz that clarifies her view, one that I think captures the emerging contemporary stance on grounded theory.

The use of prior empirical and theoretical literature is a key idea in contemporary grounded theory… the old school notion of avoiding all prior knowledge has been largely set aside in favor of abductive reasoning that sees the researcher traveling back and forth between their empirical data and relevant literature.

Grounded theory has also taken a more narrative turn, emphasizing more literary writing and more acknowledgement of the centrality of the researcher to the analysis. Nonetheless, grounded theory remains unique in the search for a core category, that theoretical idea that integrates the various aspects of the theoretical explanation. (See, for example, this recent article The San Miguel Project.)


Metaphors: how they help us to understand social life (and maybe make positive change)

I’ve written a few posts about metaphors  including their centrality to how knowledge about and action in the social world is constructed [The Power of Metaphors] and how to use a metaphoric lens during data analysis [Making Sense of Metaphors].

People use metaphors often as a short-hand, a way to capture complex ideas and relationships; to direct attention in a particular way; and often to present a moral view. In British Columbia where I live the province is in the midst of a fairly pitched battle between the teachers union and the government (ok so I’ve already tipped my hand in terms of the metaphor I use in talking about these labor relations). A rising chorus of voices have begun to use the metaphor of labor relations as marriage, not surprisingly since both the teachers union and the government claim to have the best interests of children at heart.

The labor relations as marriage works on a number of levels and not on many others. But, it is dominant in the media, the rhetoric of the union and the government, school administrators, students, and analysts. So, it needs to be taken seriously to understand the impasse in negotiations (and indeed the now decade old acrimonious relationship between the two) and using this understanding to both think and then act differently.

arguing-parents610px

Here’s a link to the article:  Does It Help to Say the BC Teachers and the Government are in a Bad Marriage?


Narrative Analysis Tools

TV Tropes is a rich wiki repository of resources described as tricks of the trade for writing fiction, but as social scientists we borrow as needed in trying to understand and explain the social world. The emphasis is on tropes, which are described as:

Tropes are devices and conventions that a writer can reasonably rely on as being present in the audience members’ minds and expectations. On the whole, tropes are not clichés. The word clichéd means “stereotyped and trite.” In other words, dull and uninteresting. We are not looking for dull and uninteresting entries. We are here to recognize tropes and play with them, not to make fun of them… Since a lot of art, especially the popular arts, do their best to reflect life, tropes are likely to show up everywhere.

Narrative analysis can be facilitated by looking at the tropes at the centre of the stories we are investigating, and in the section on narrative devices one can investigate a range of possibilities. Tropes are named (such as “always need what you gave up,” “dead end job,” “dramatic irony,” “fighting for survival,” “human shield,” “I just want to be normal,” “shapeshifting,” “with due respect”), a short explanation is provided and links to many examples are given.

Other sections focus on characters, plot, setting and so on.

The wiki is a rich resource, every changing, including such gems as the Periodic Table of Storytelling.