Category Archives: technology

CAQDA ~ helpful hints and resources

Online QDA is a good resource to orient yourself to what computer assisted data analysis is and is not, preparing data for various software programs, and coding.

This site has videos, details about the most commonly used software packages, and useful references throughout.

Resources

QDA Software

ATLASti
DeDoose
The Ethnograph
HyperQualLite
HyperRESEARCH
MAXQDA
NVivo
QDA Miner
TAMS Analyzer
Textalyser
The Observer Collection
VisualText™
webQDA  
WEFT QDA
WordStat

Other Tools

Digital Research Tools Directory: DiRT
Evernote
Storyspace

Coding

Coding is the basic building block of analysis, and while it seems straightforward to code your data, it usually turns out to be quite mysterious.

The first step in any analysis is to remind yourself of the methodology you have chosen, and analysis will be impossible (or at least atheoretical, merely descriptive) if you have not chosen a methodology! This provides the context for first deciding what purpose codes will serve. For example, if you are doing narrative analysis codes may be useful in specific ways related to the methodology, such as:

  1. identifying narrative components, such as characters, time sequences, plot elements
  2. counting particular words, phrases, metaphors, and so on
  3. labelling the concepts within the narrative

So codes can serve many purposes, and even within the same analysis often do serve many purposes. We are often examining the trees, but with an interest in seeing the forest.

Perhaps most commonly we use codes to identify concepts/bigger ideas reflected in our data and then look for intensity of concepts and patterns among concepts. In addition, codes can be counts (of words, phrases, ideas); markers for magnitude (how much of something is present/absent, simplistically perhaps as high, medium and low); and organizational (keeping track of demographics, labelling particularly evocative quotes, or as bookmarks during the coding process). But these purposes should not be muddled together.

Occasionally the question arises: how many codes do I need? There is no answer for this question, you need as many codes as you need for the purpose they serve. And, the number of codes evolves, ebbs and flows, in relation to answering the research questions posed within a particular methodological framework.

Coding, again informed by the tenets of a methodology, may be done inductively (from the bottom up; from the data to theory), deductively (from the top down; testing a theory with the data), or most commonly abductively (moving iteratively back and forth between data and theory). This is a decision that needs to be made explicitly.

Keeping track of codes, used for various purposes and changing, is greatly facilitated by CAQDAS… computer assisted qualitative data analysis software.


Story Maps

A story map visually displays data in relation to places, location, or geography, and story mapping is the process of finding and analyzing the connections among human experience and place. Story maps can be simple or complex, low or high tech. And, story maps help in analyzing complex social issues such as human rights, climate change, refugee resettlement, student transcience, and community integration.

First, a simple example.

In a study of climate change, researchers worked with Ecuadorian subsistence farmers, used Post-It notes to facilitate a community discussion on climate change. Using a map as the basic reference, farmers in the mountainous central Ecuadorian province of Cotopaxi answered three questions: Has your community changed since you were a child? How has the climate changed since then? Are there any past climate-related events that affected you the most?

Responses were posted to the map, illustrating connections between place and observed human (such as illness) and climate (such as agricultural pests) events.

While this data collection and analysis was part of larger mixed methods approach, it illustrates how mapping human experience enhances our understanding of climate change. (Here is the article.)

More sophisticated examples.

Using existing web based templates (like StoryMapJS) or even Google Maps a story can be build that illustrate events and relationships. These tools rely on a narrative that moves through geographical space and the flow can be in space or time and space. An example of the former might be a subway line or interstate highway along which events, places or people can be placed. This story map of the Green Line train in Minneapolis is a good example. A static map example is of Pioneer Square in Seattle as a center for Queer history in that city. An example that combines movement through time and space is a story map illustrating the shifting population throughout USA history.

Often, story maps use GIS (geographical information systems) software, most commonly ArcGIS. Here is a link to Environmental Systems Research Institute, the most common portal for the use of this software, with illustrations from marketing, social science, and natural sciences. There are lots of examples on this website, but this story map of the experience of Rohingya refugees is a good place to start.

Story maps are often web-based, which facilitates interactivity and reveals movement within the story.

What applications might this have in educational research? Here are just a few ideas.

  1. Student mobility is an issue in the lives of some students, the quality of education received, experiences in school, and the experiences of schools. Mapping student mobility within a district or city combined with interviews, performance data, family characteristics, school environment and so on could provide insight into the experience of transcience and help schools plan better for the inevitability of student mobility.
  2. We know standardized test scores correlate as much with social class as with ability. Social class is closely linked to neighbourhoods and so mapping scores onto neighbourhoods, with additional information about income, types of housing, and cost of housing would reveal this relationship succinctly.
  3.  Generally, one might examine issues of space and educational inequality. Inequality that stems from race, ethnicity, or special needs are geographically unevenly distributed and revealing that distribution in communities, districts, schools and even classrooms could be done with story mapping.

crowdsourcing ~ research possibilities

crowdsourcing |ˈkroudˌsôrsiNG|
noun
the practice whereby an organization enlists a variety of freelancers, paid or unpaid, to work on a specific task or problem

Social scientists have traditionally felt a need to tightly control how they get their data, who should provide the data and how are seen as key features of good research. But, we might take note of the ways other scientists (biologists, astronomers, mathematicians, ornithologists, and geologists, for example) are capitalizing on the lived experiences of people to help them collect and analyze data on natural phenomena.

The Case of Citizen Scientists

Many research projects now involve collecting or analyzing huge amounts of data, and both tasks are sometimes beyond the resources of an individual researcher or research team. Crowdsourcing the research tasks is being used in an increasing number of projects, mobilizing the general citizenry’s interest in science. Screen Shot 2015-06-09 at 1.36.04 PM

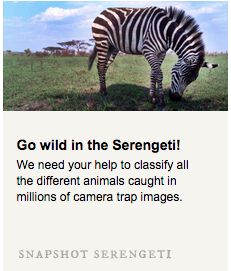
There is one web-based platform that has facilitated these research tasks; check out Zooniverse, which creates citizen science websites that allow anyone with an interest to participate in research online. These projects call on citizen scientists to help with data analysis. One recent example is Snapshot Serengeti, a website with photos taken in Serengeti National Park, Tanzania. Anyone with an internet connection can help classify the different animals caught in millions of camera trap images.

Crowdhydrology

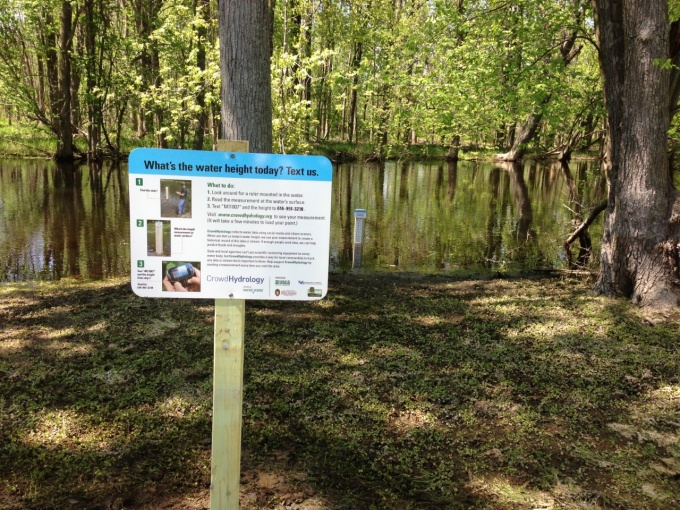
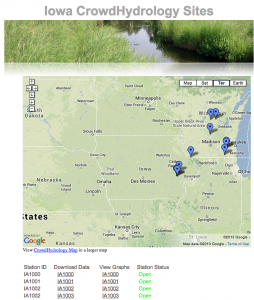
Chris Lowry a University of Buffalo assistant professor of geology has developed Crowdhydrology, a project that enlists hikers, fishermen, birdwatchers, school kids and nature-lovers to monitor stream levels in NYS, Michigan, Wisconsin and Iowa. The idea is simple ~ at each site there is a giant measuring stick and a sign explaining how passersby can text water levels and stream locations to researchers. Citizens  in this project participate in data collection, contributing to research on hydrology. The data collected are public and available on the CrowdHydrology website, which describes the project thusly…

“The CrowdHydrology mission is to create freely available data on stream stage in a simple and inexpensive way. We do this through the use of “crowd sourcing”, which means we gather information on stream stage (water levels) from anyone willing to send us a text message of the water levels at their local stream. These data are then available for anyone to then use from Universities to Elementary schools.”

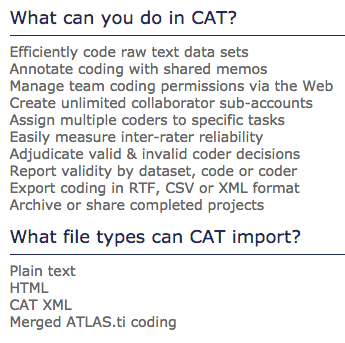
This is the interface that allows anyone to view or download the data.

Crowdsourcing for Social Science Research?

So imagine how social scientists might use crowdsourcing to investigate social issues and human phenomena. One example is a project in Egypt that gives women an opportunity to document rape, harassment and assault ~ Harrassmap tracks incidents of sexual harassment in the Greater Cairo area with the goal of understanding and changing the social acceptability of gender based violence. Social phenomena that are experienced or witnessed (safety, anxiety, happiness, bullying, crime, kindness, road rage, drug use, oppression) are all potentially chronicled, mapped and understood through crowdsourcing.

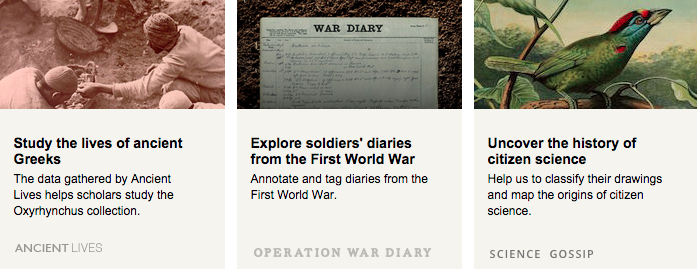
Also, check out the humanities projects on Zooniverse.

Screen Shot 2015-06-09 at 1.38.25 PM

A key issue in the successful use of crowdsourcing in the social sciences is that scientists do retain some control of the research questions and what counts as useful data, crowdsourcing as data collection ought not to mistake participation in data generation with expertise in the research topic.

crowd sourcing images as data

Crowd sourcing is an interesting strategy for data collection that I’ve written about and you can read about it here. Here is another example of crowd sourcing images around a topic, in this case the use of photo-sharing service Instagram asking teachers to  post photos throughout the day capturing moments they saw as representative of their daily lives as educators. There is a rich potential to answer a wide range of research questions with these images as the data set.

Screen Shot 2014-07-03 at 8.48.17 AM 

Google Glass ~ a data collection tool?

Field work depends on researcher’s senses, maybe most especially their eyes and ears, and given the participant observer role we rely on our memory to reconstruct our experiences into field notes, the foundation for our analysis. Sometimes we are in contexts (like classrooms or meetings) where note taking is facilitated by computers or smart pens. One wonders if recording devices that just come along with us and record what is going on might be useful for researchers. For example, the GoPro, strapped to your head or chest, is now standard equipment for sports enthusiasts to capture their accomplishments or nature enthusiasts their surroundings. It might well be the means to record that ritual or interaction your research focuses on, but it might also be a bit intrusive. YouTube Preview Image

Google Glass is definitely more stylish, less obtrusive, and provides interactive capabilities. It’s in the beta stage, what Google is calling the Explorer Program and if a space is available you could be an early adopter for the cost $1500, that is if you live in the USA. In short you tell it what to do, take a picture or video, which you can share, send a message, look up information. The example below shows some of its capabilities. Imagine a research context that would allow you to record what you see, do and to share and connect that with other researchers and research participants. Video ethnography on the go?
YouTube Preview Image

Google Glass has been controversial when people wear them as a matter of course in their daily lives creating exaggerated tensions in an already surveillance rich society (smart phones being the obvious device). But used in a research context, where people have accepted the researcher’s role as a recorder of events, interactions, and talk, these controversies might be obviated.

A classic is back ~ new edition of Miles & Huberman’s Qualitative Data Analysis

With Johnny Saldaña as a new third author to the ghosts of Matt Miles and Michael Huberman, a new edition of this classic text on qualitative data analysis is back. This 3rd edition stays true to Miles’ & Huberman’s original organization and ideas, but is significantly updated with the inclusion of more information on computer based analysis and specific approaches to qualitative research emerging over the past few decades. The new edition ends with a very good list of resources for qualitative researchers.