In class

At home

School of Architecture and Landscape Architecture (SALA), University of British Columbia
Assignment 4:
In Class:
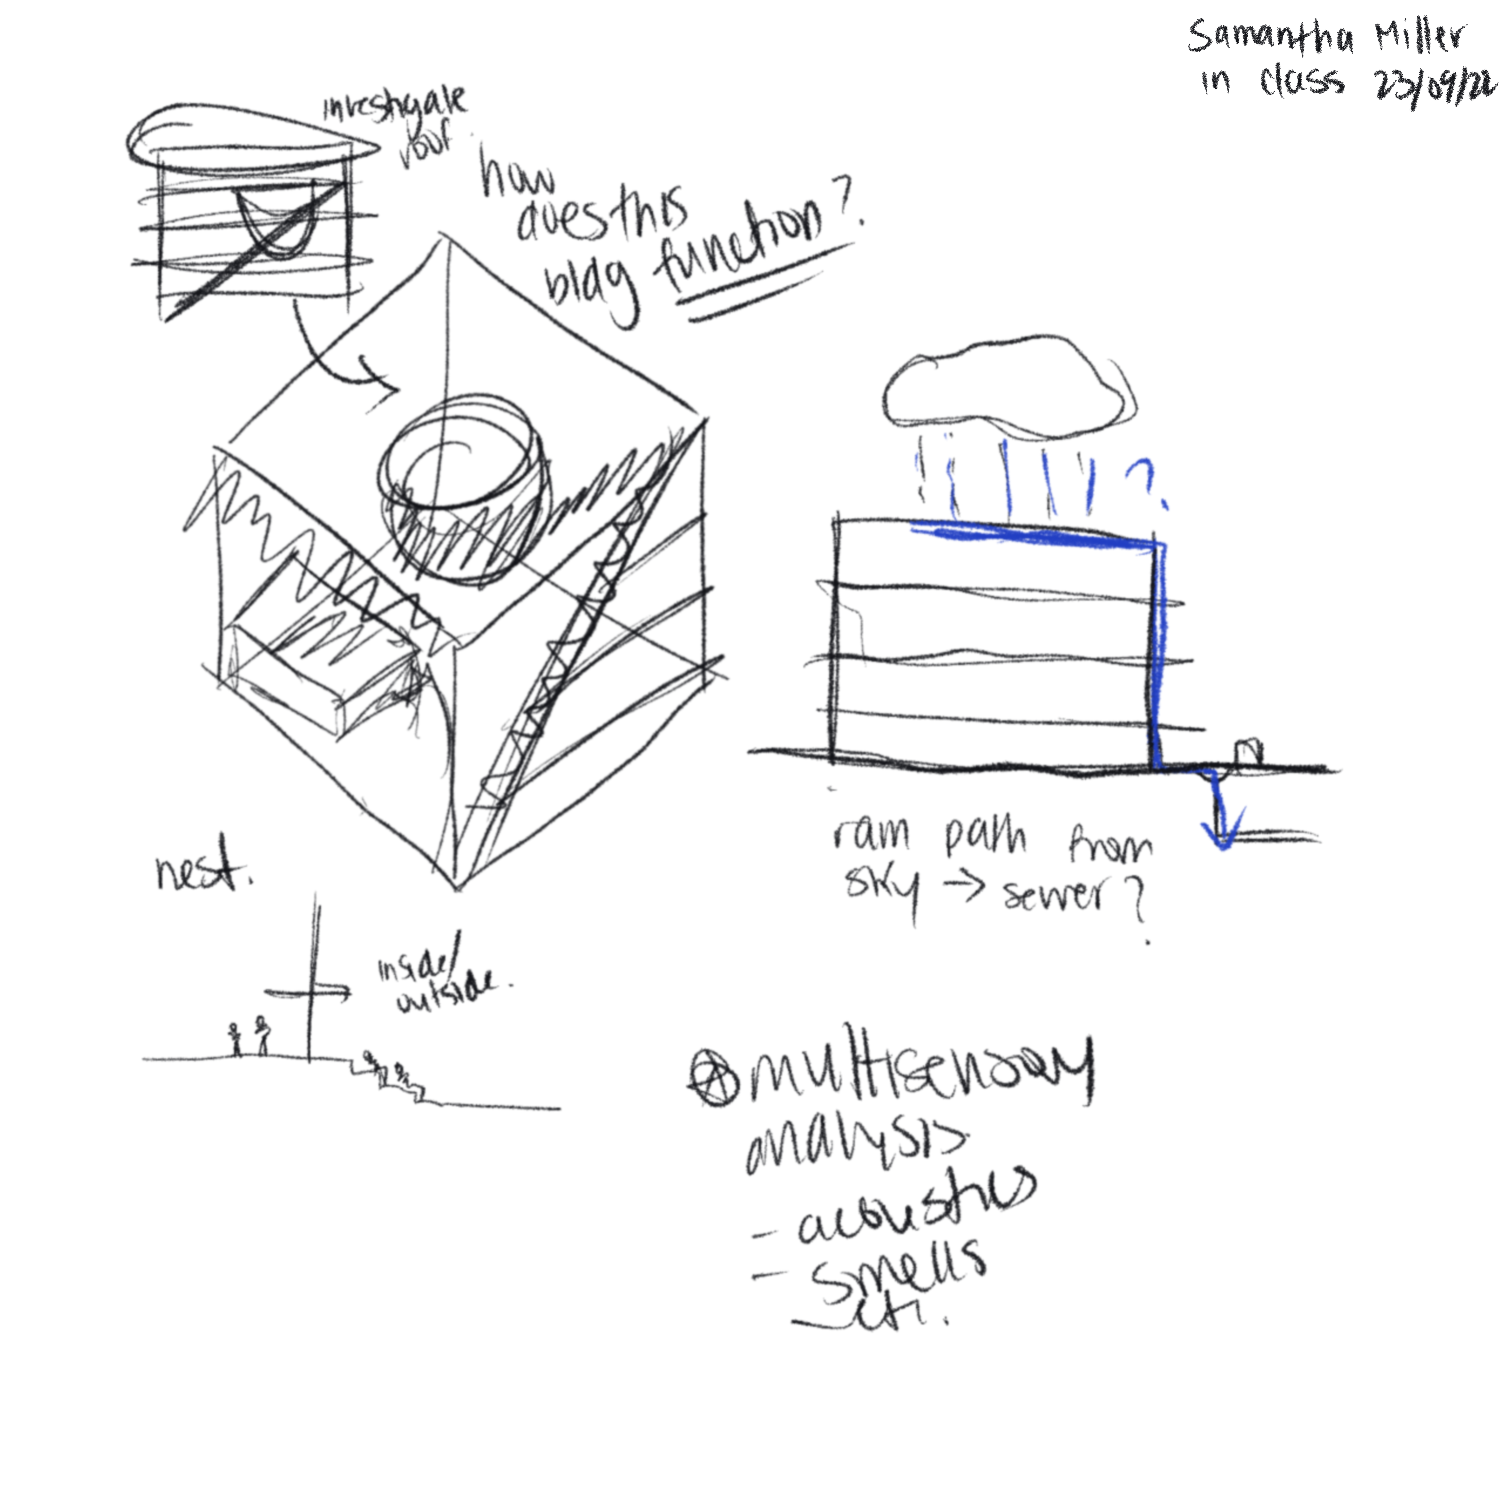
UBC Nest Rooftop Garden Moments
Views Down: Shadows Throughout the day
Movement of the birds and the bees
2 Hours of Clouds and Wind

People Moving Throughout the Roof
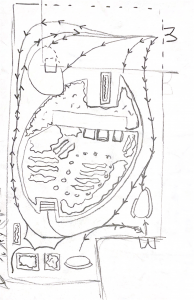
Sunflowers follow the Sun
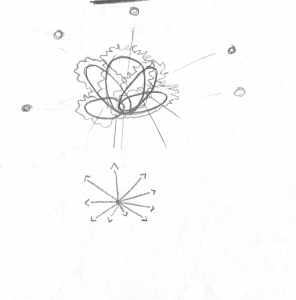
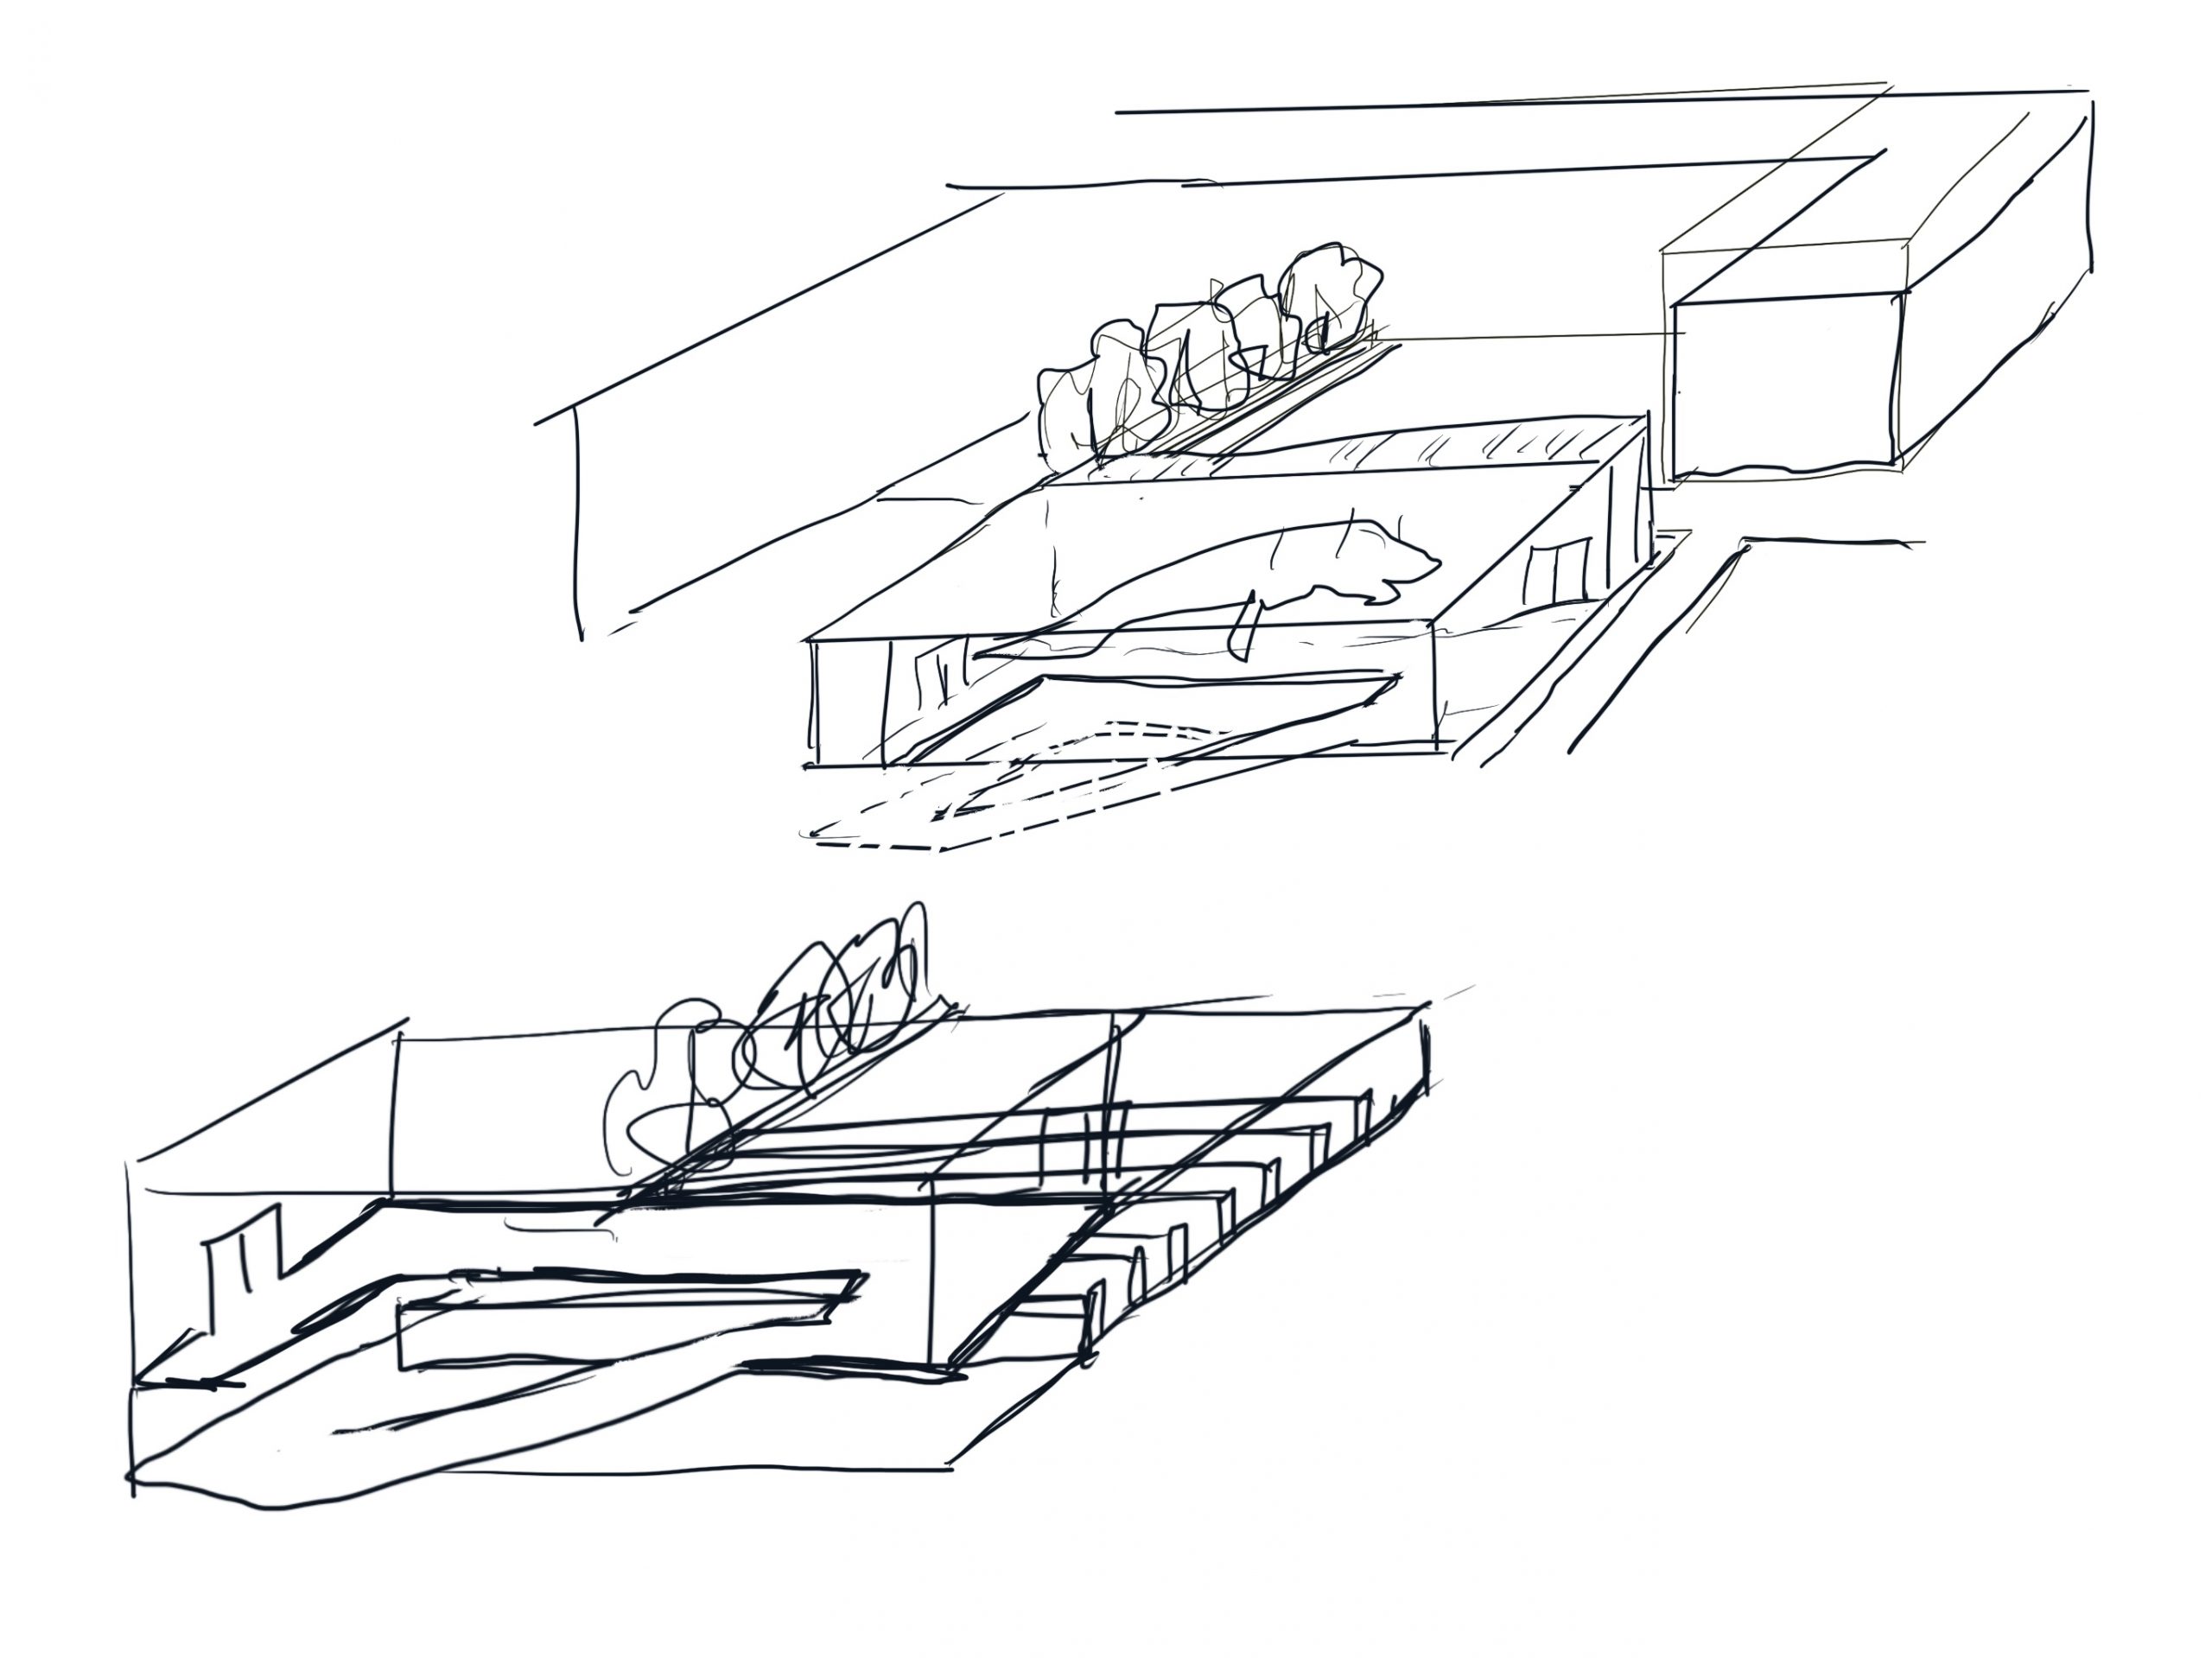
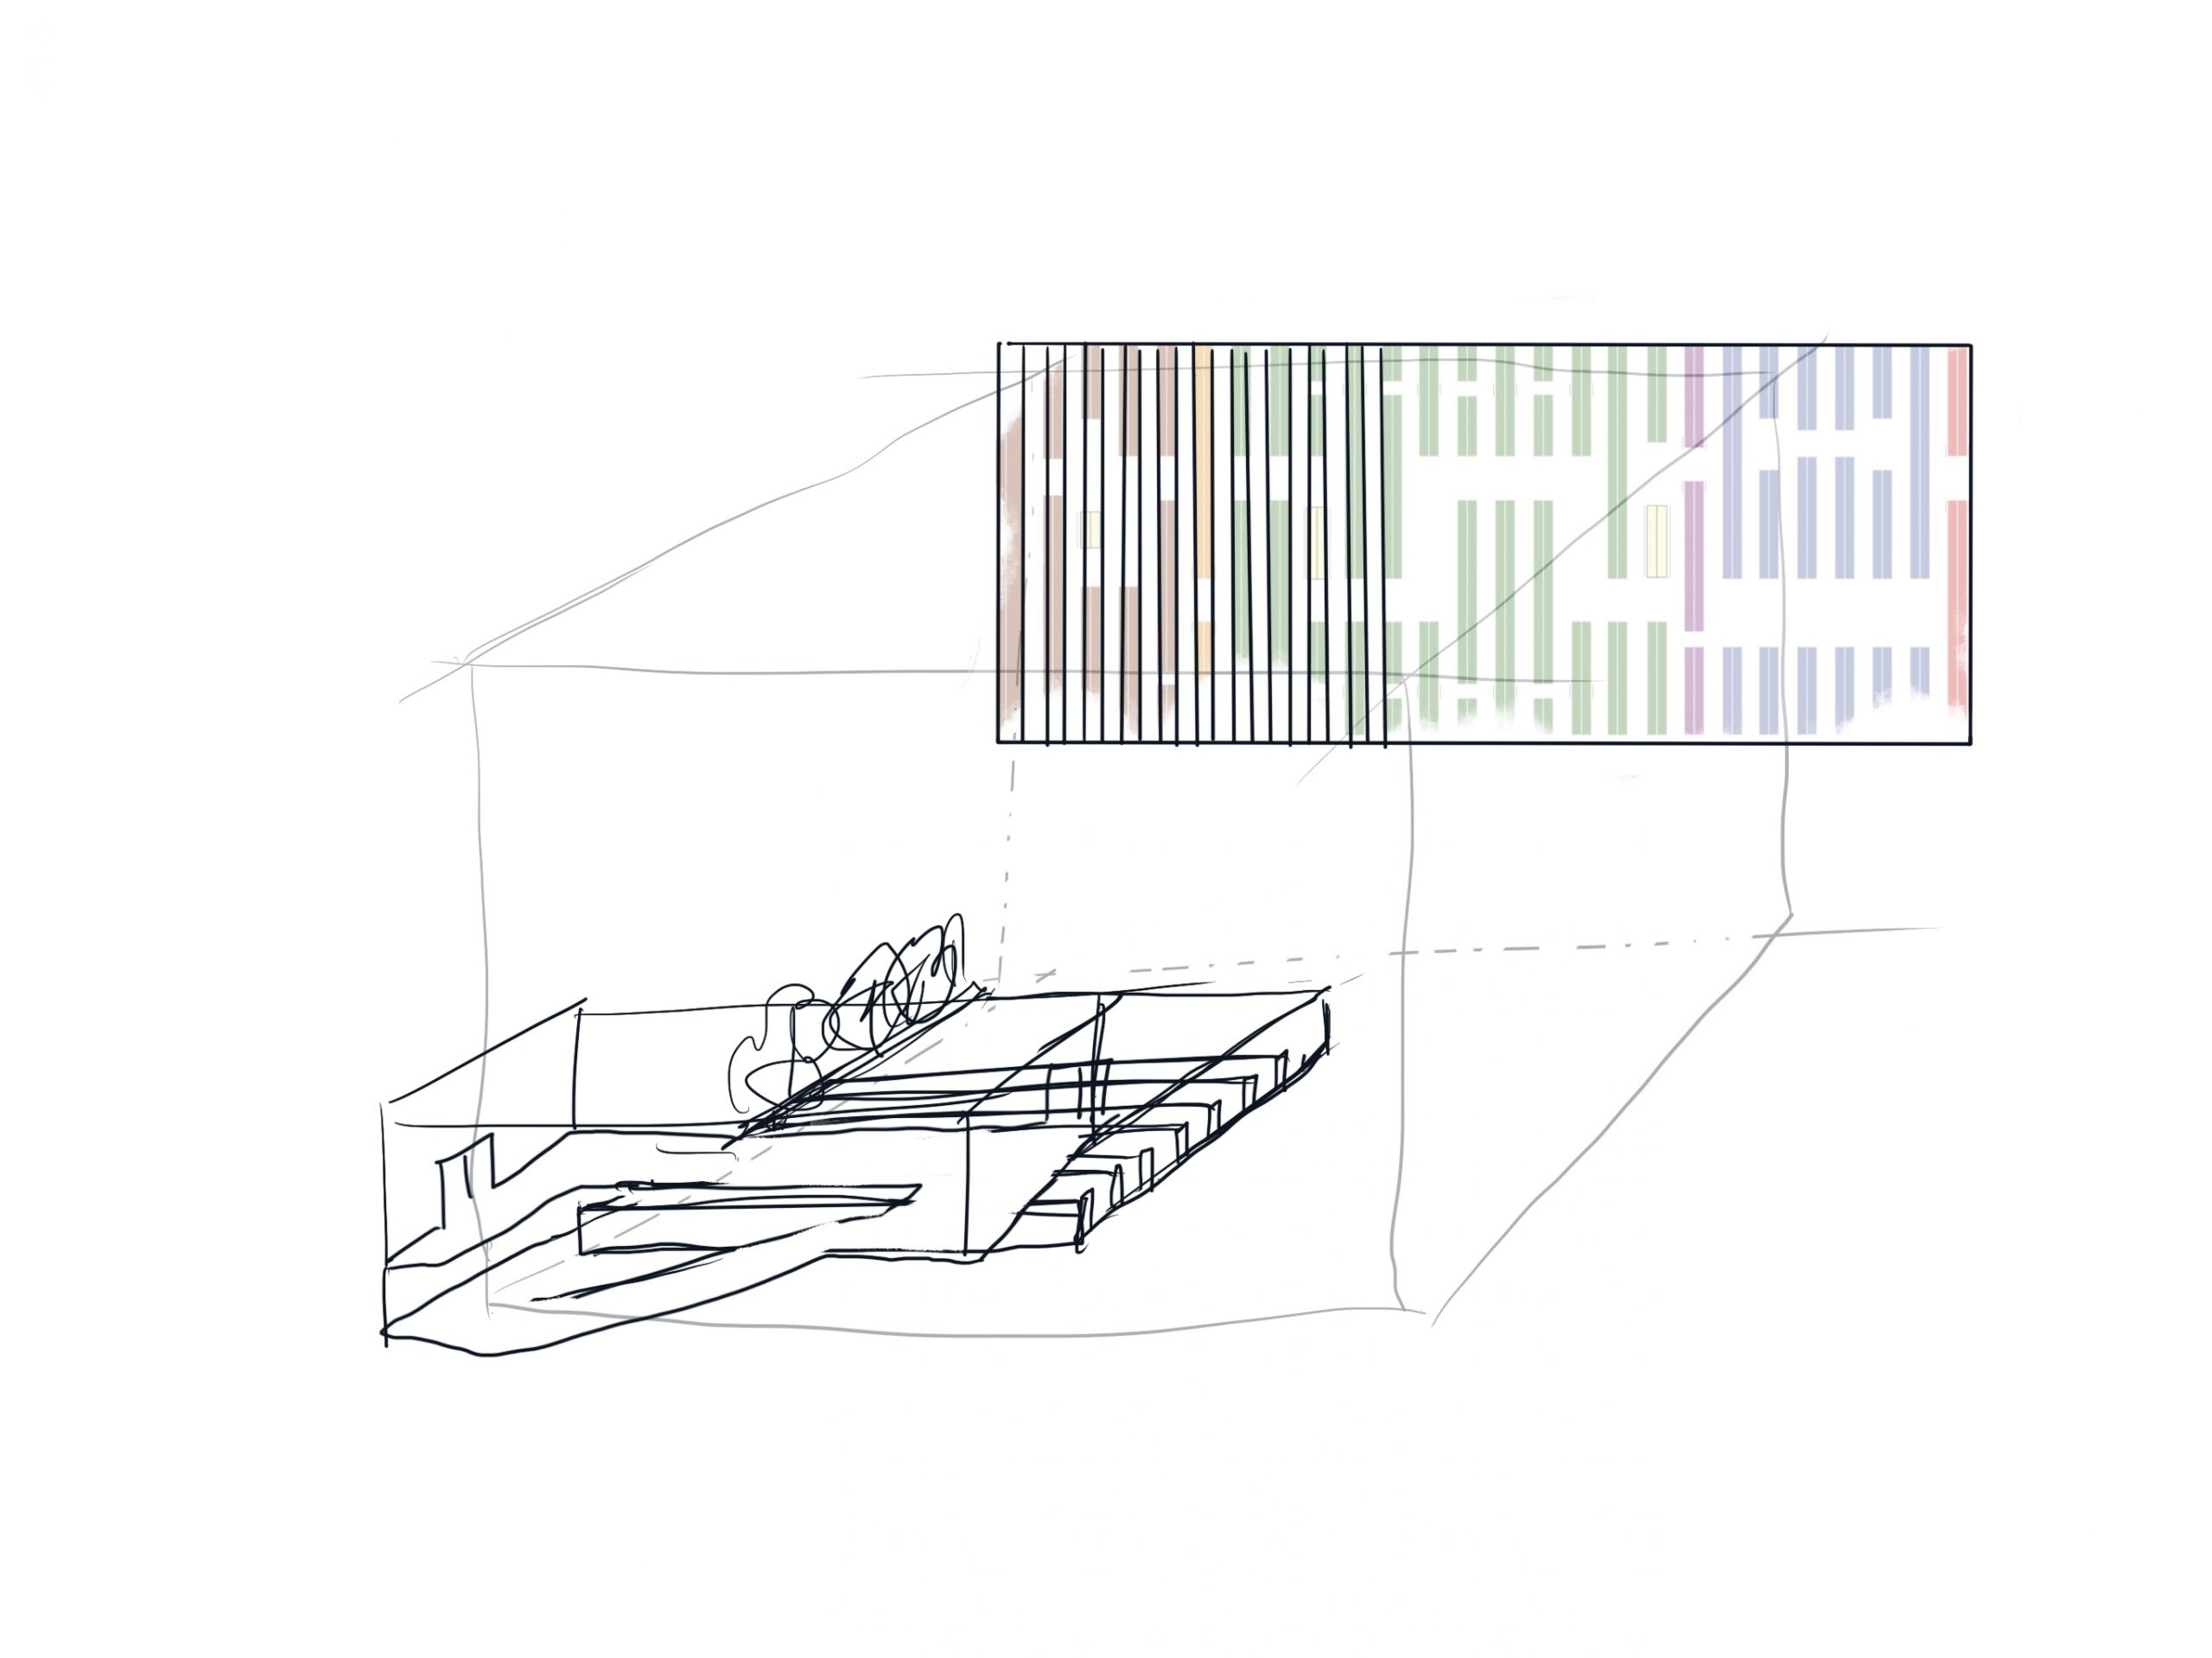
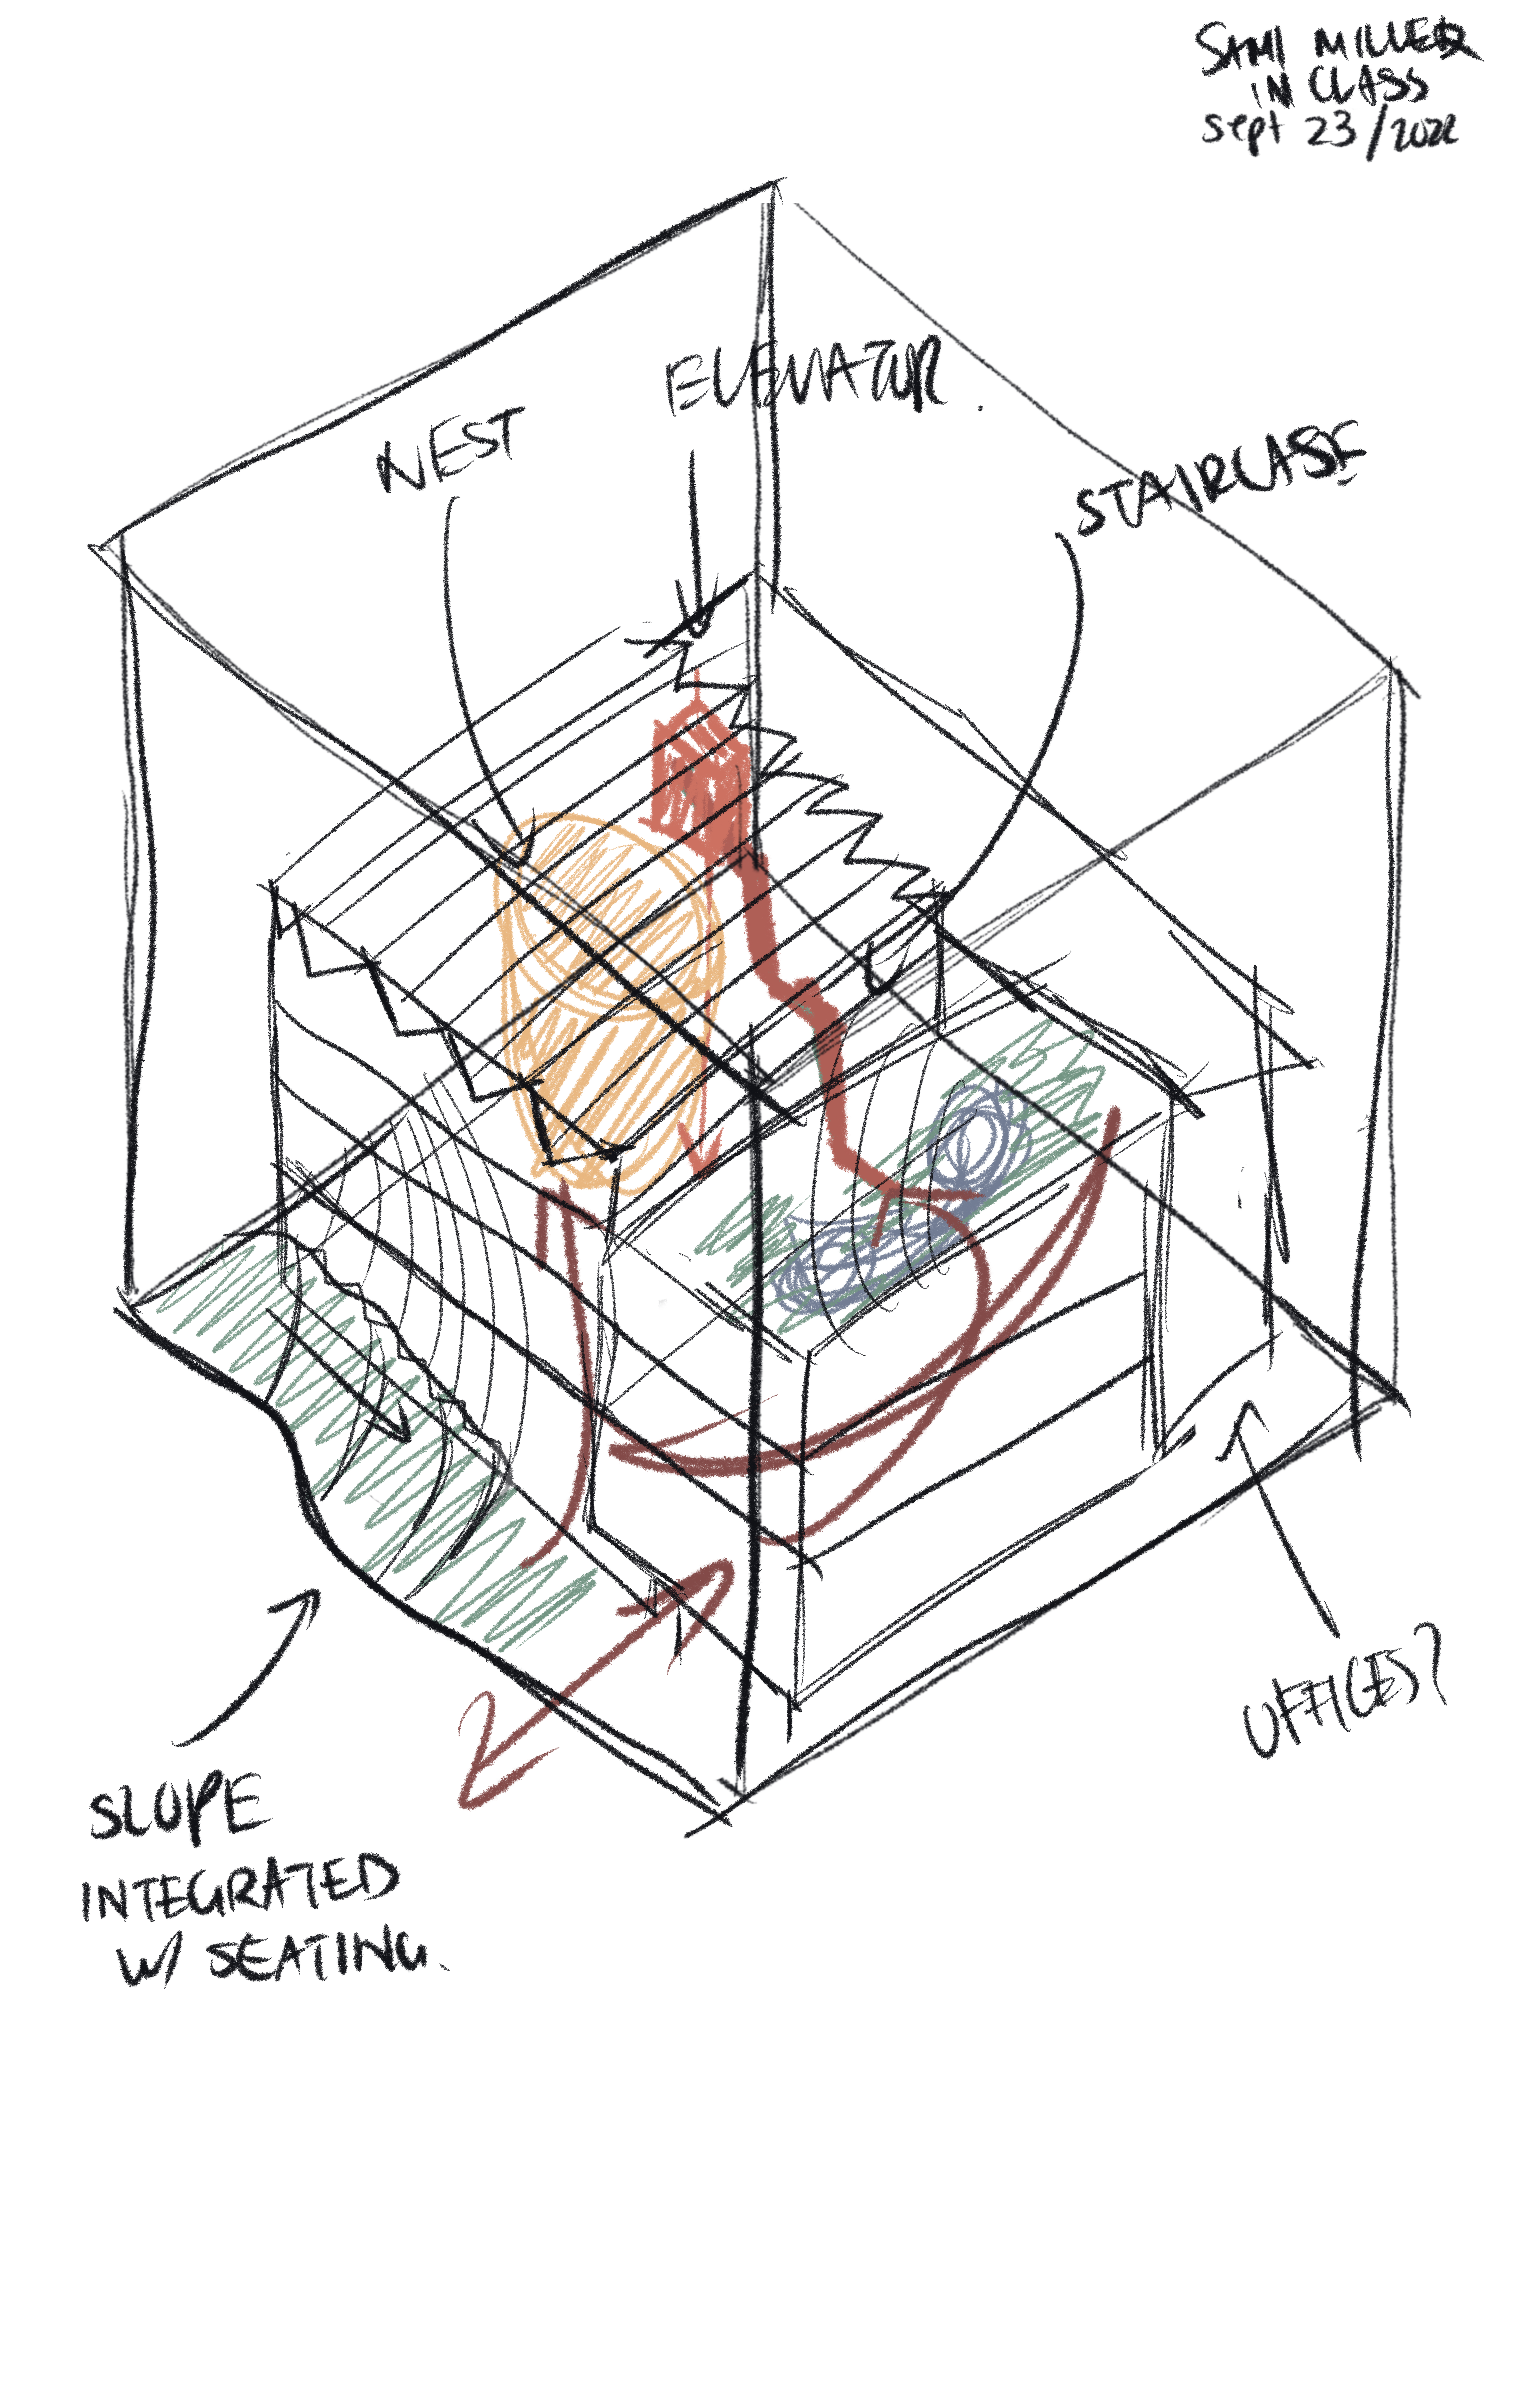
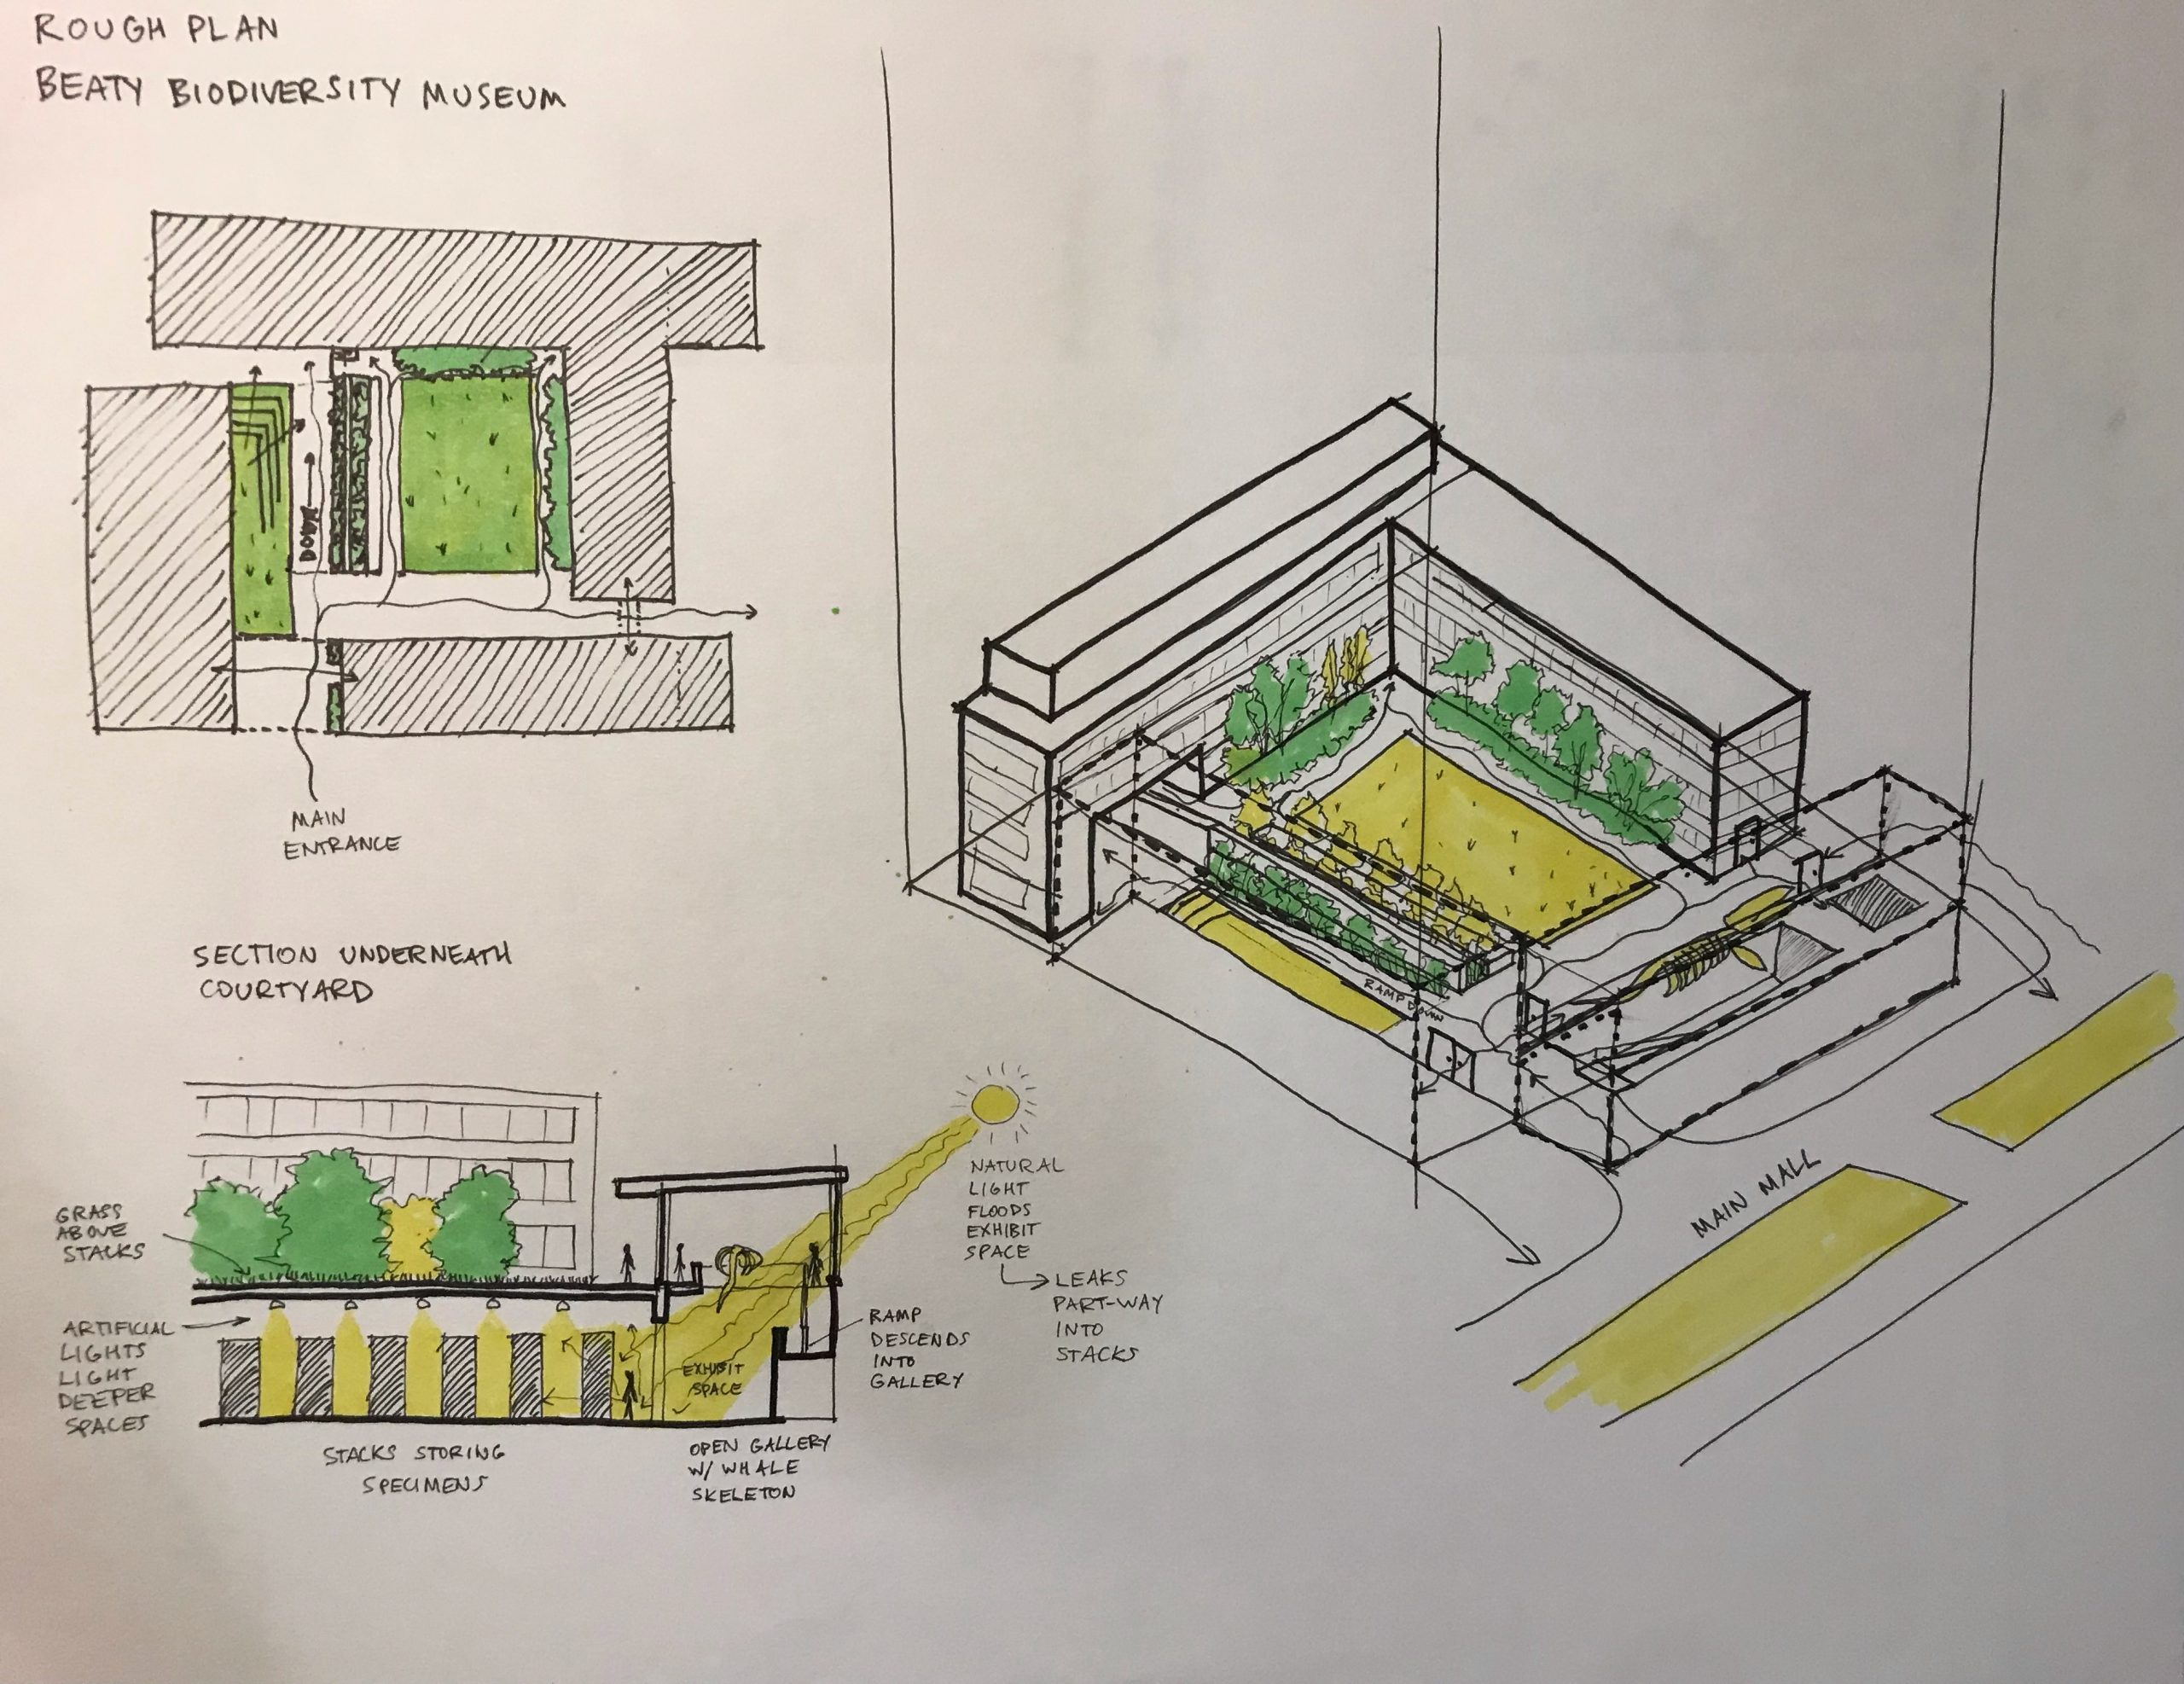
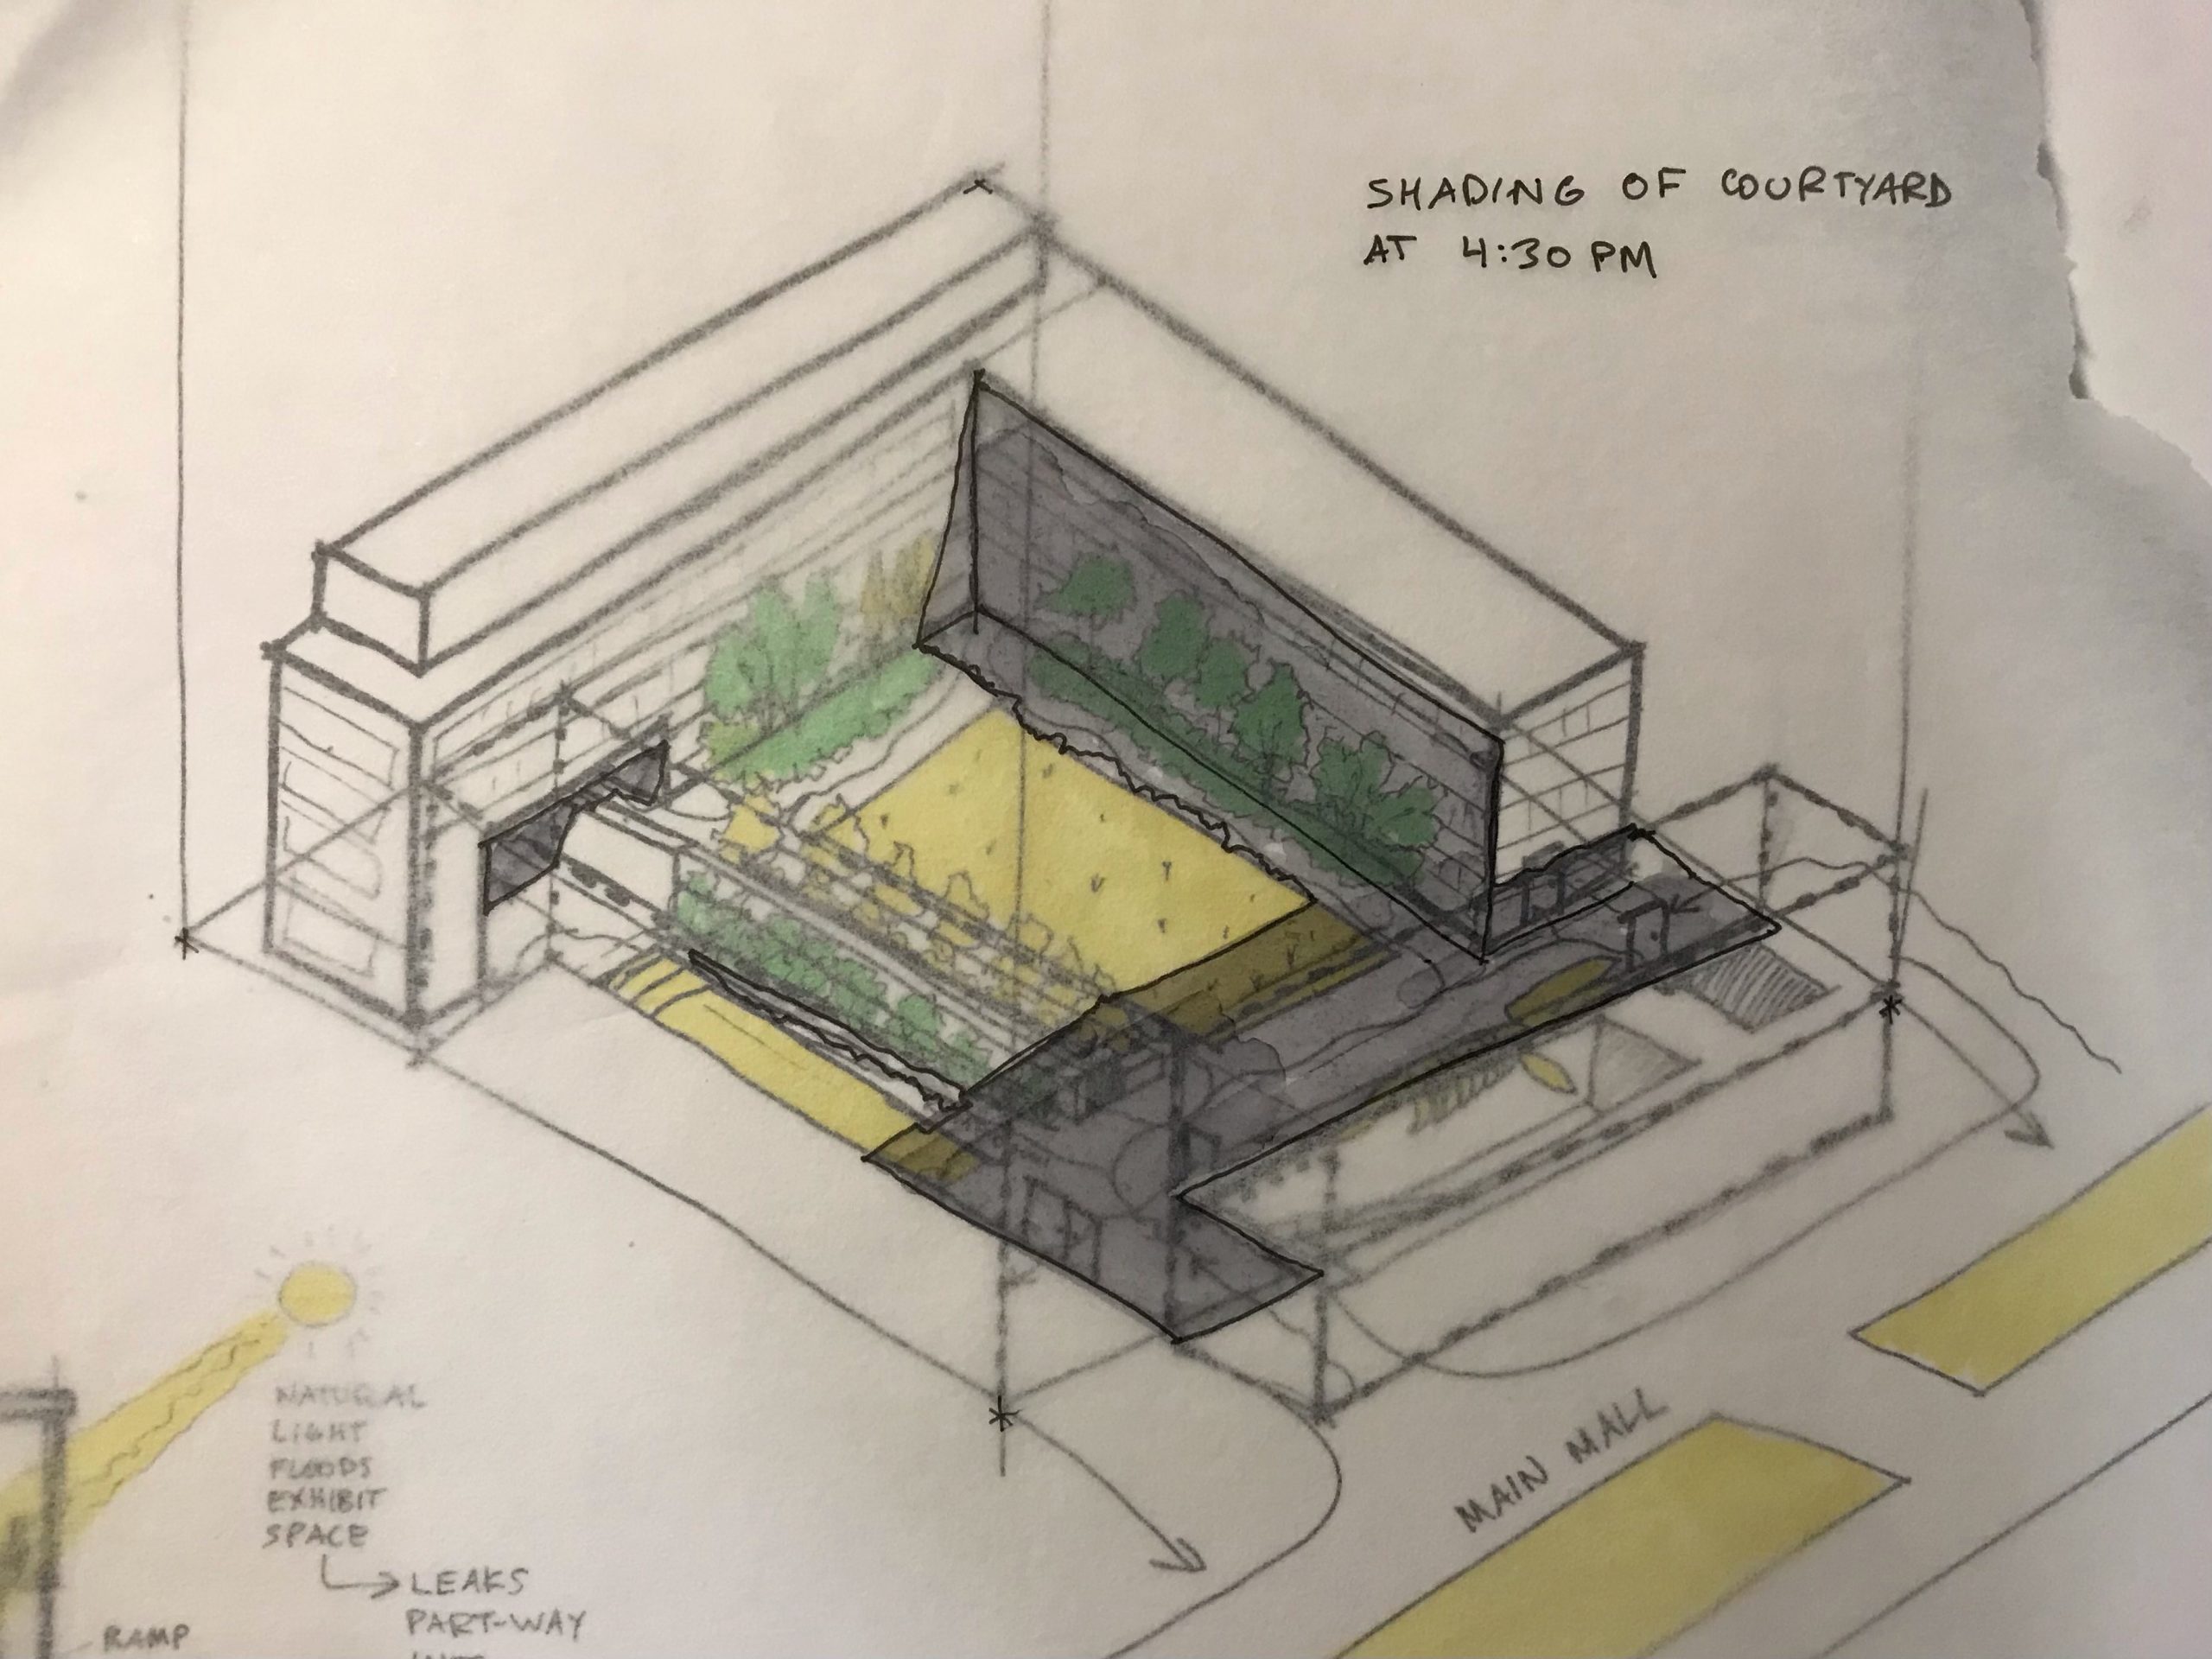
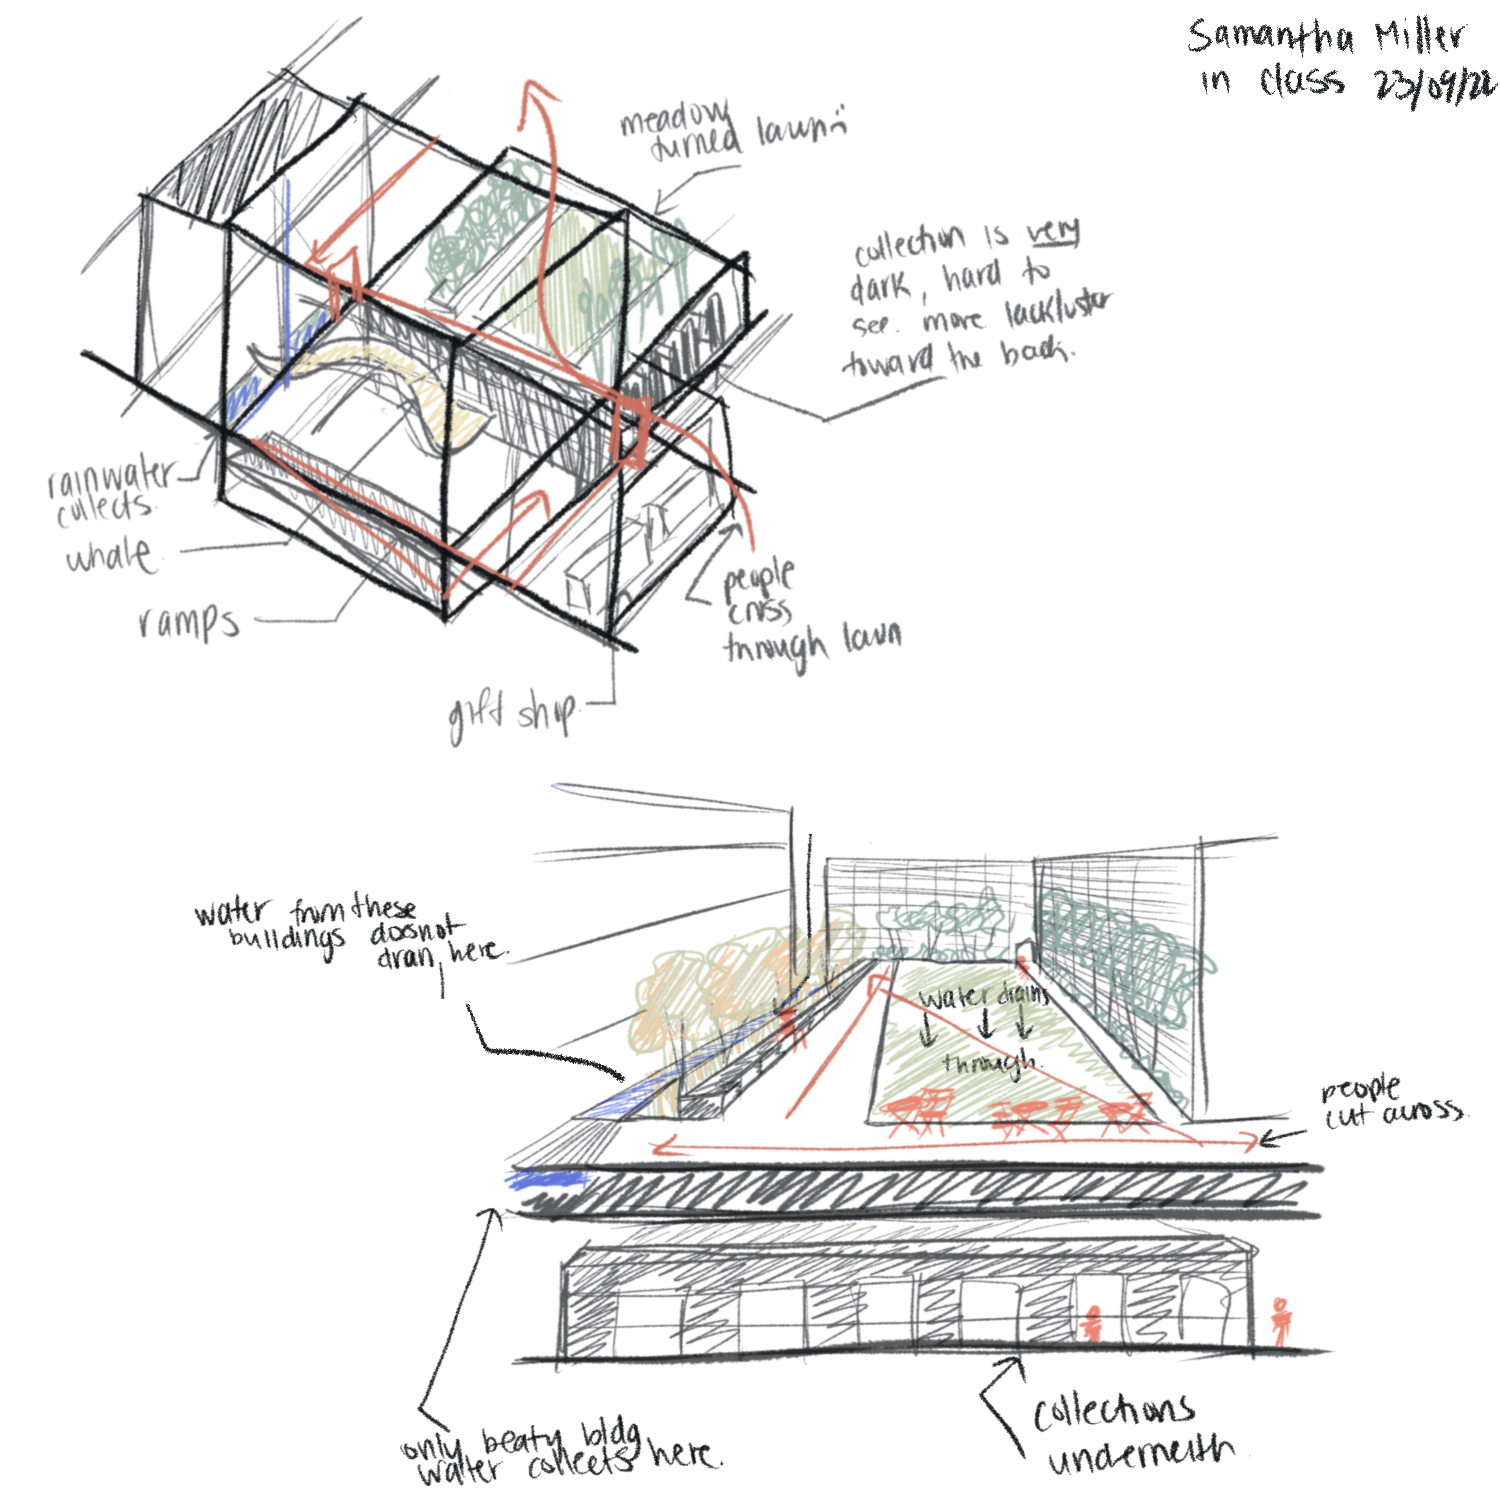
In Class Drawing from UBC Nest and Beatty Museum
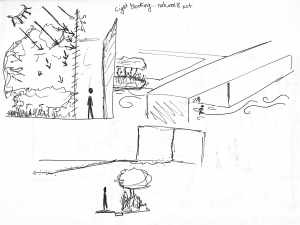
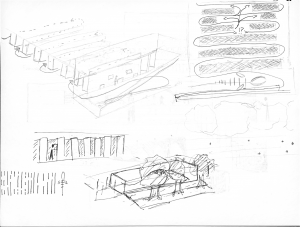

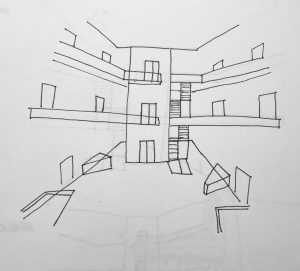
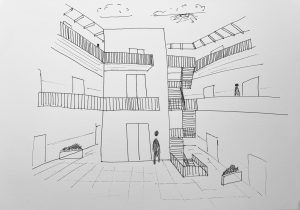
Beatty Circulation Networks
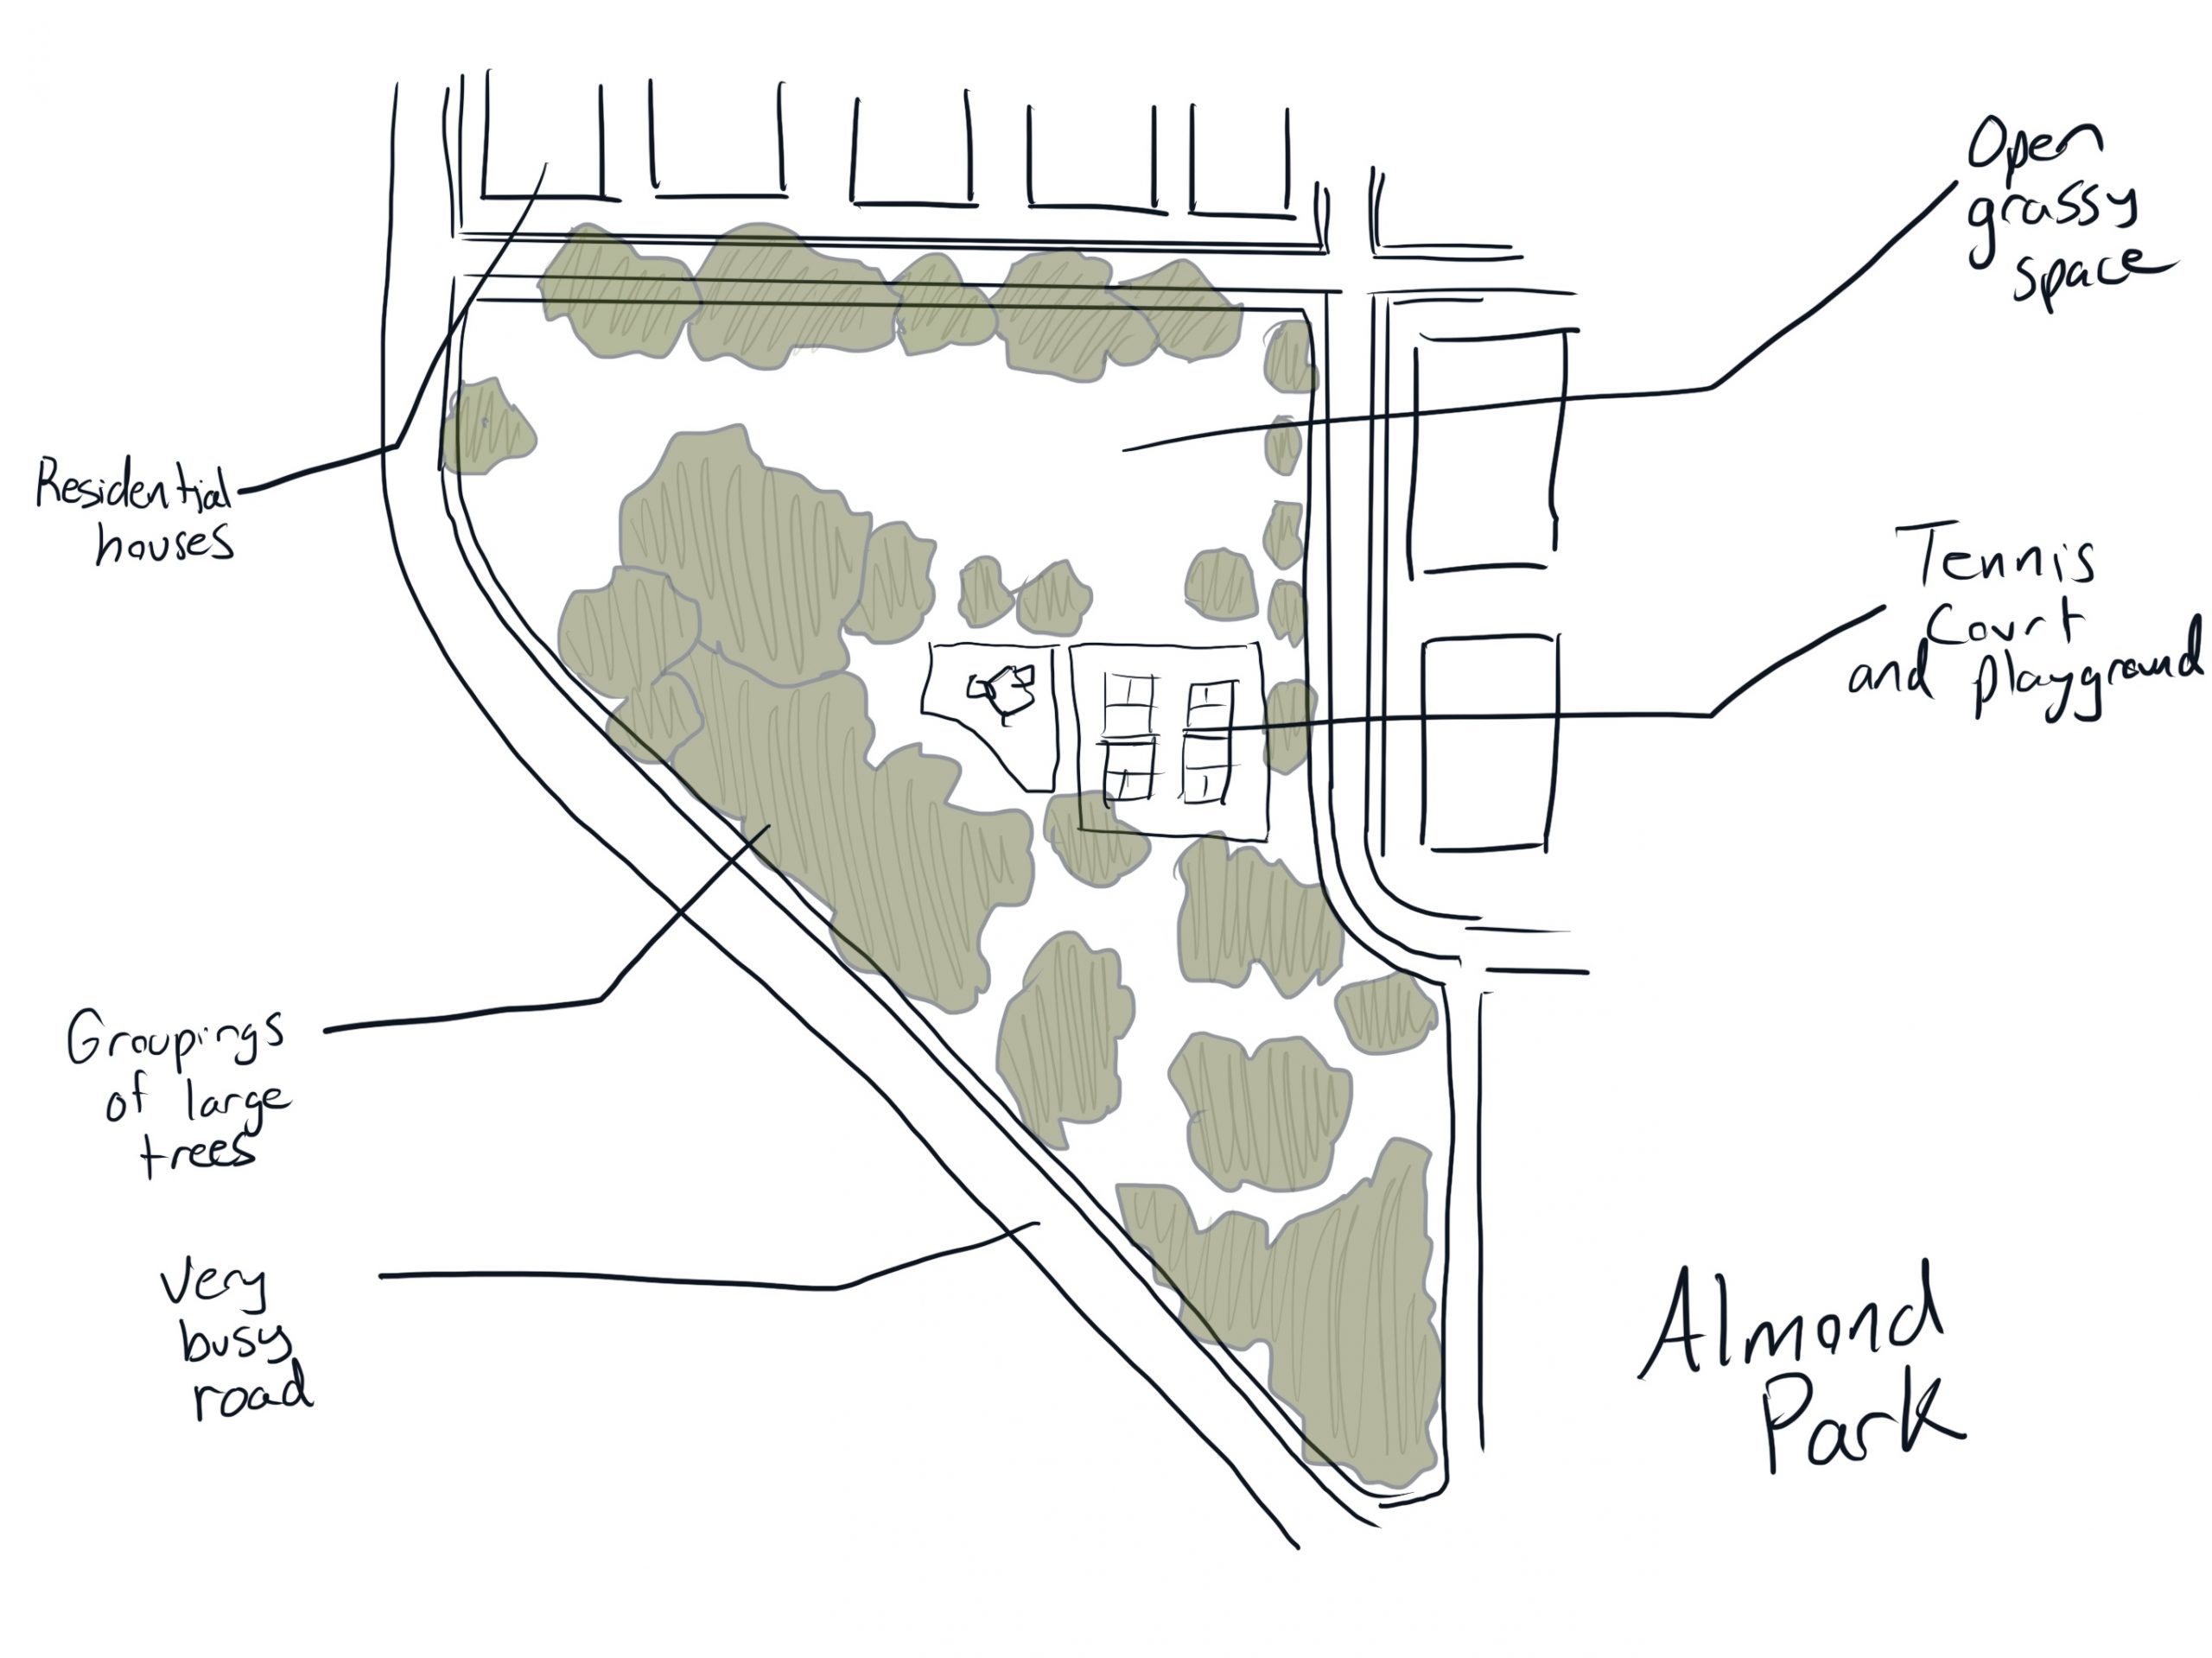
In-class exercise
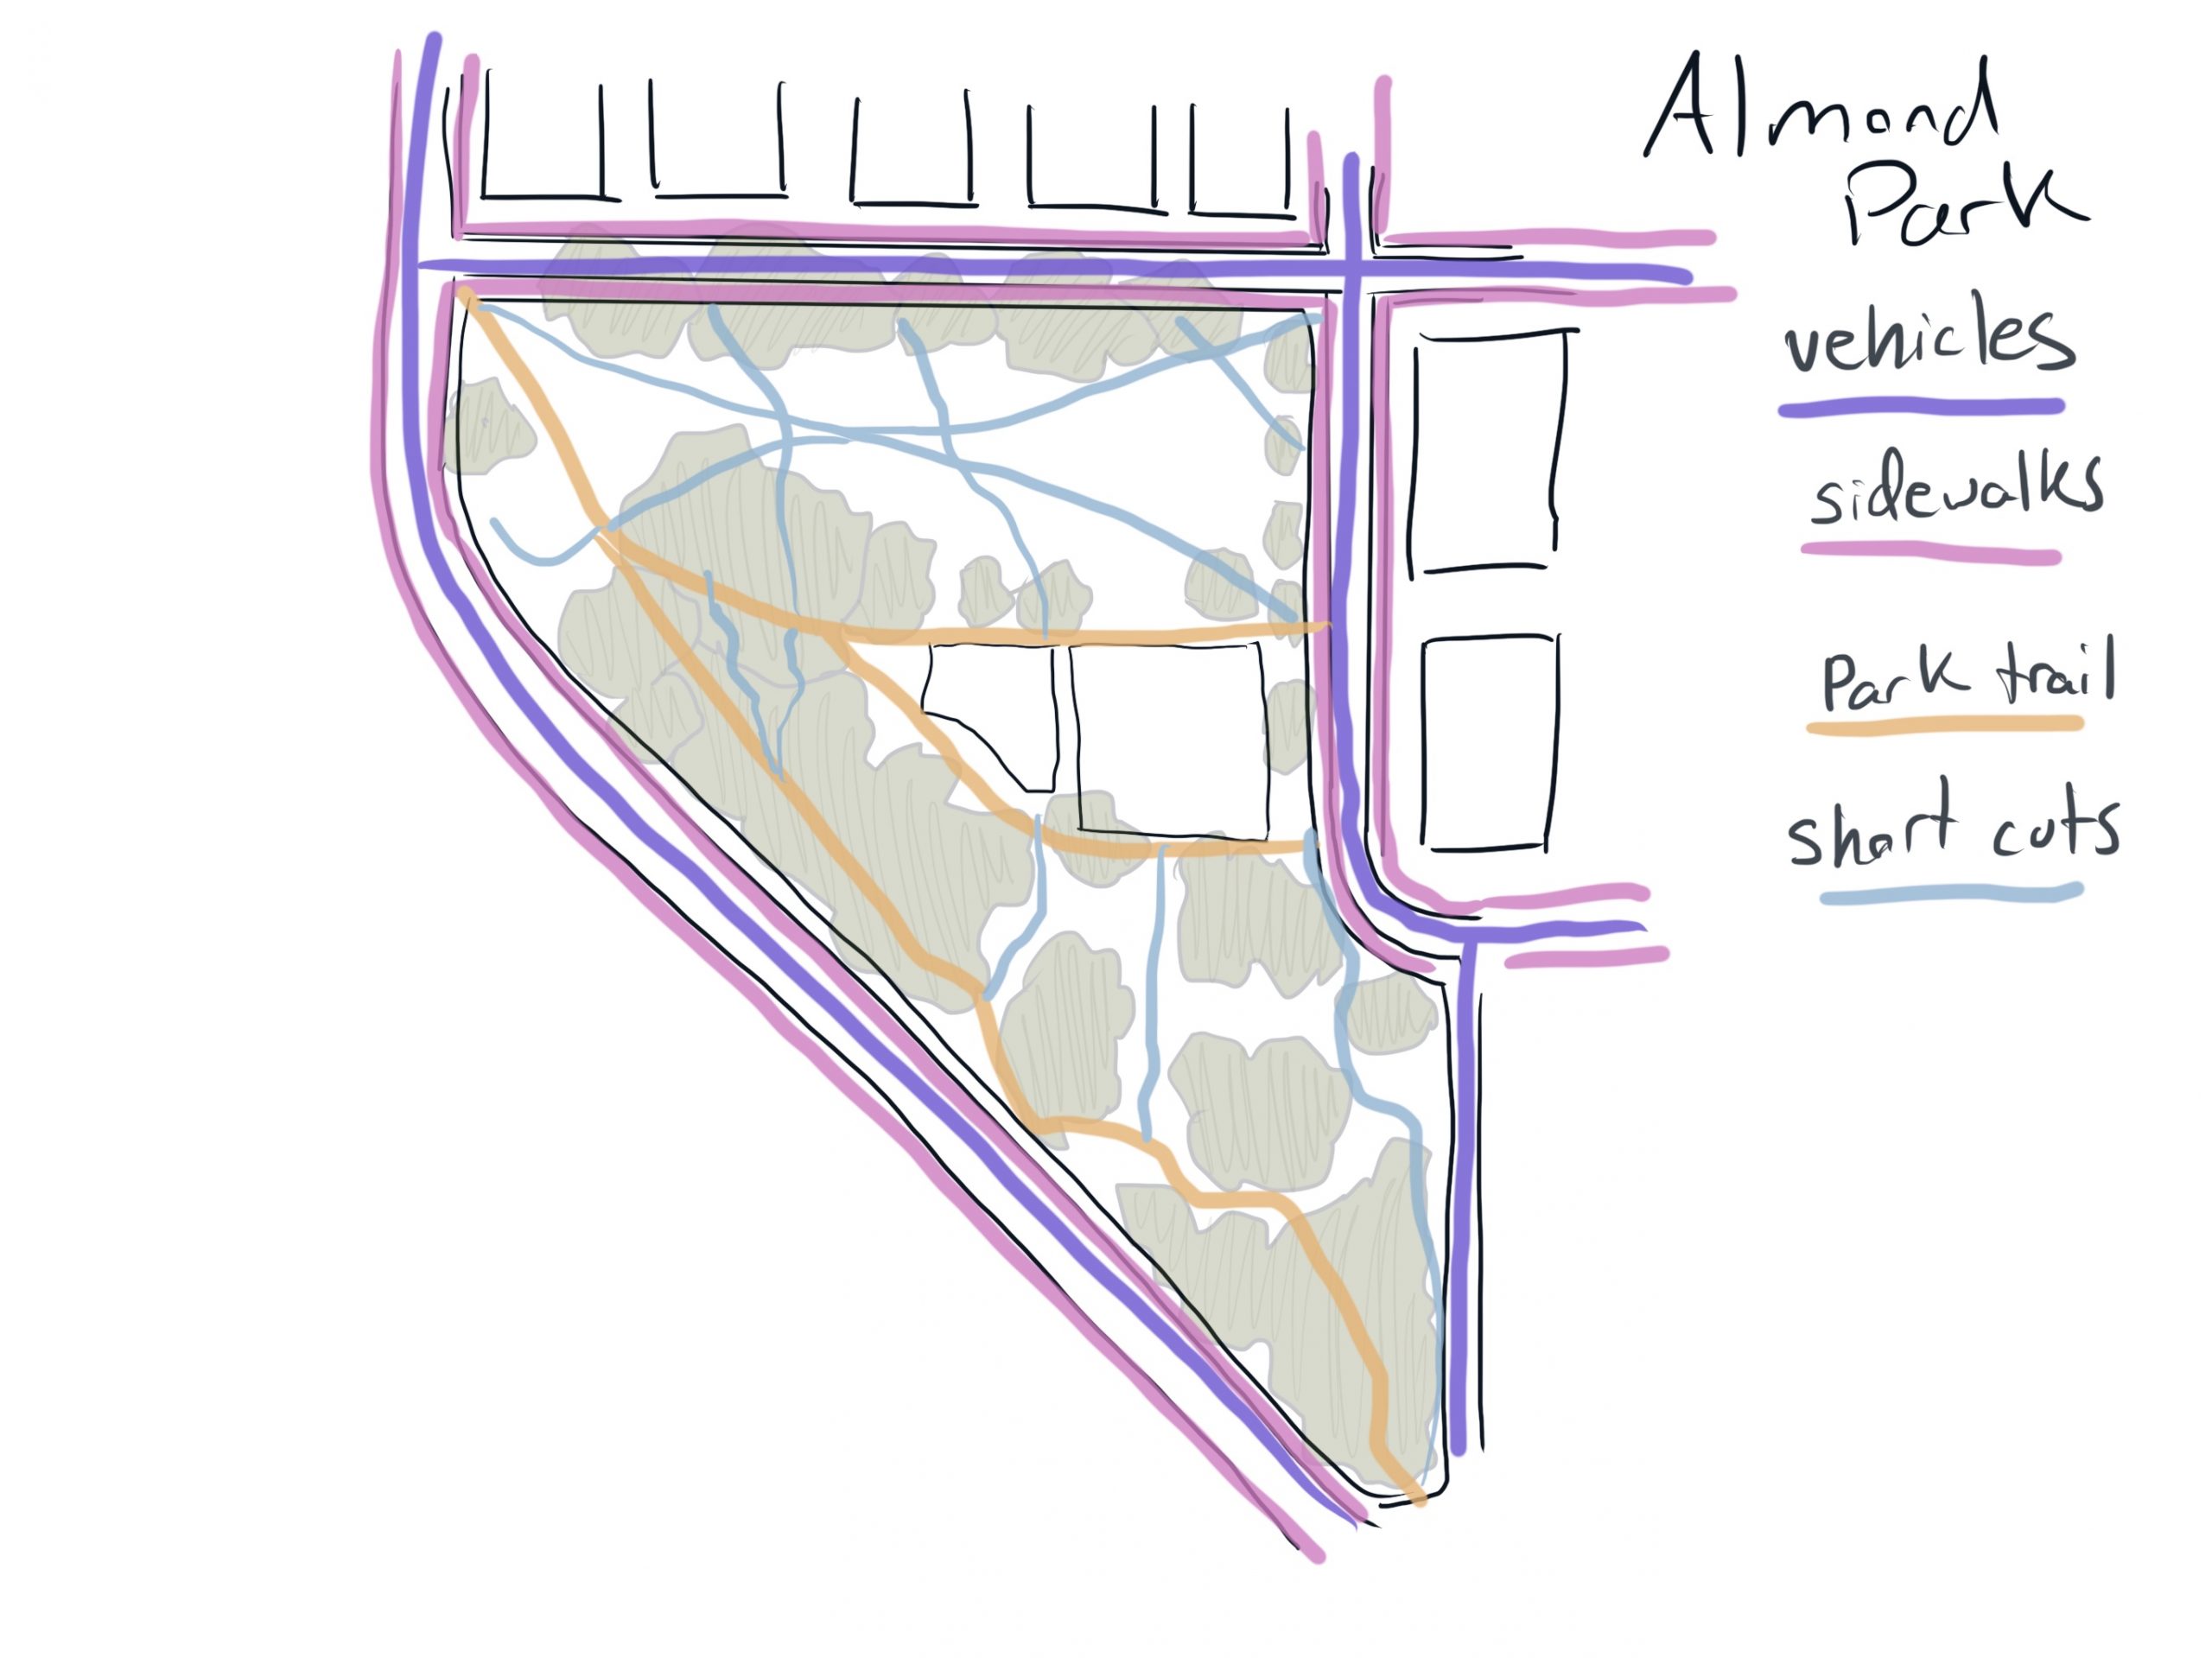
At-home exercise


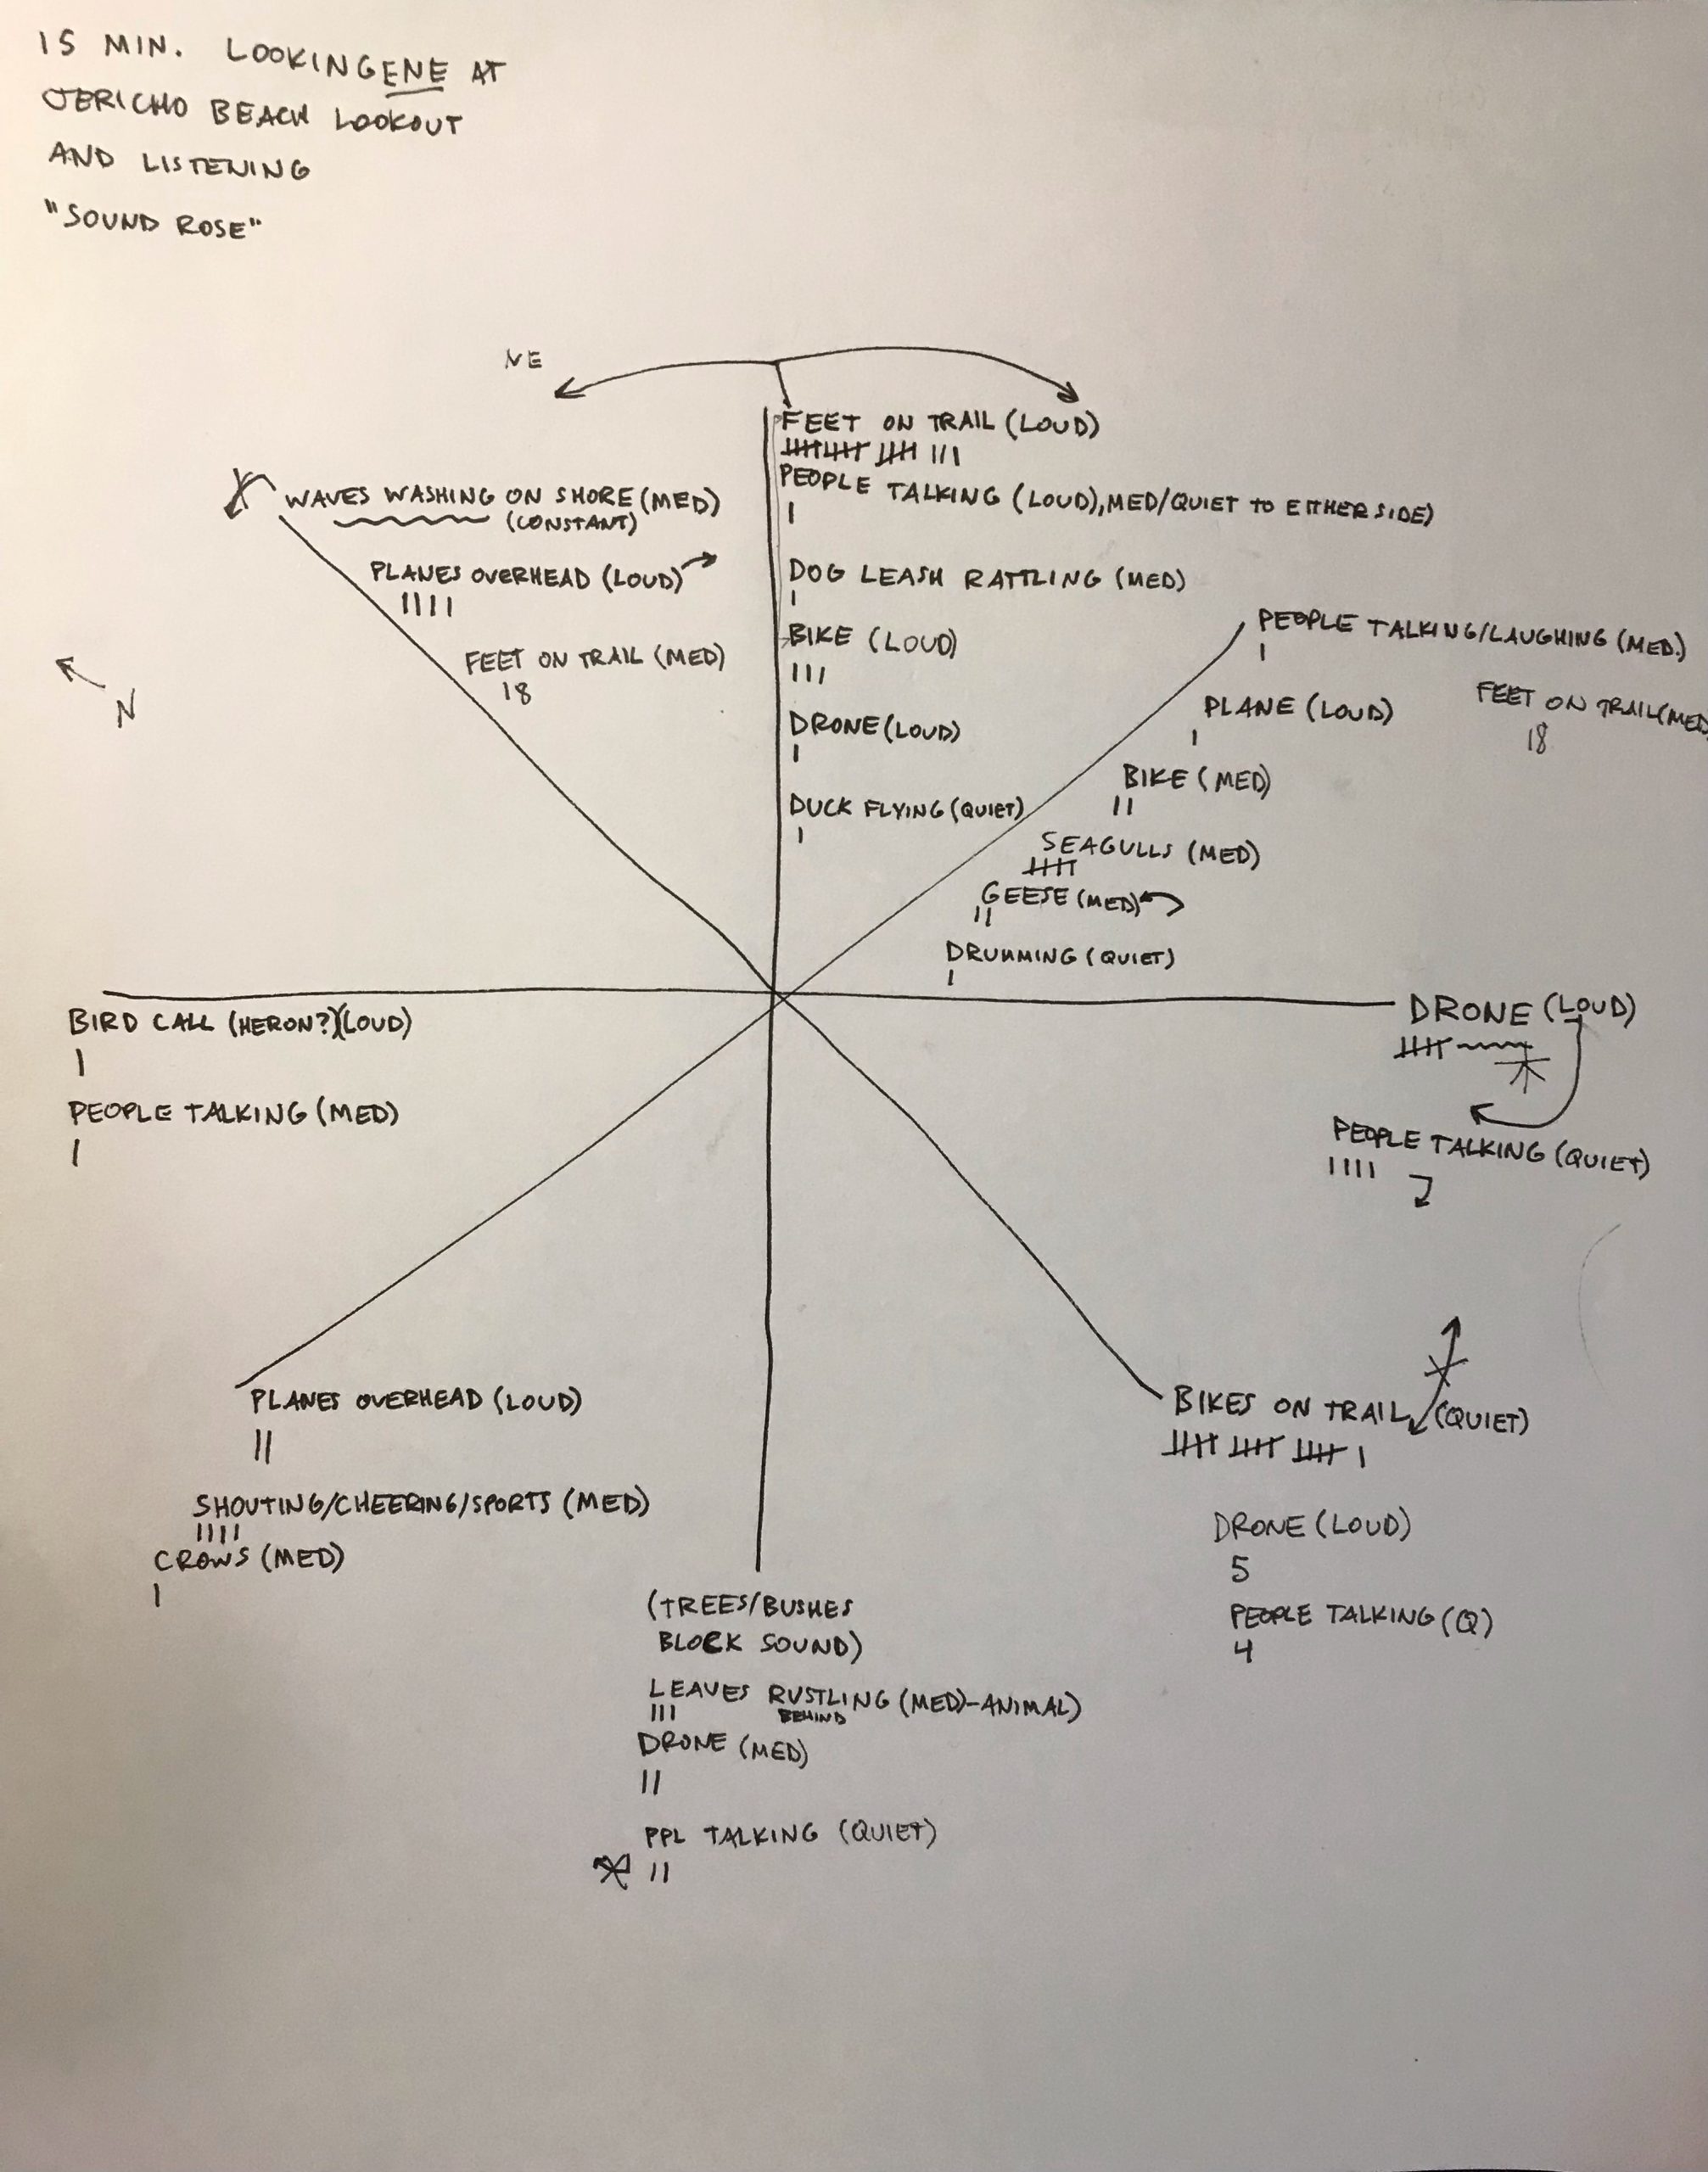
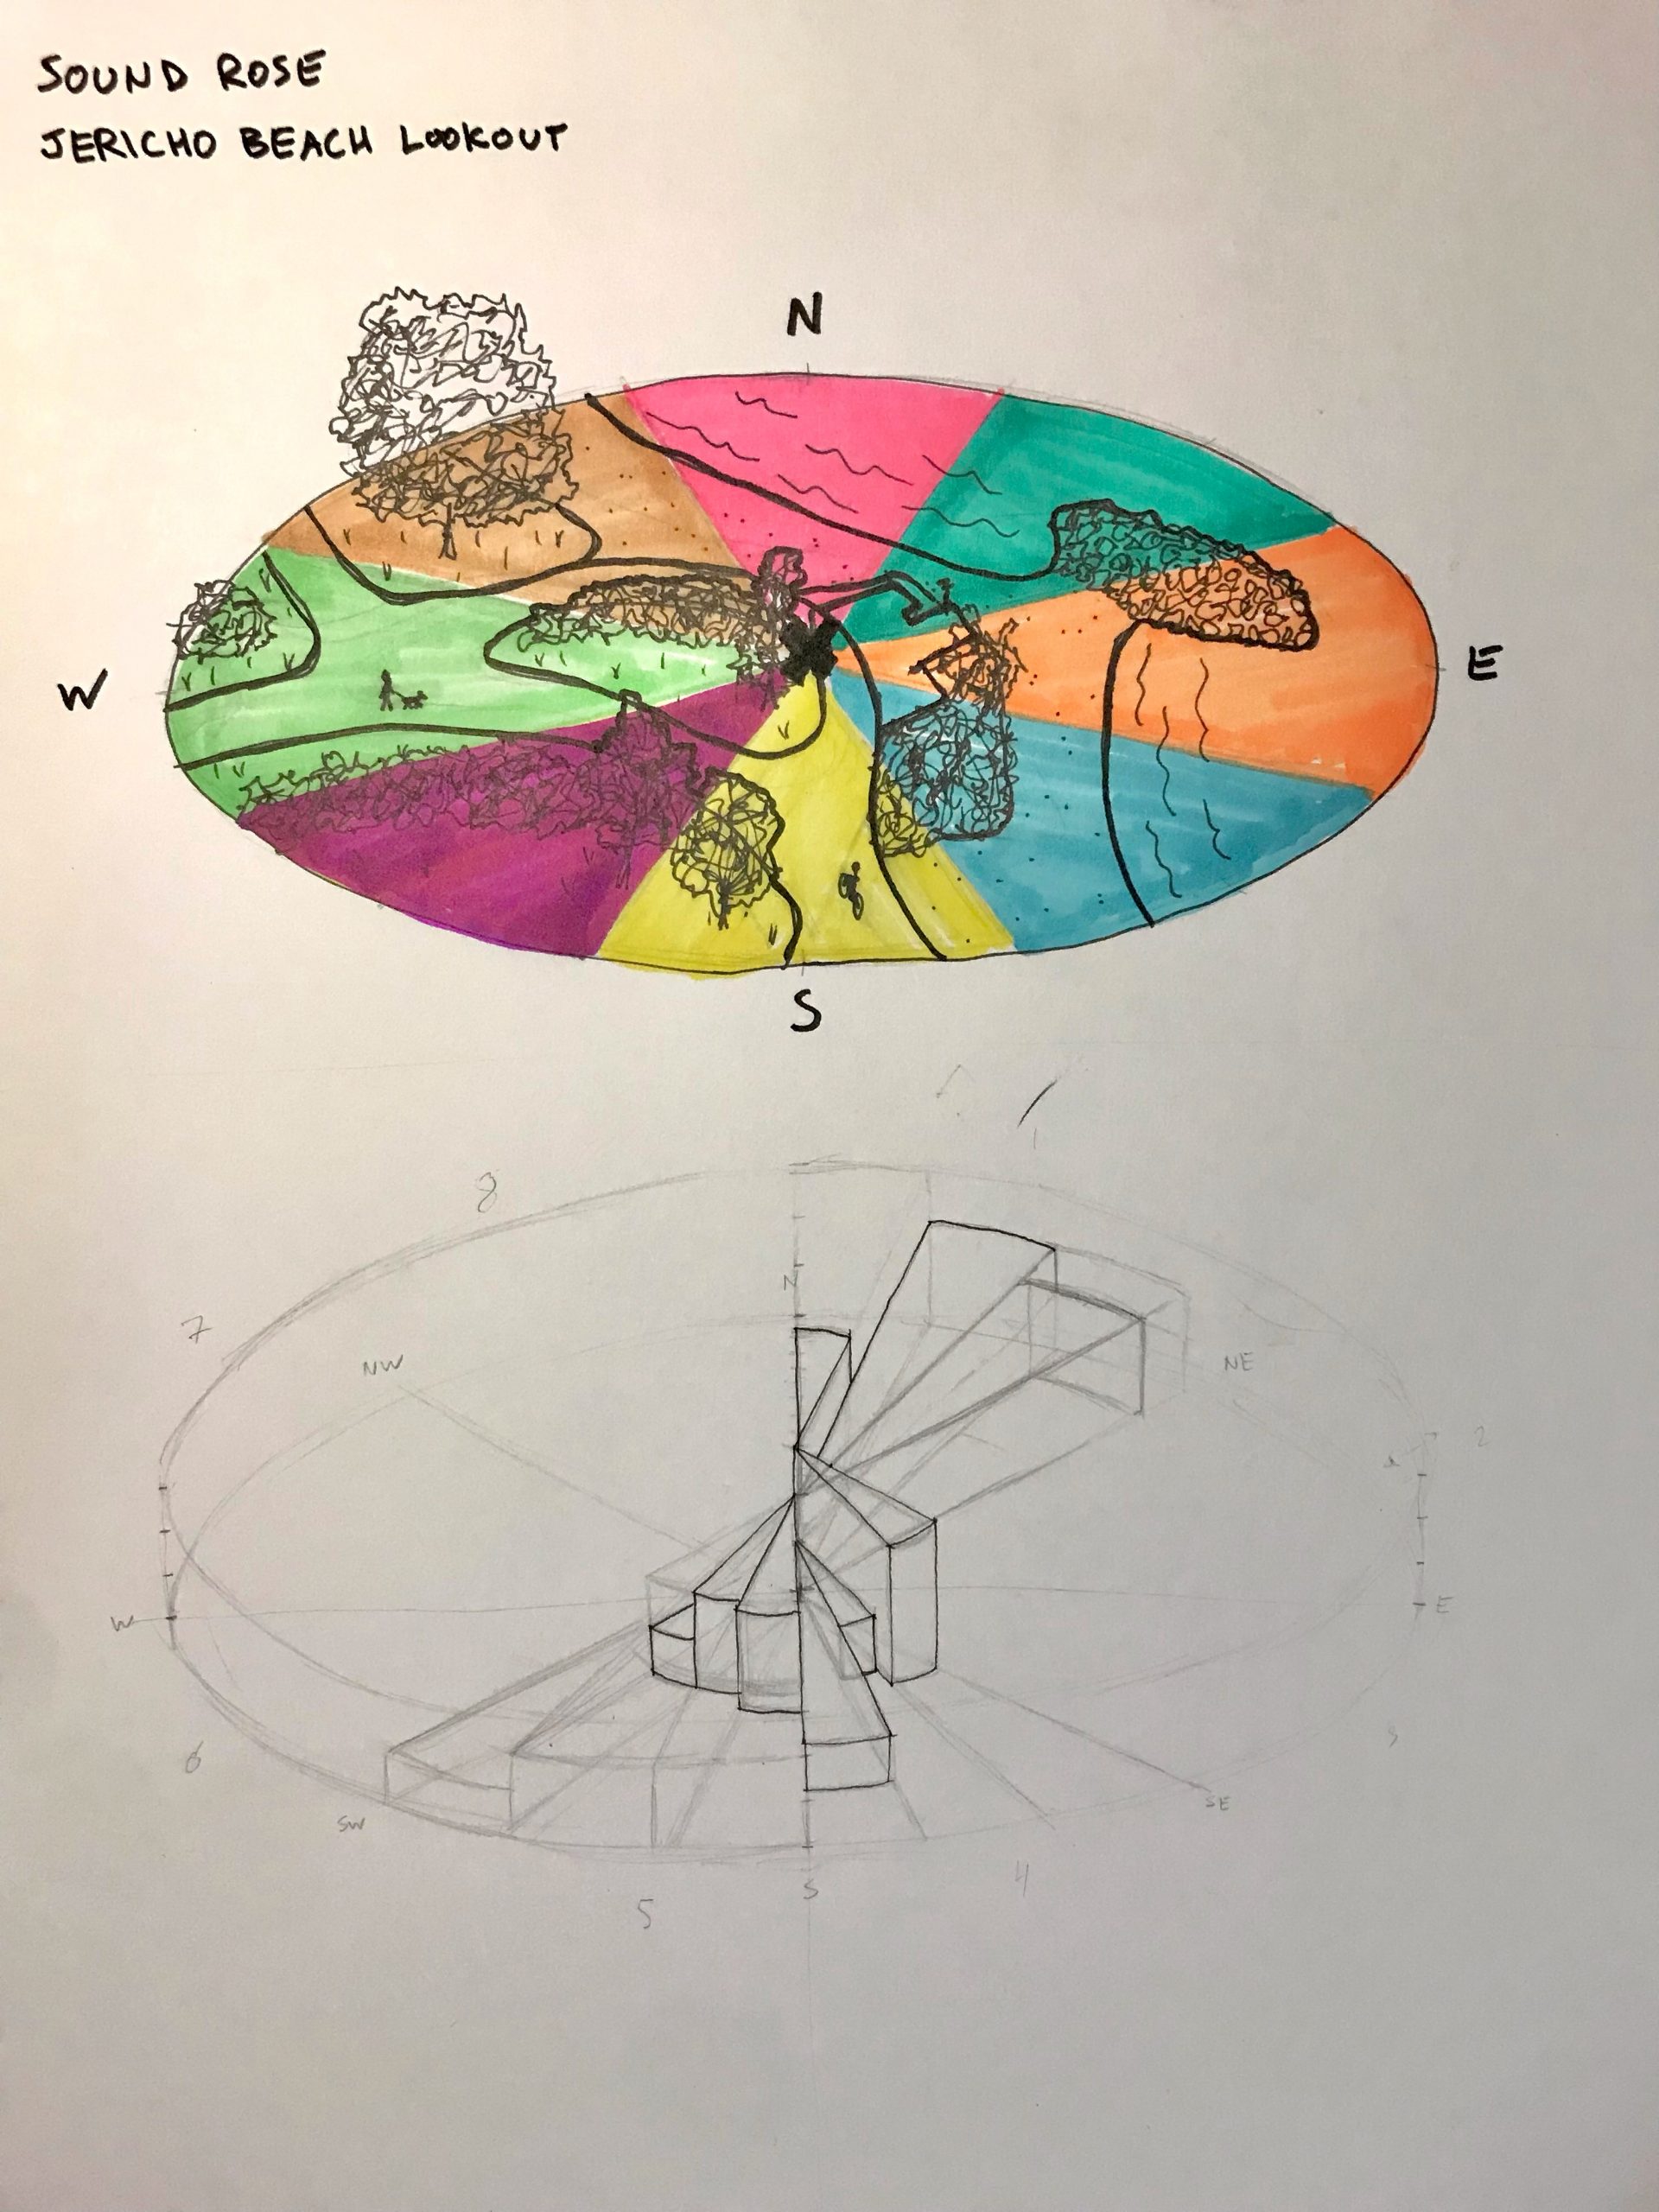
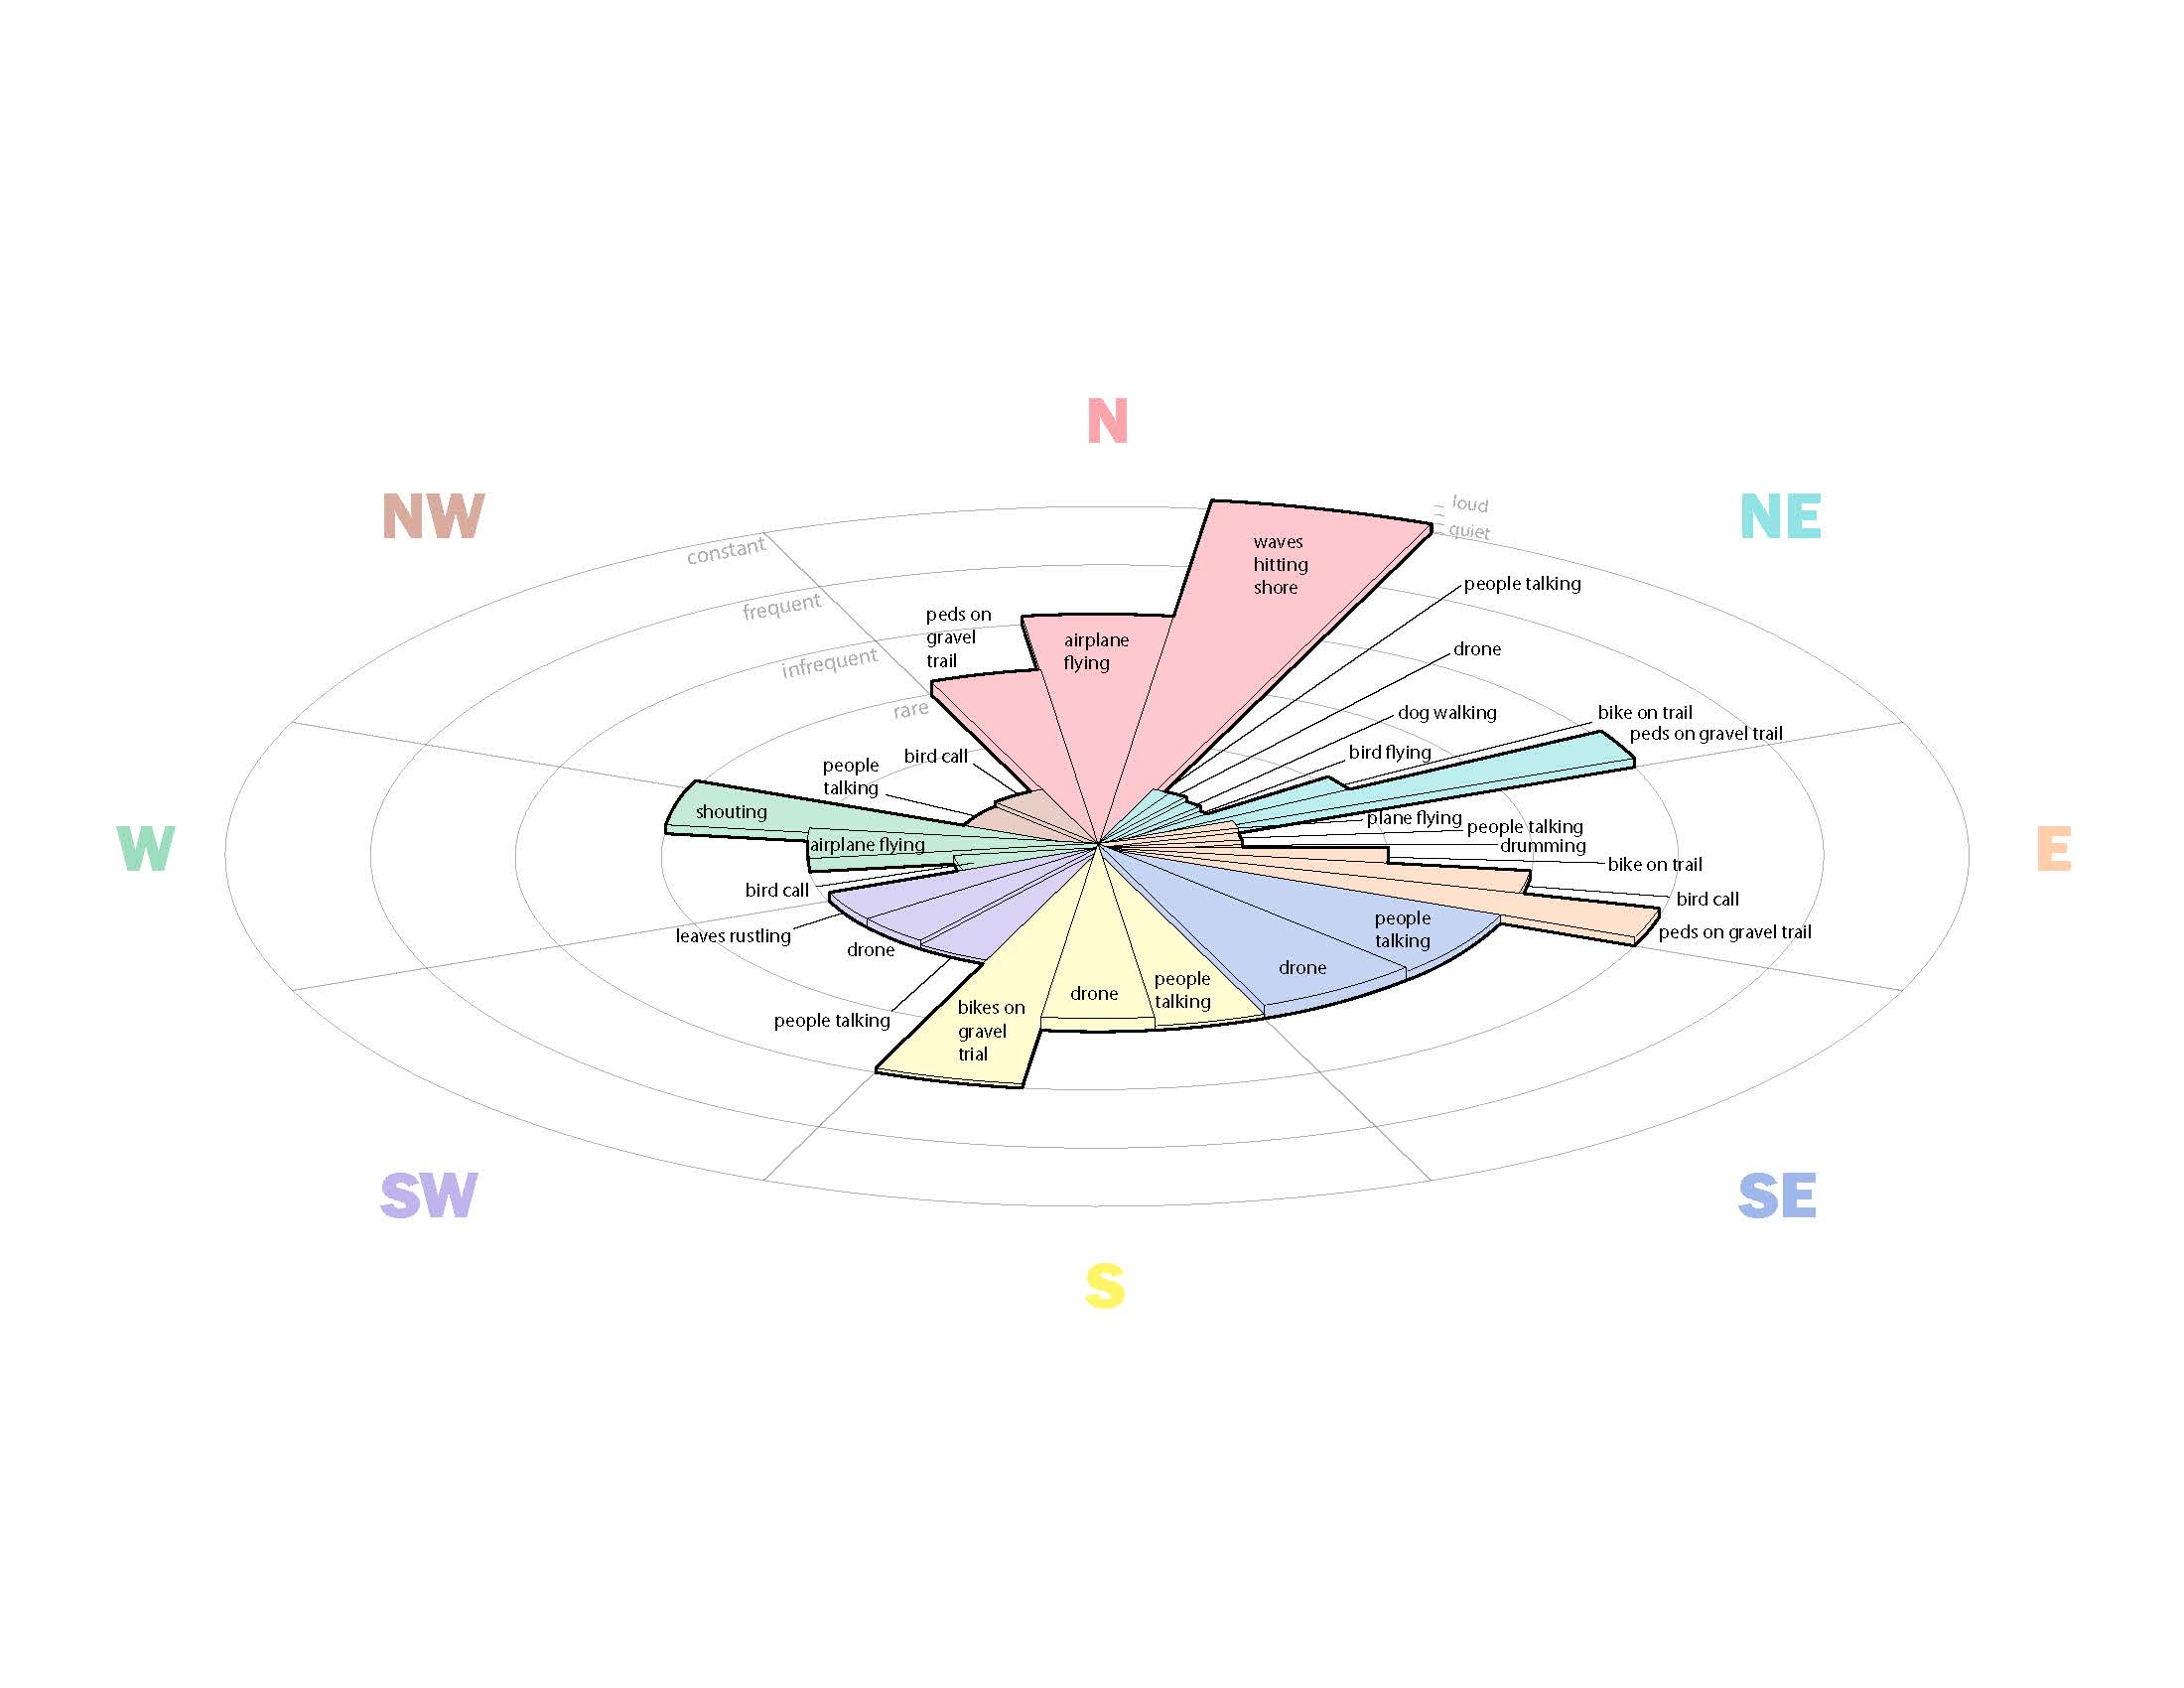
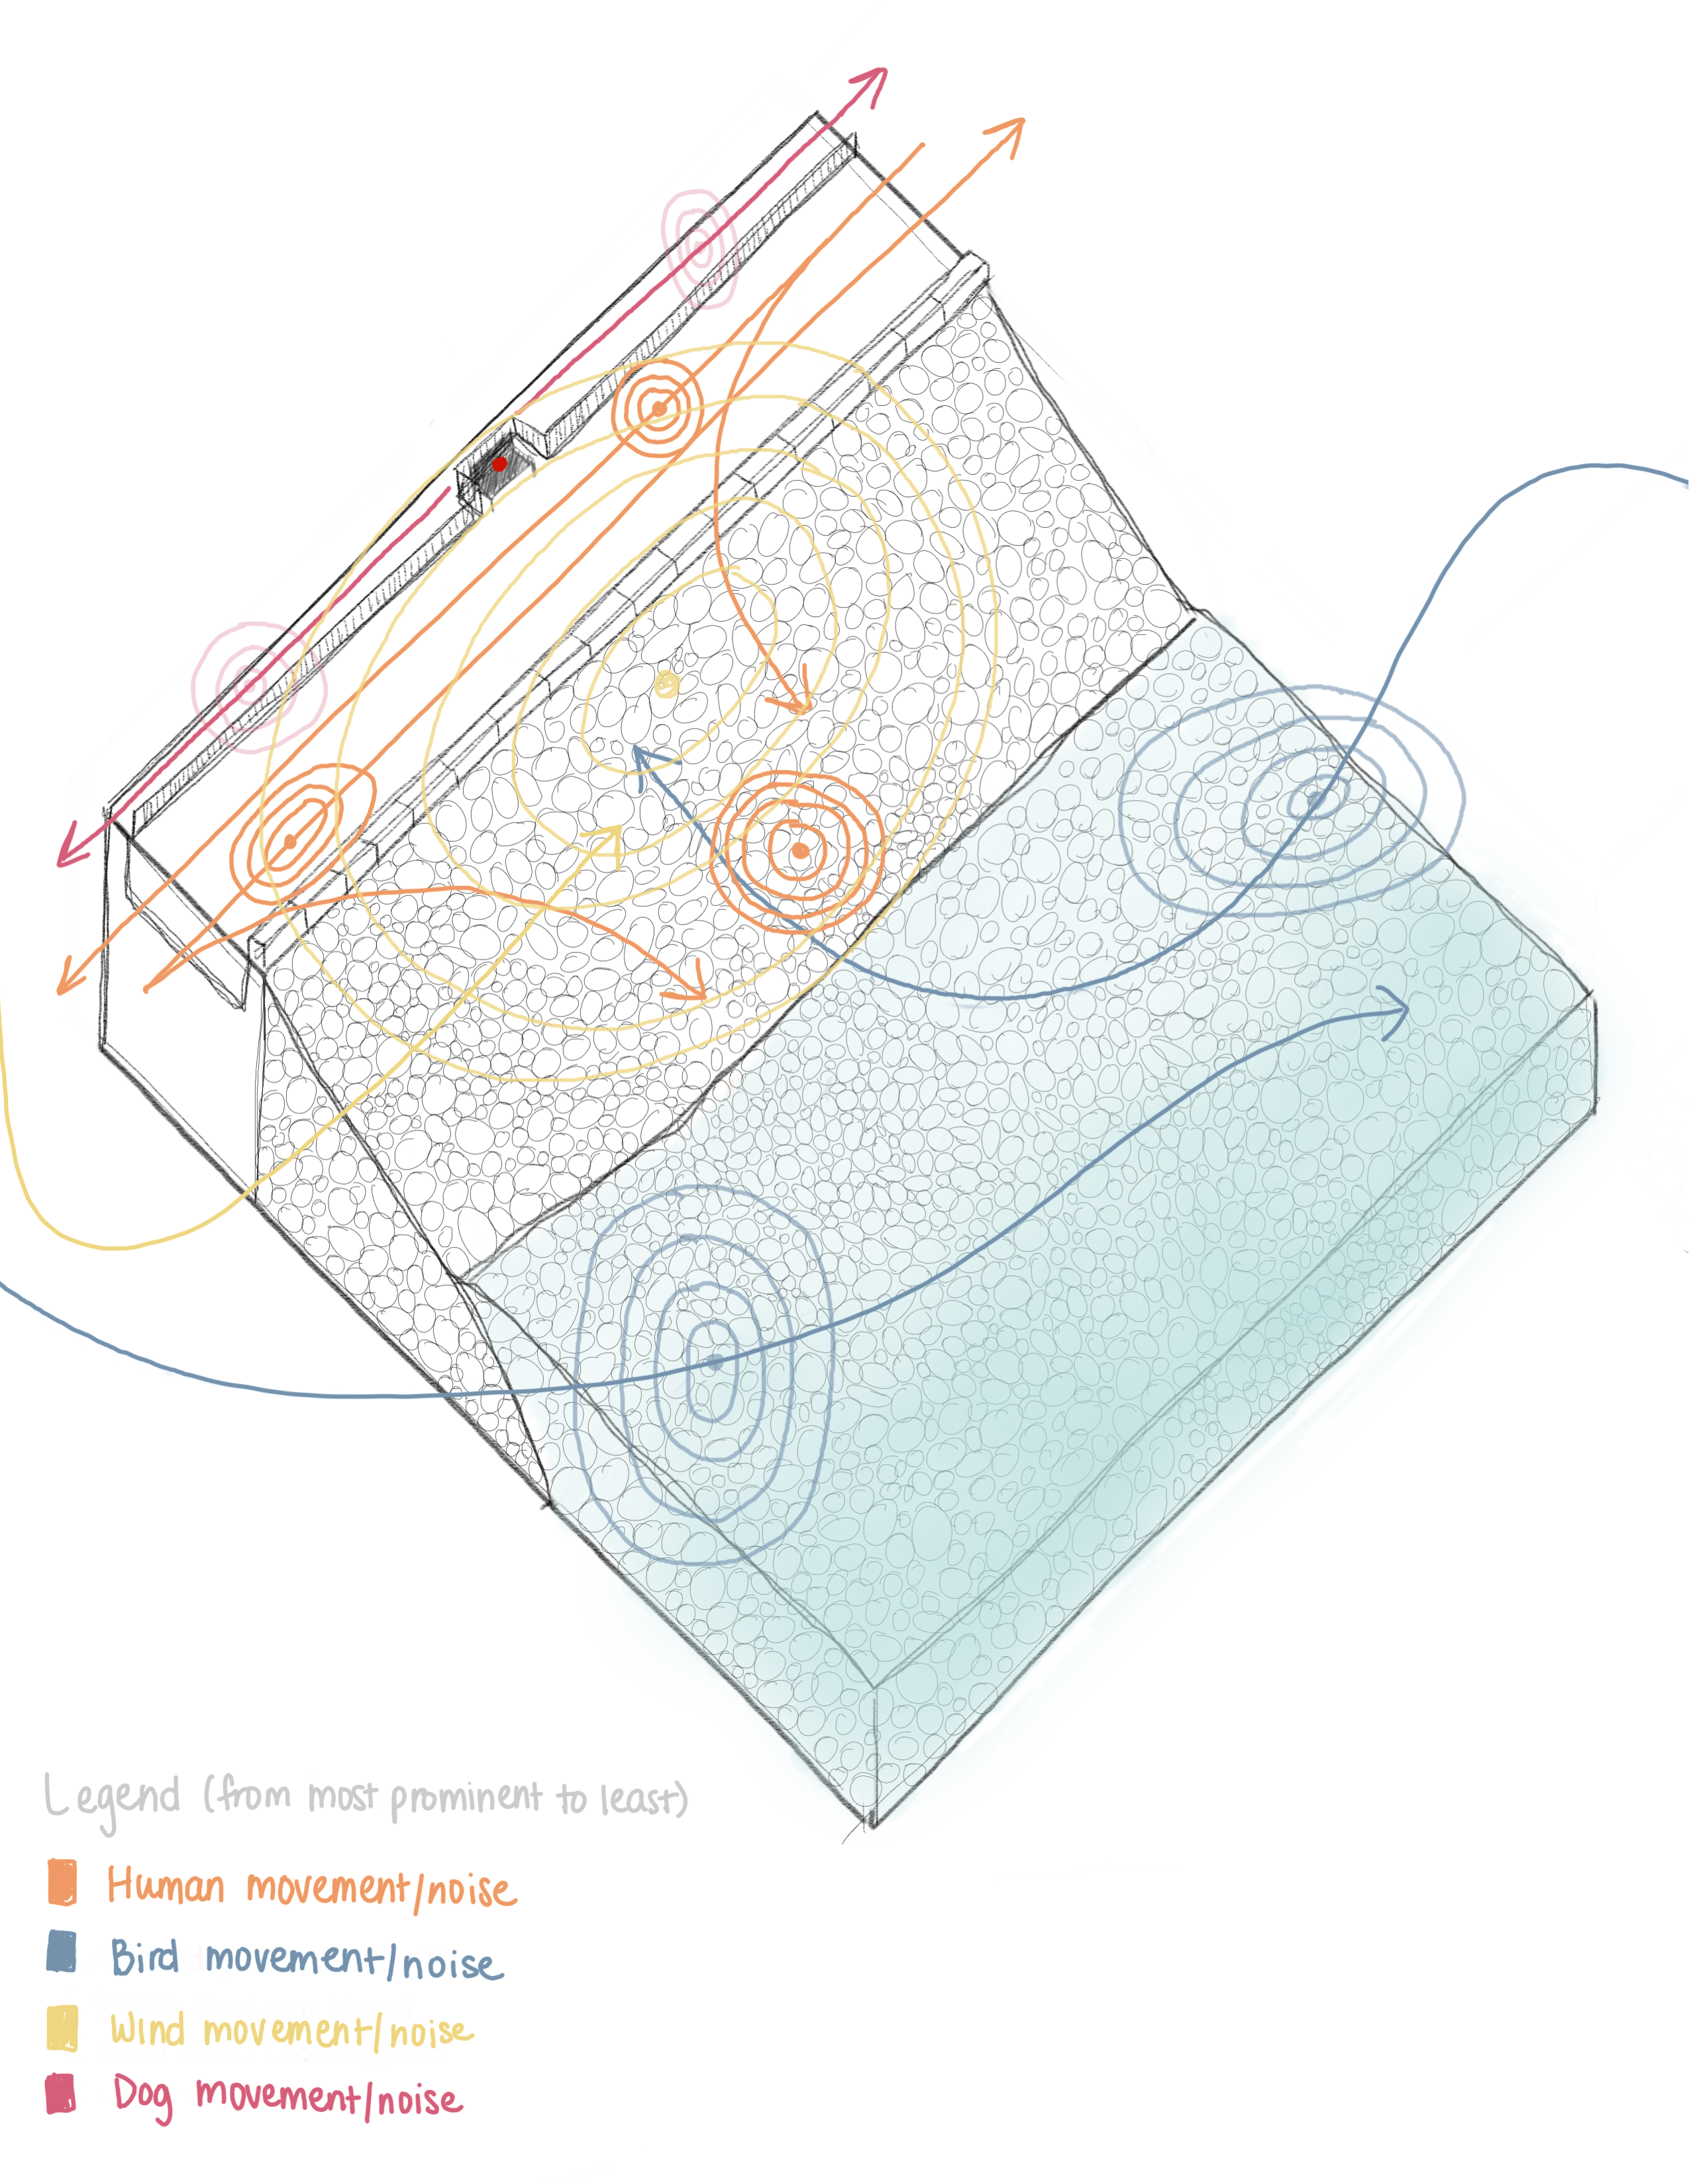
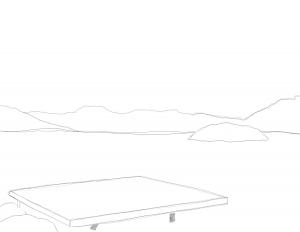
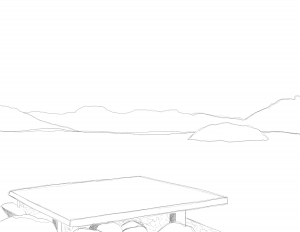
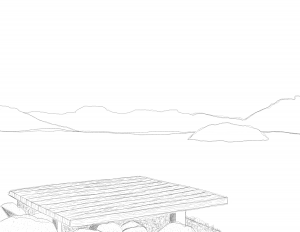
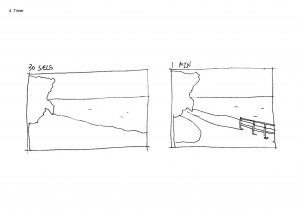
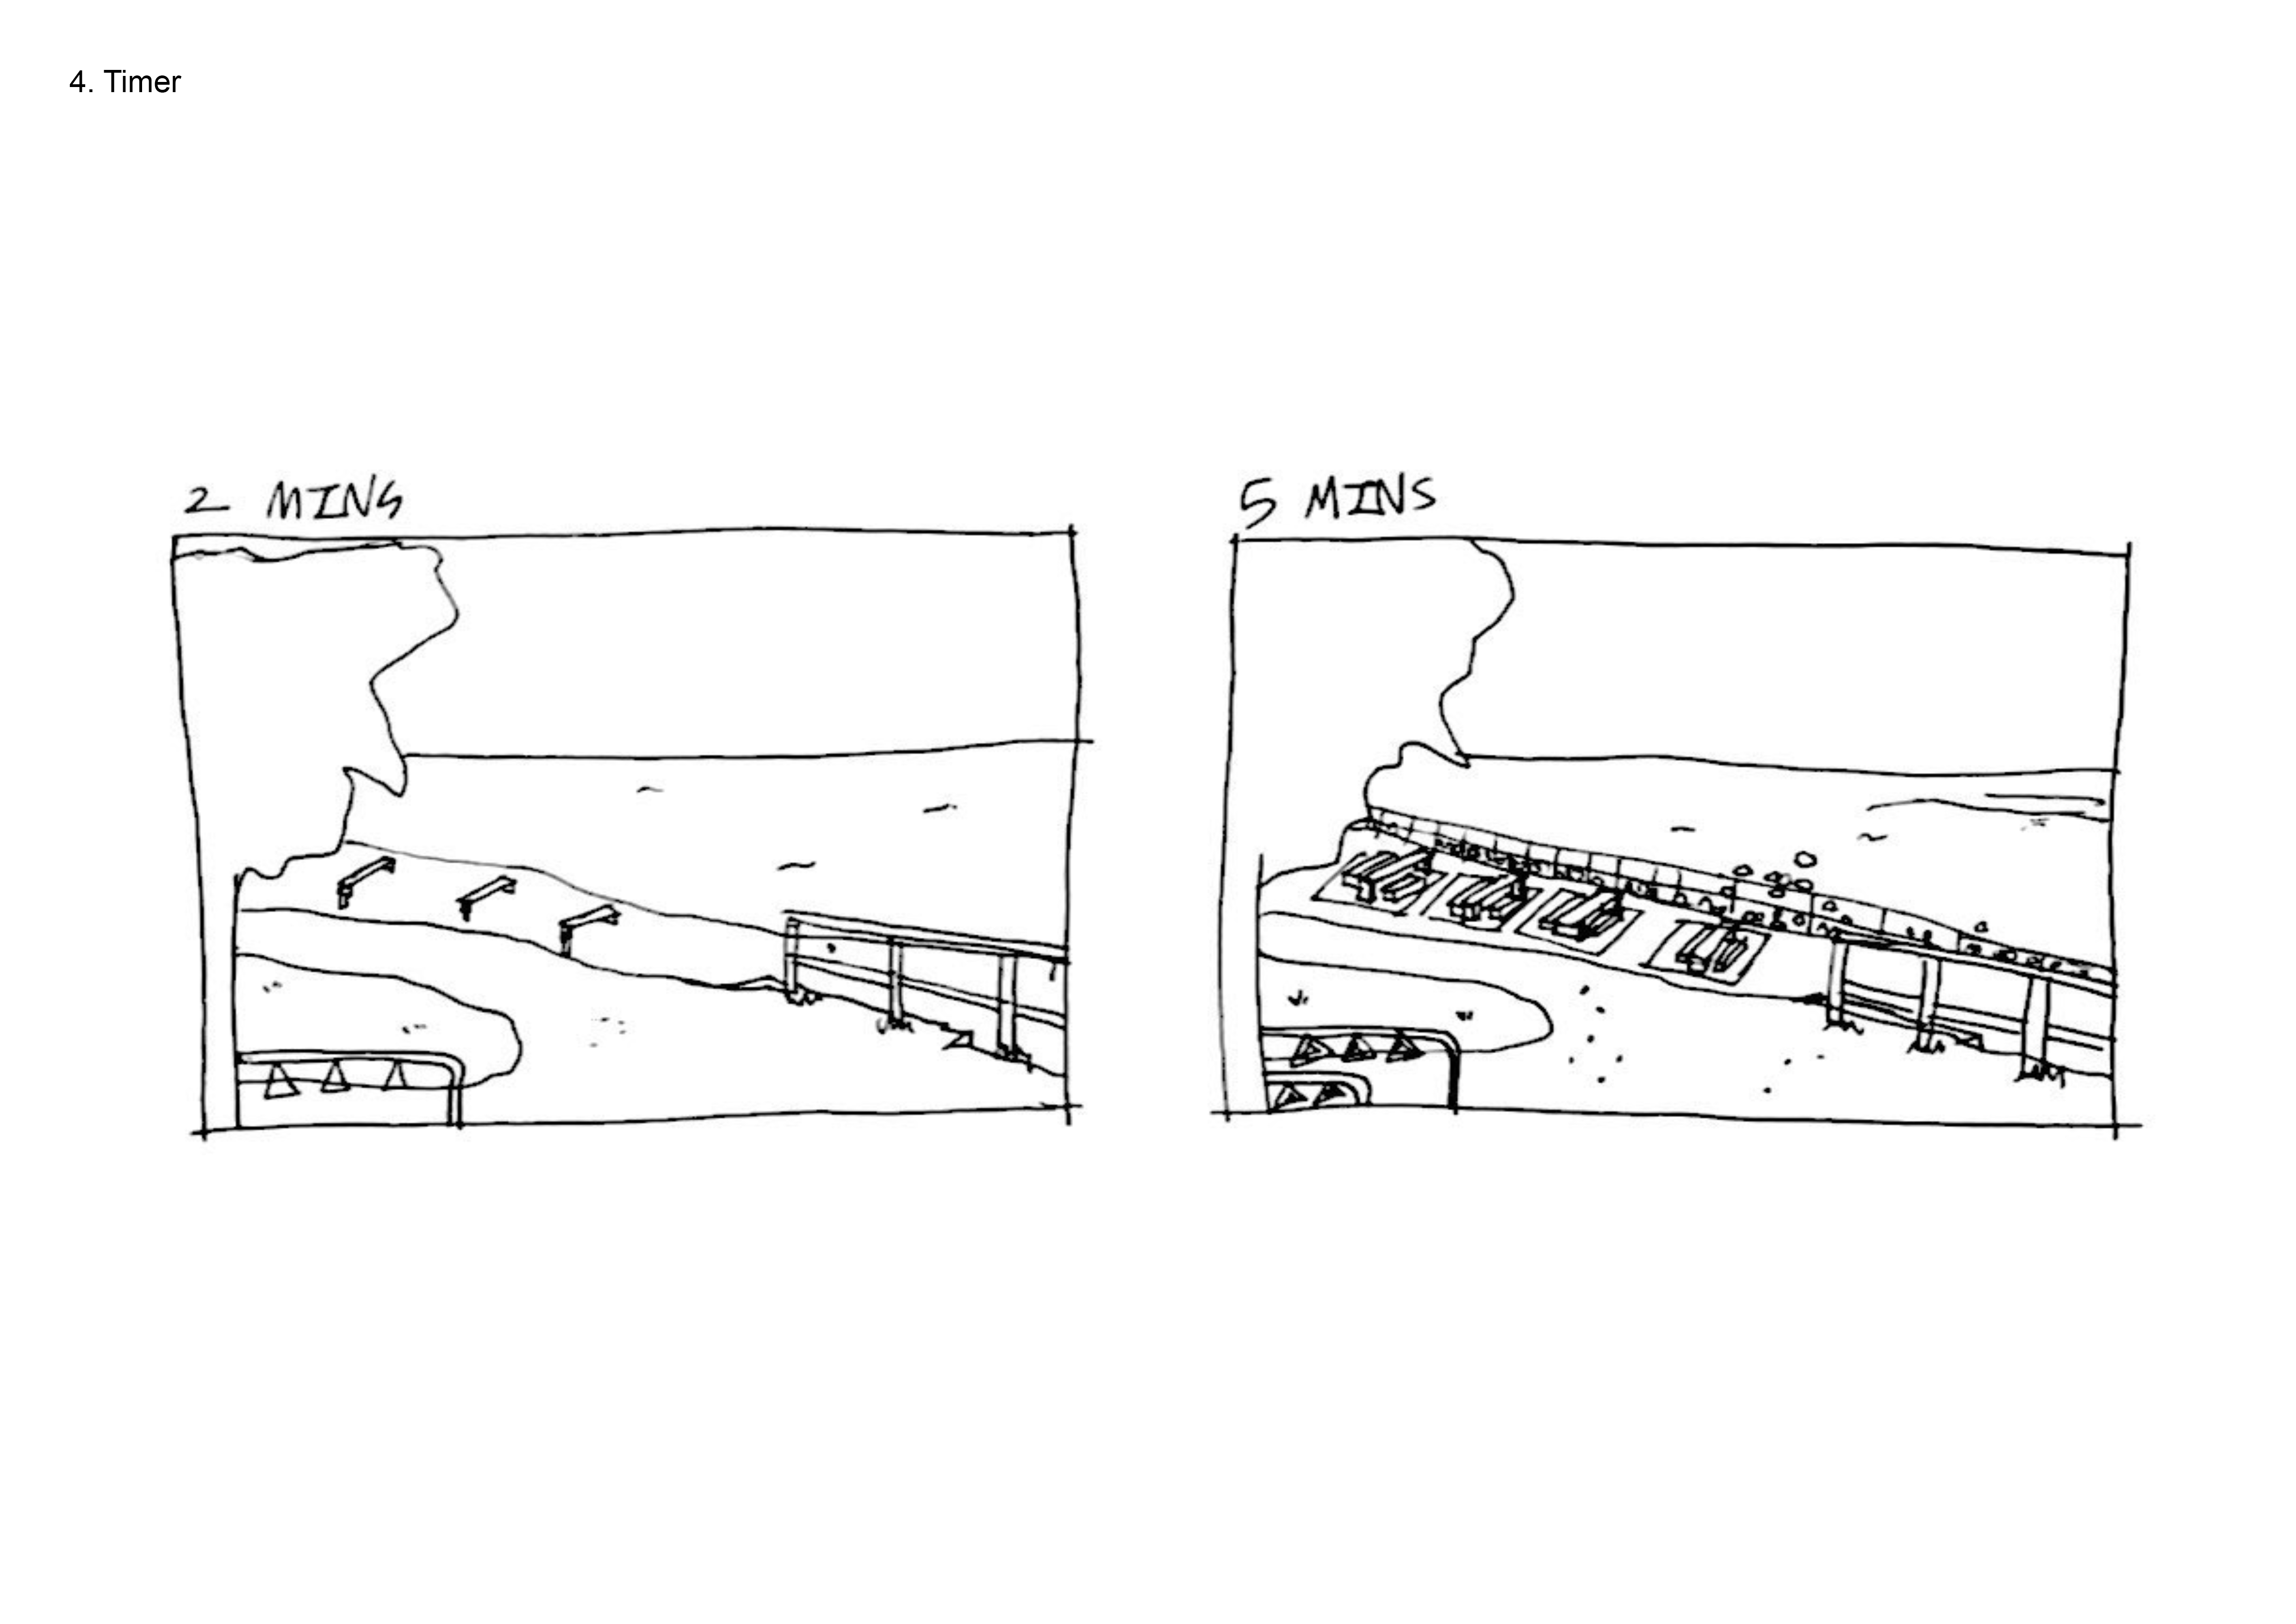
A3: Mapping – Birds, Wind, Waves, and Voices at Jericho Beach
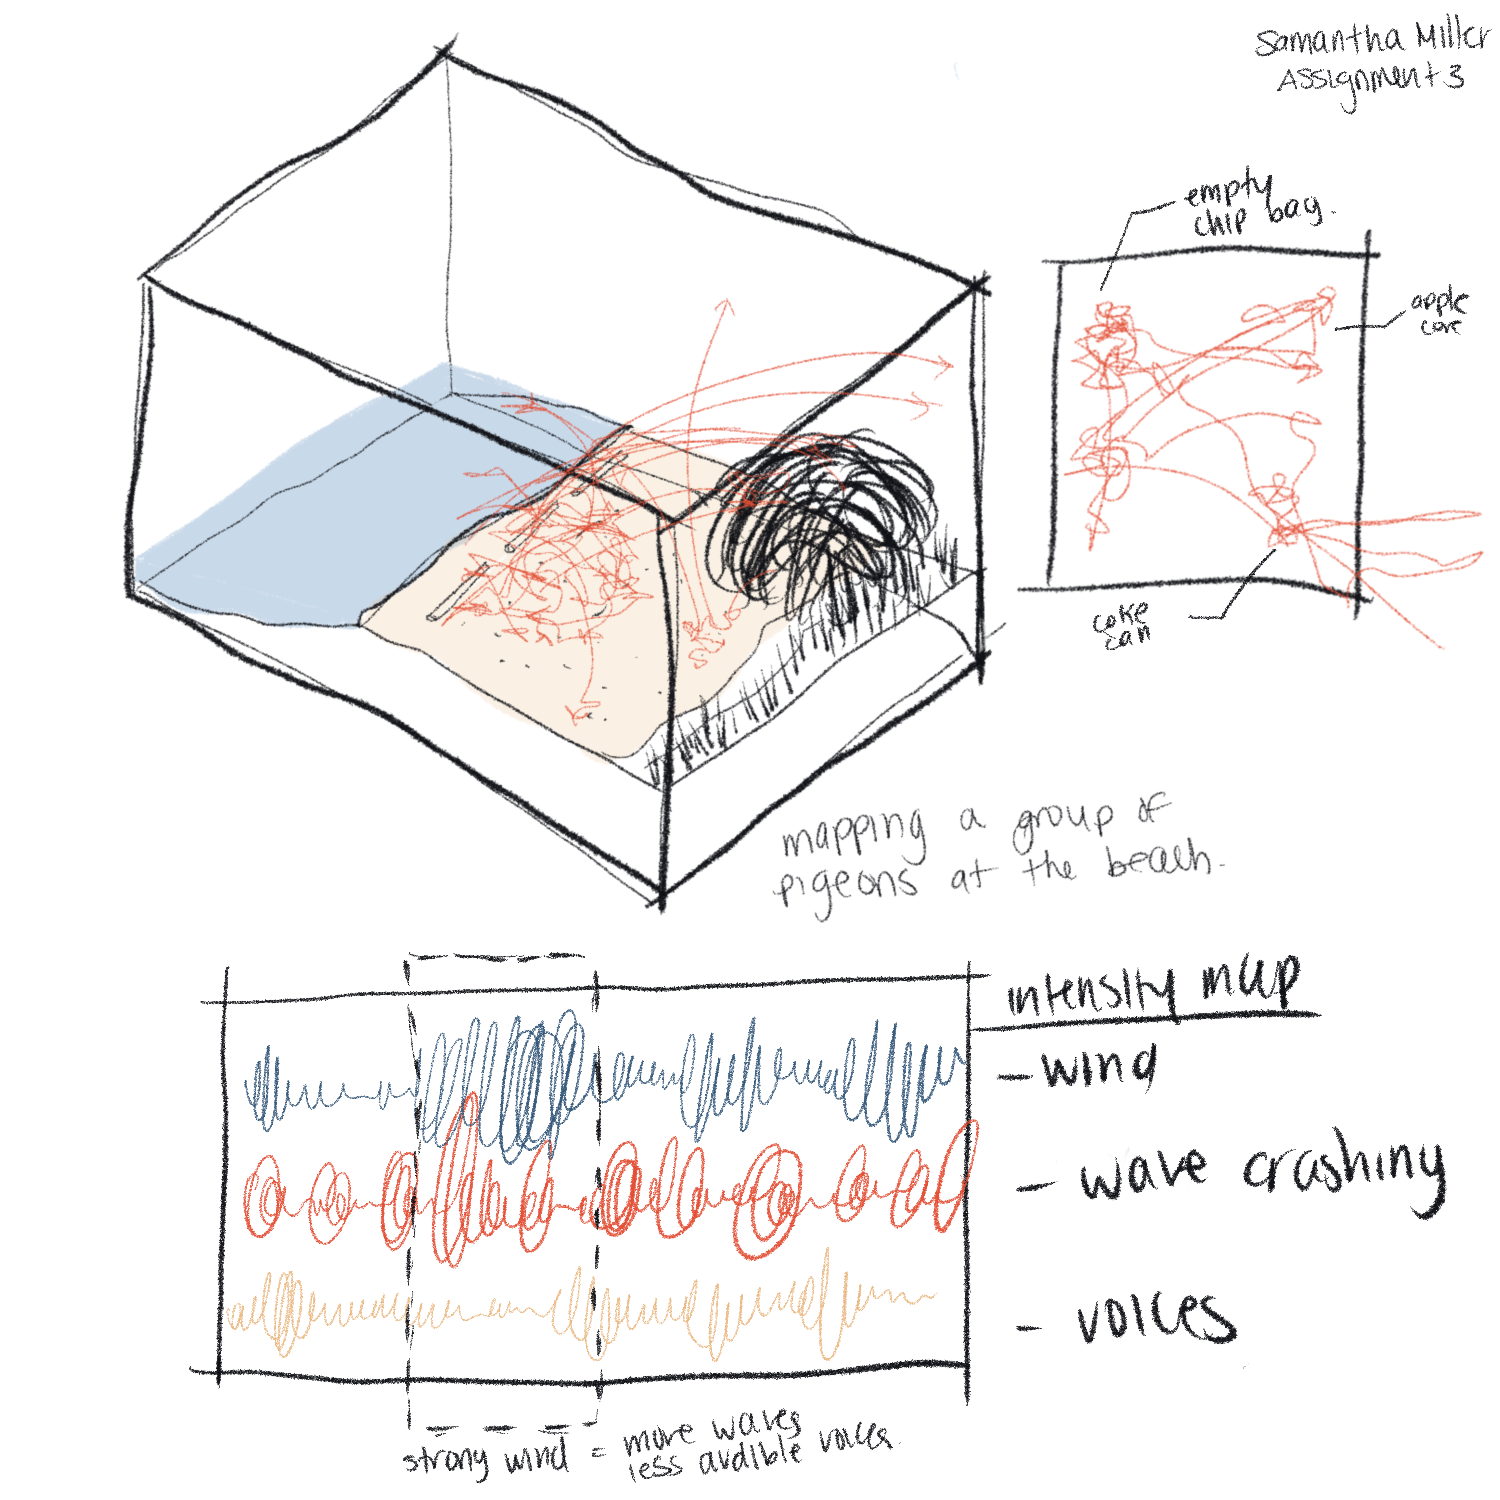
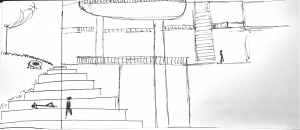
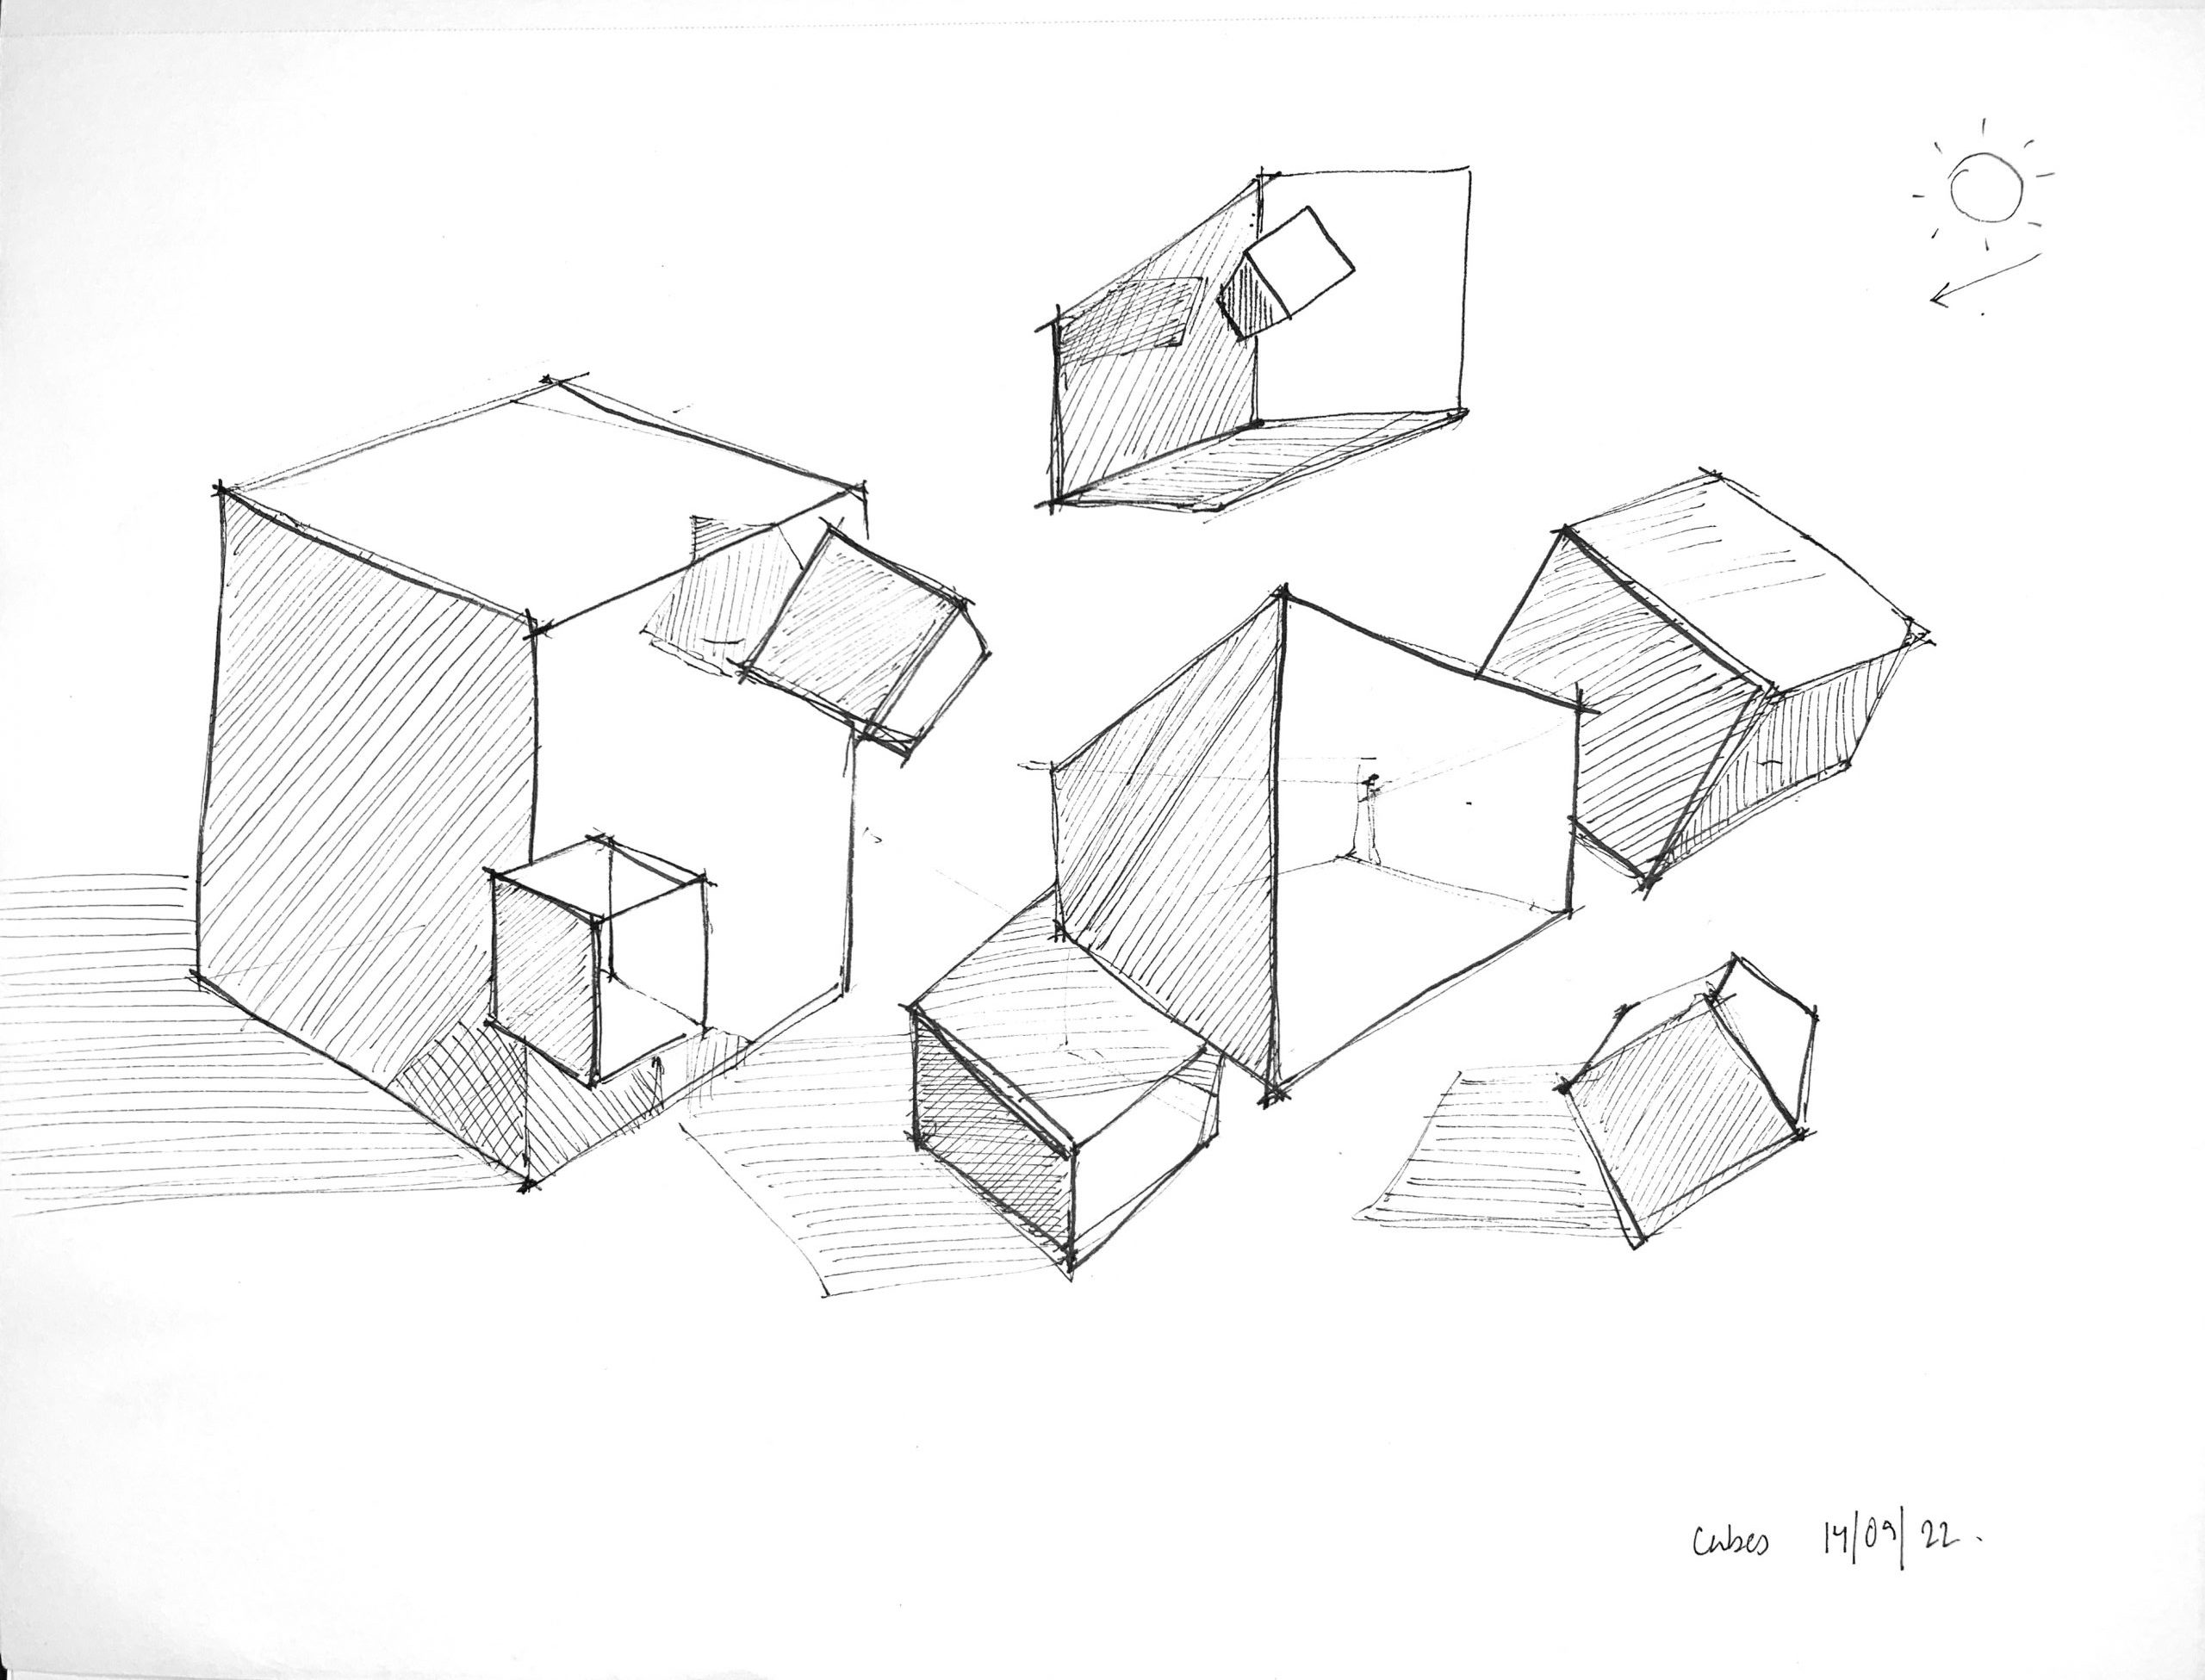
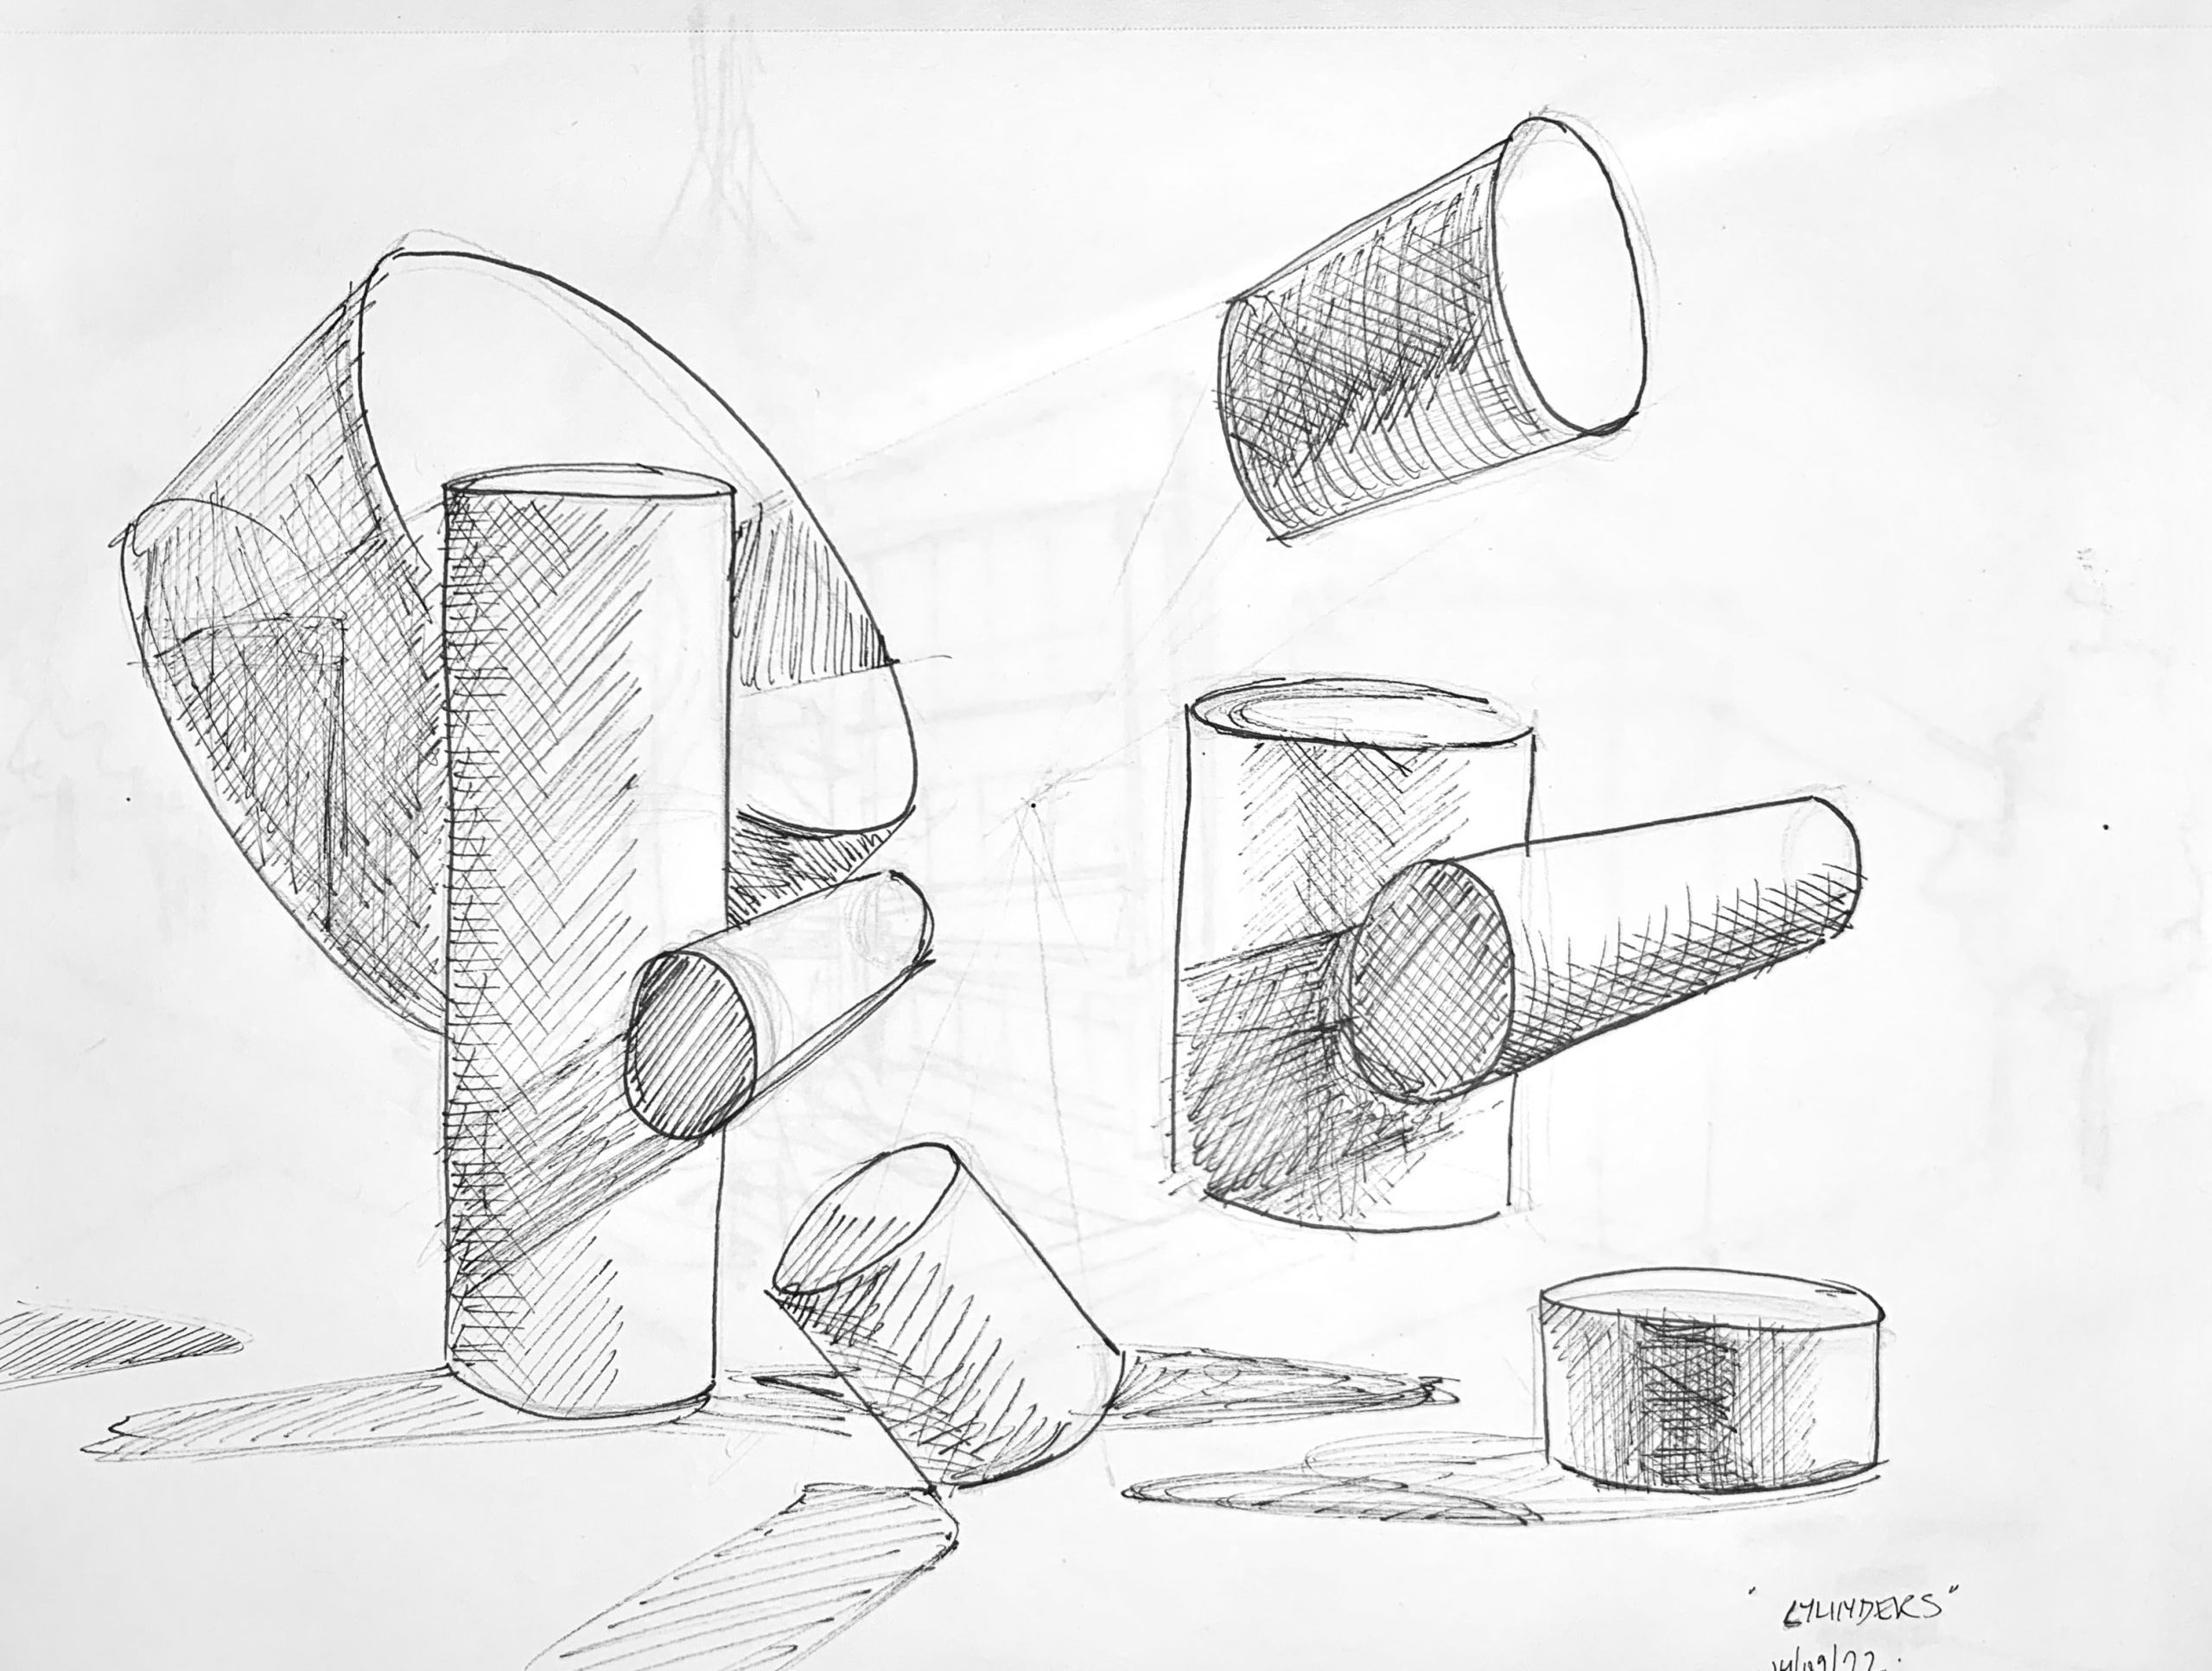
In-class drawing:
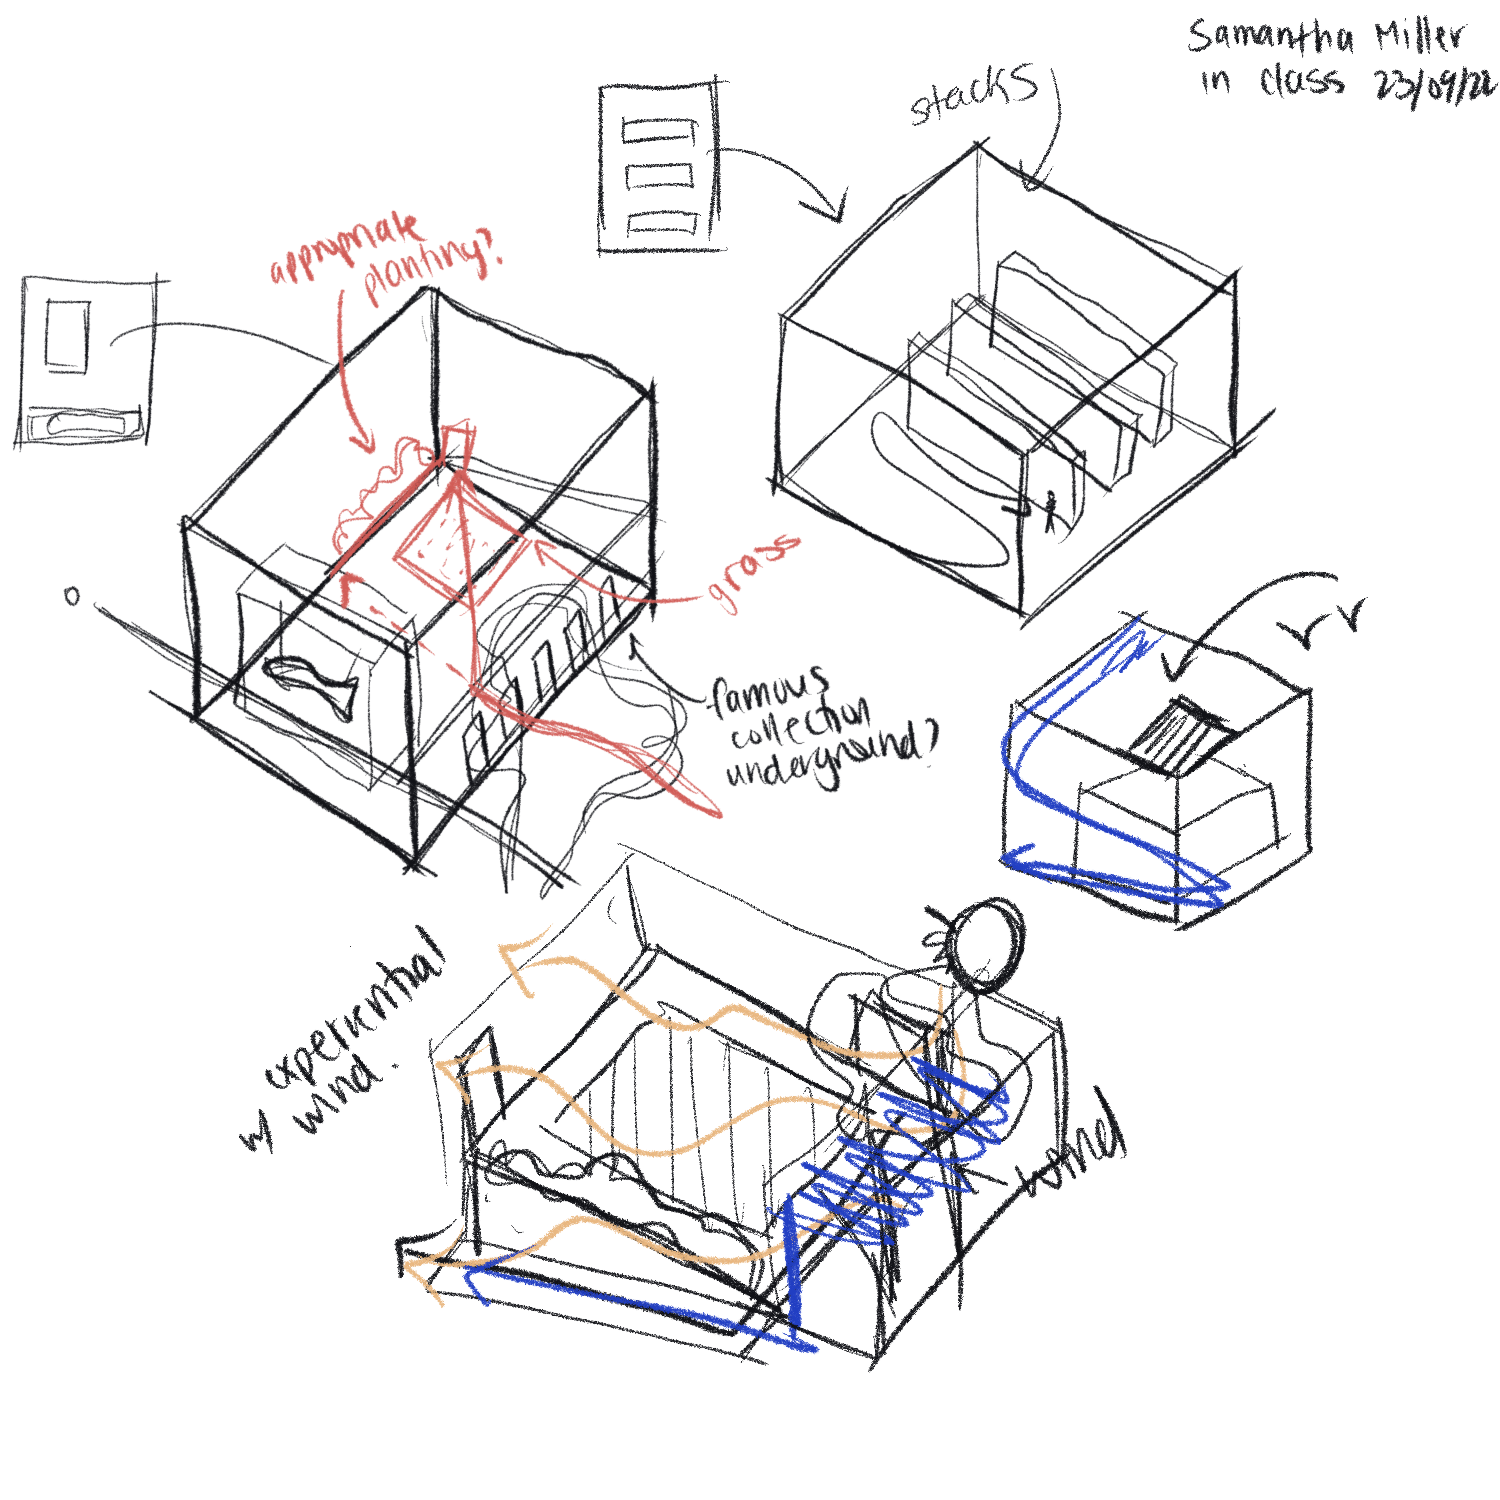


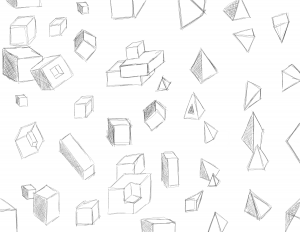
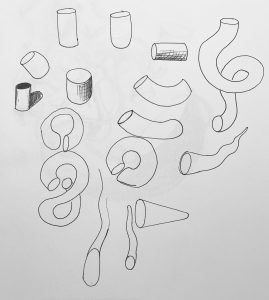
Cube Progression:

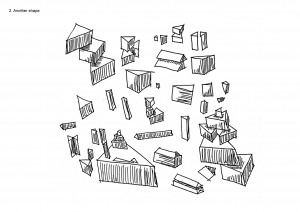
Alternate Shape progressions:

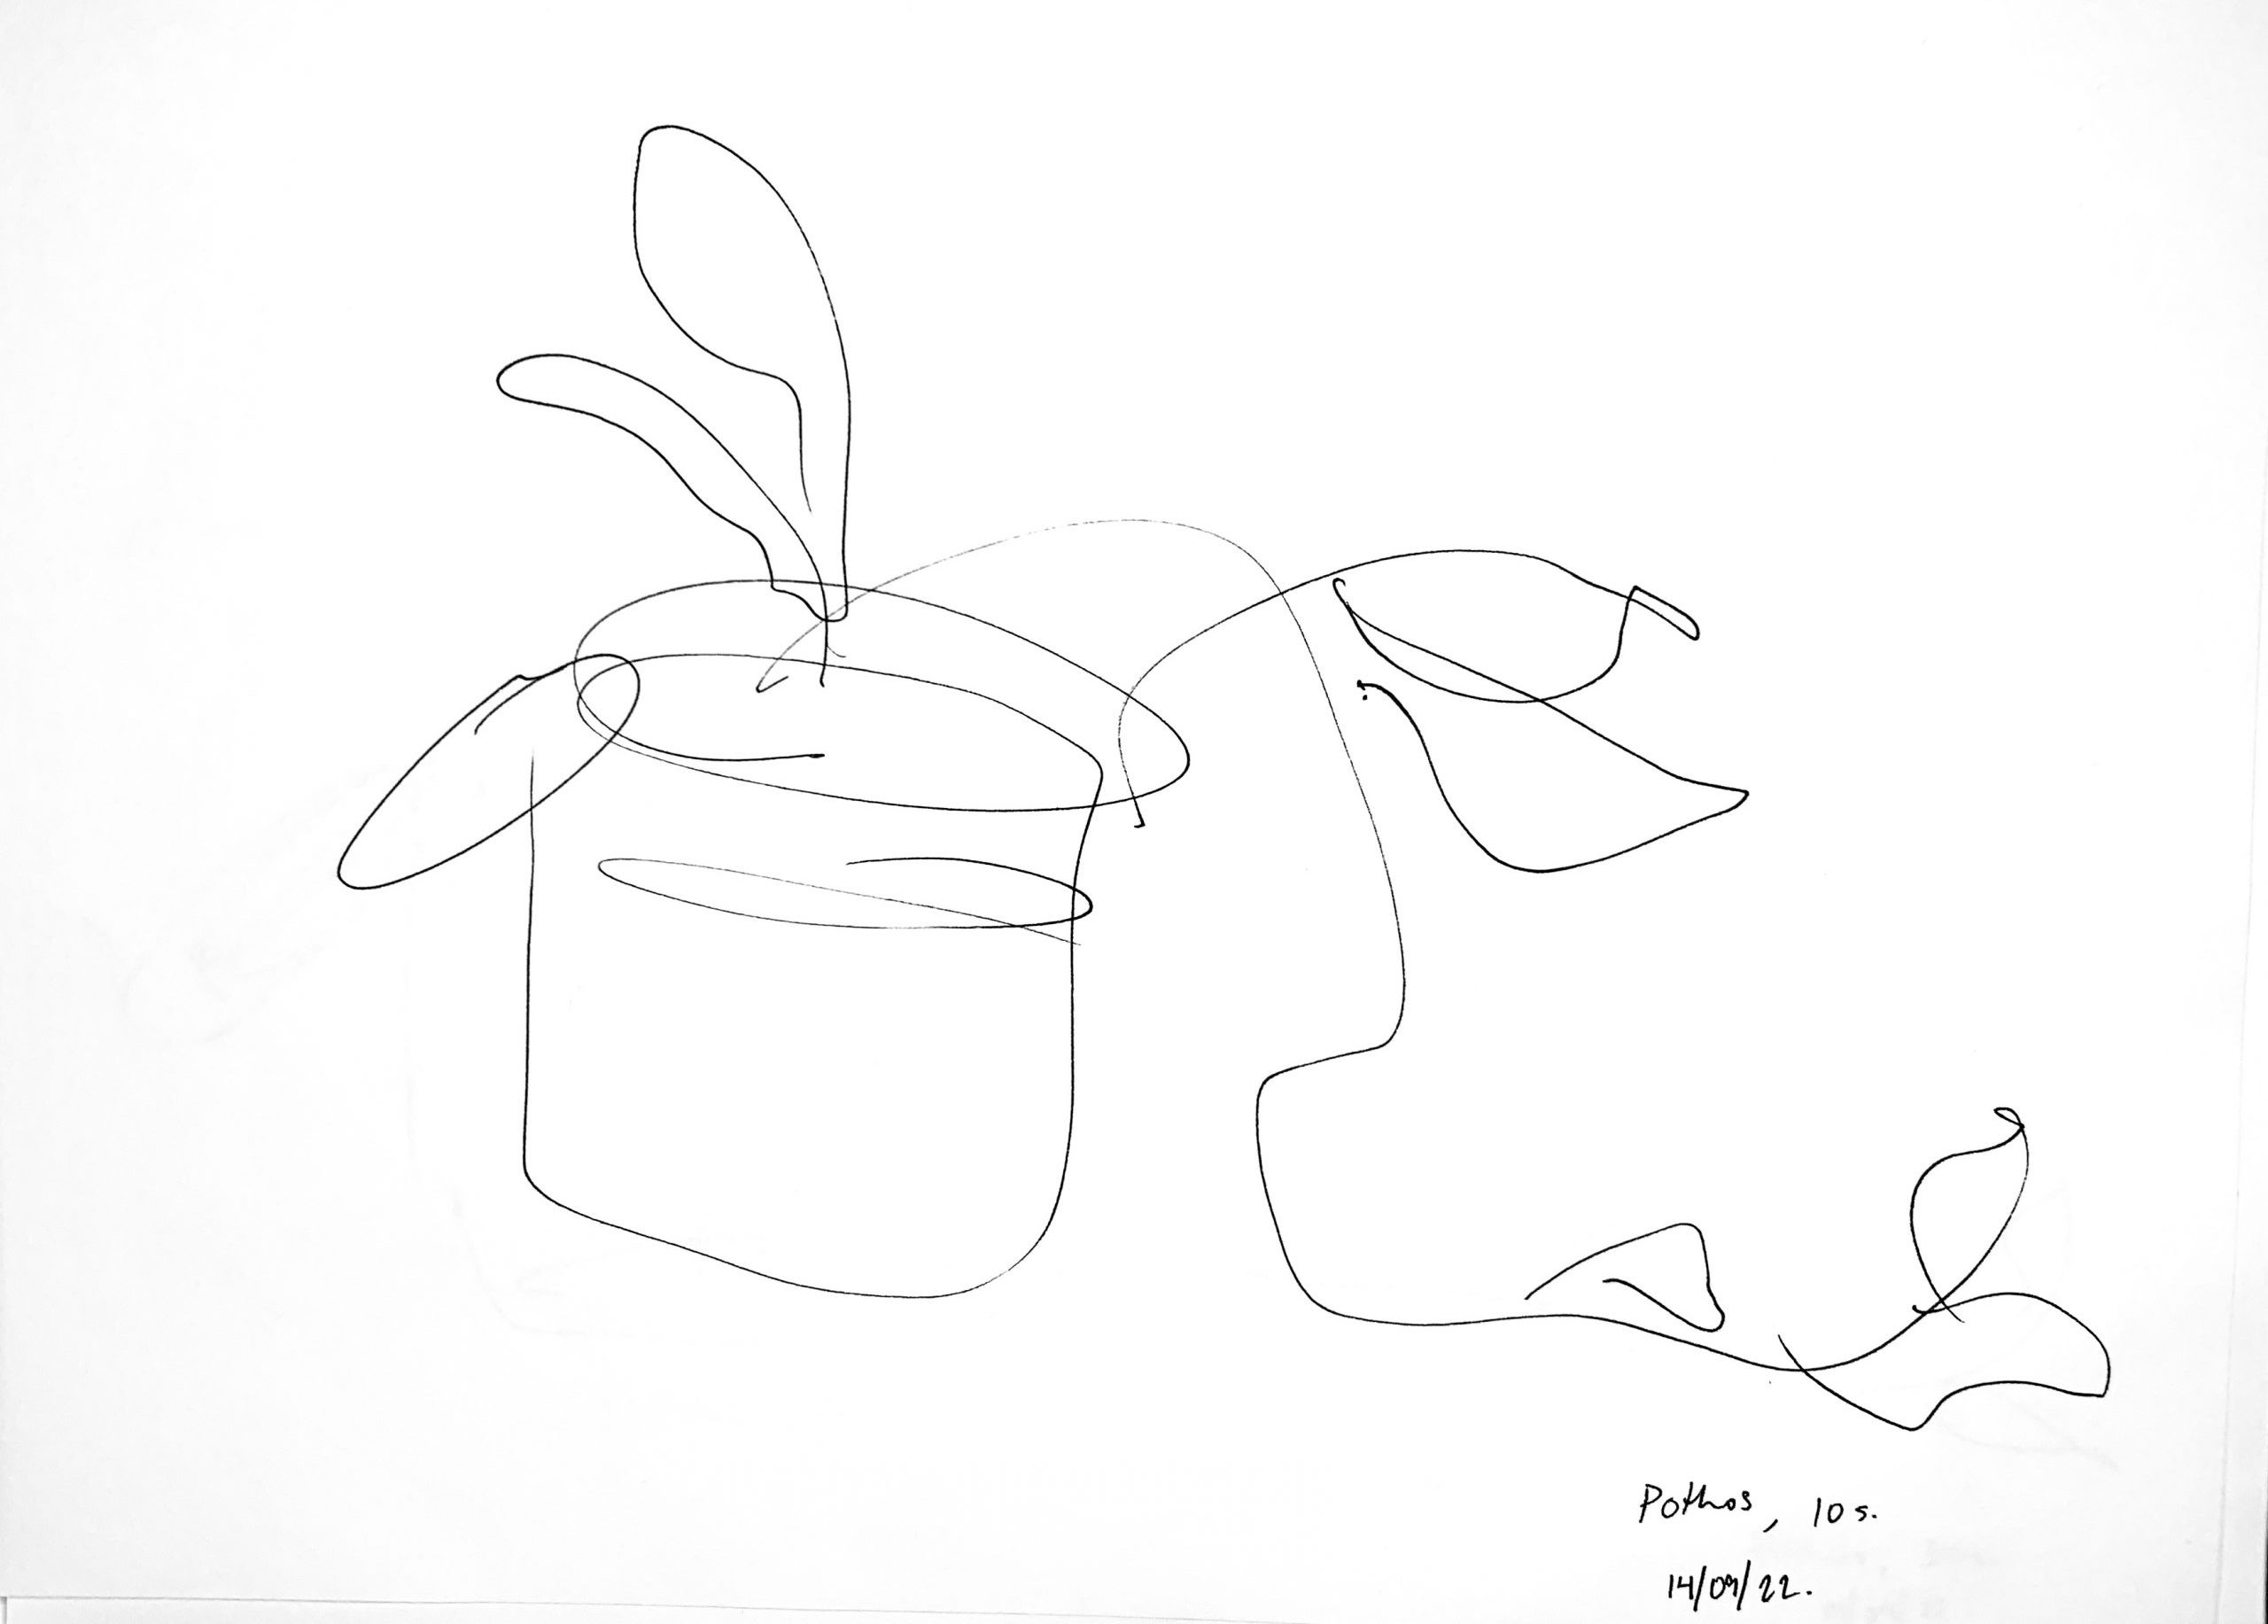
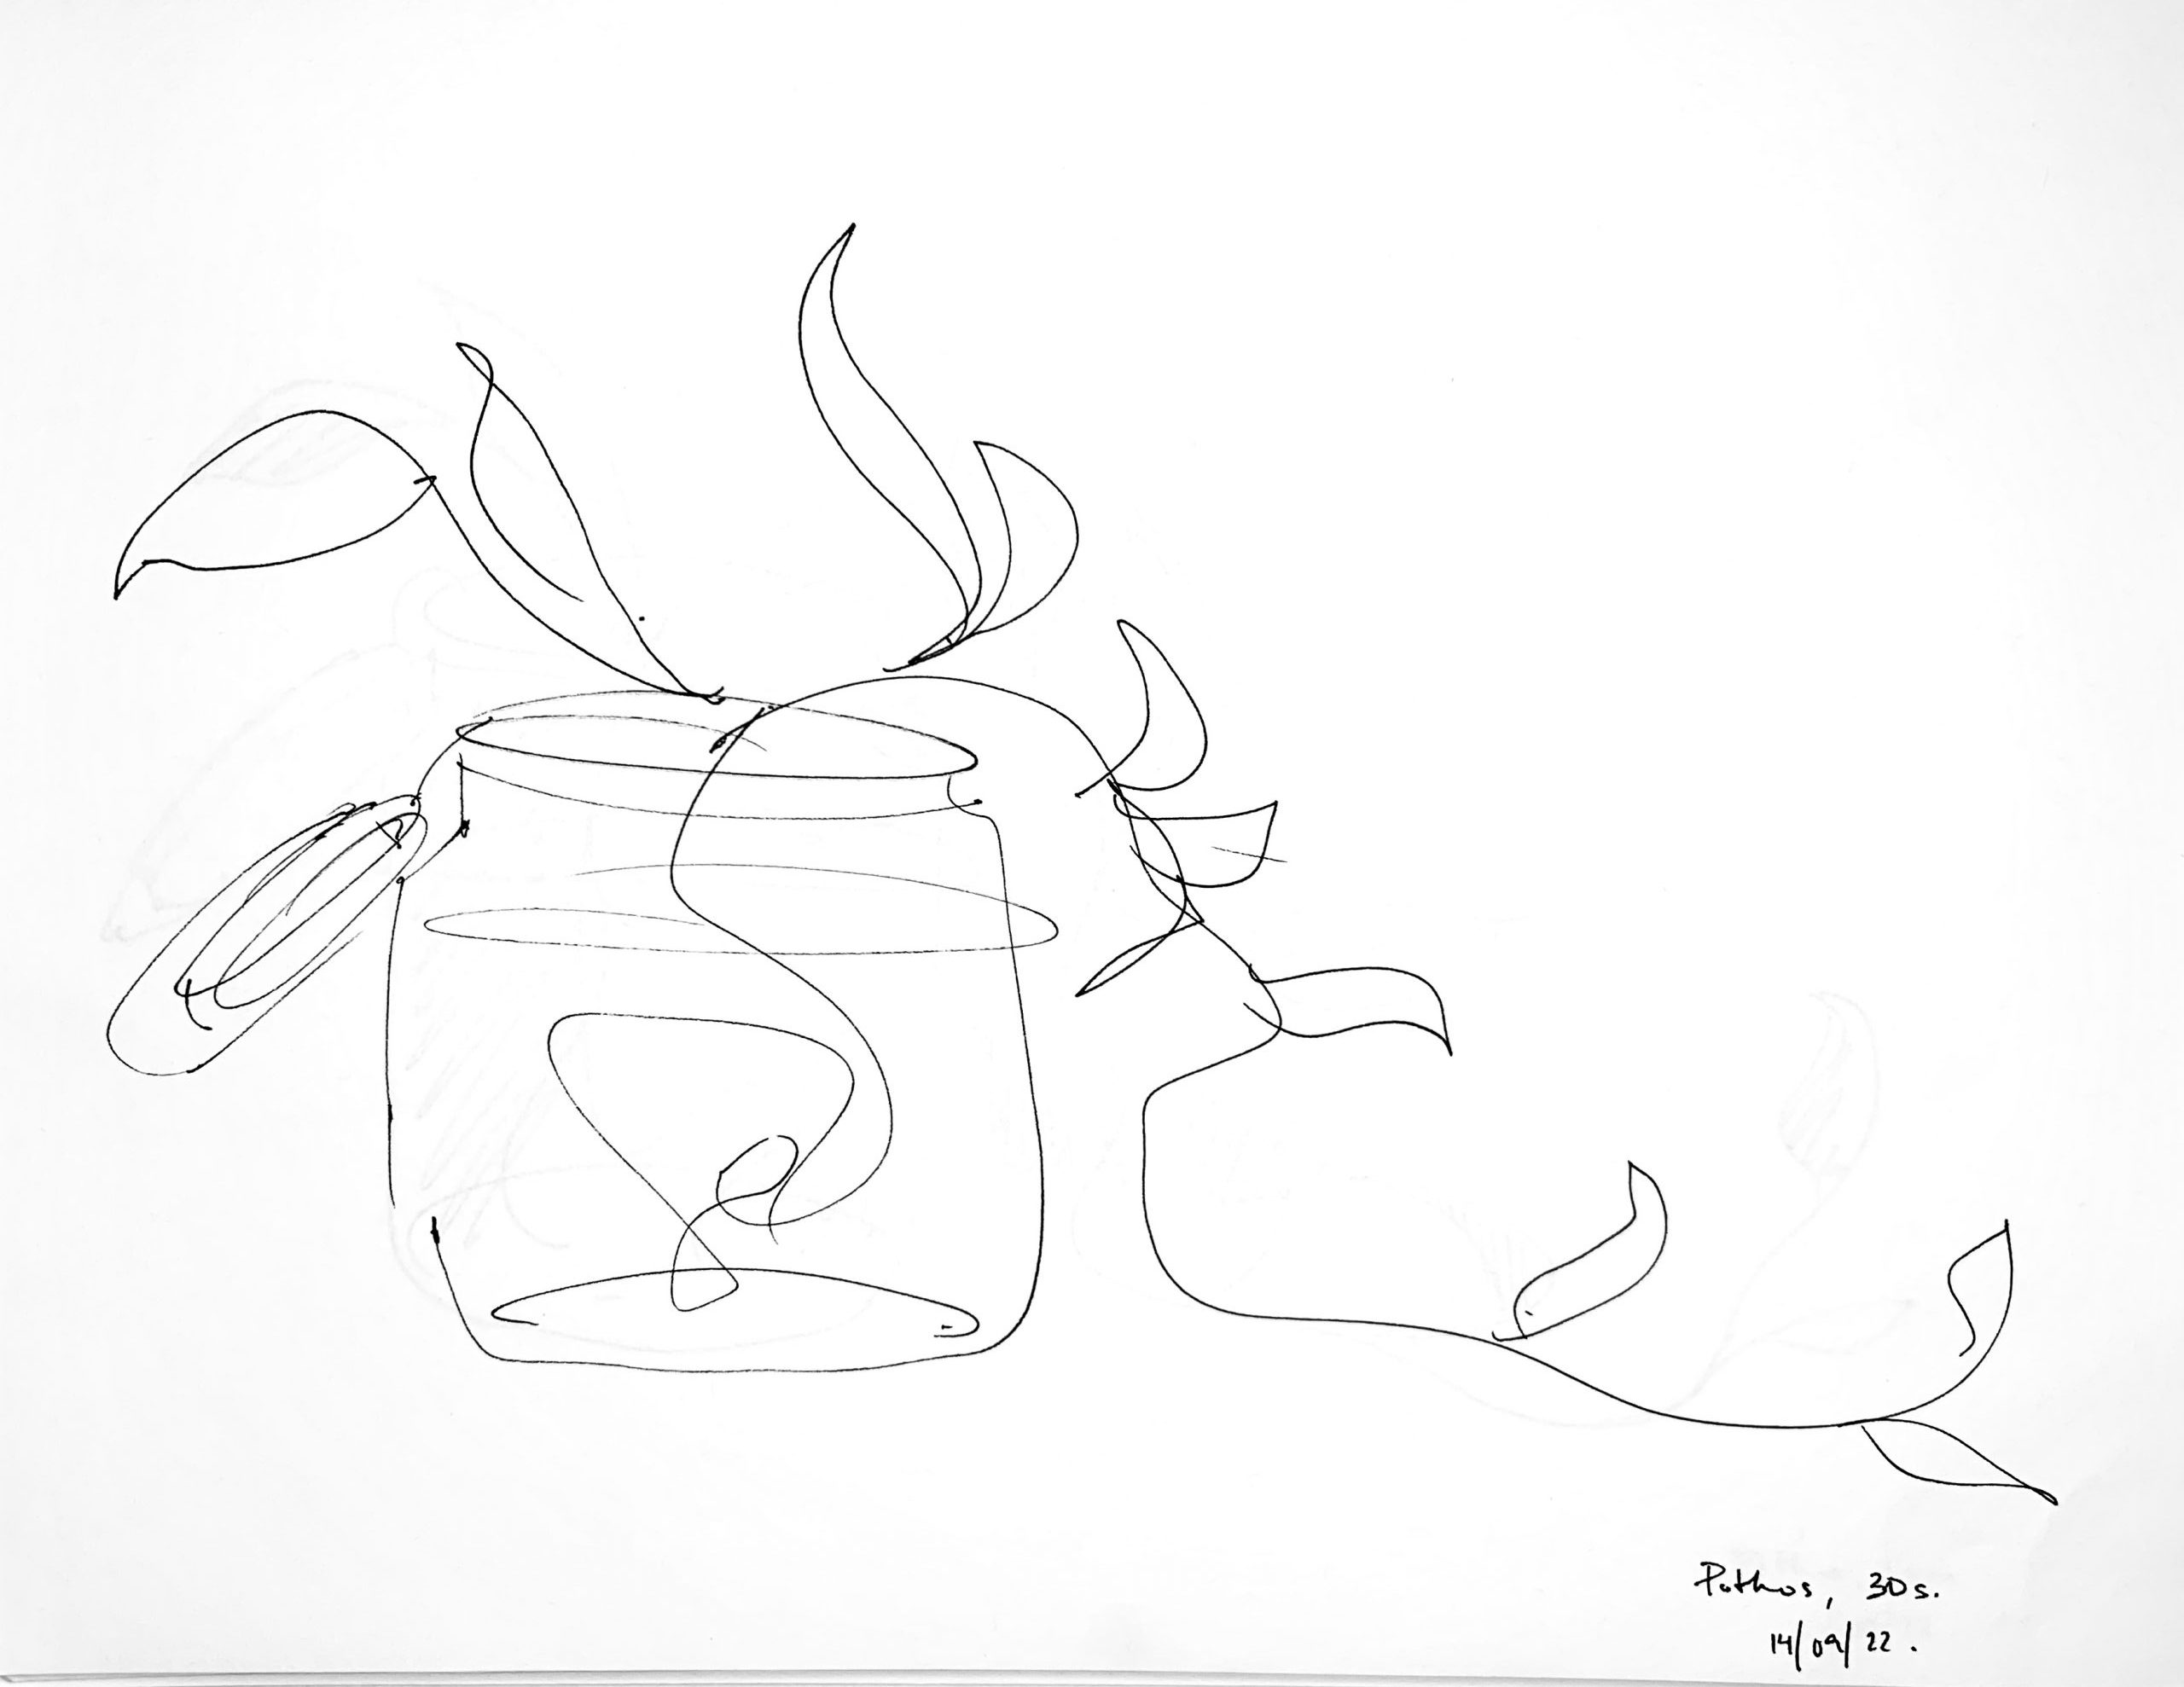
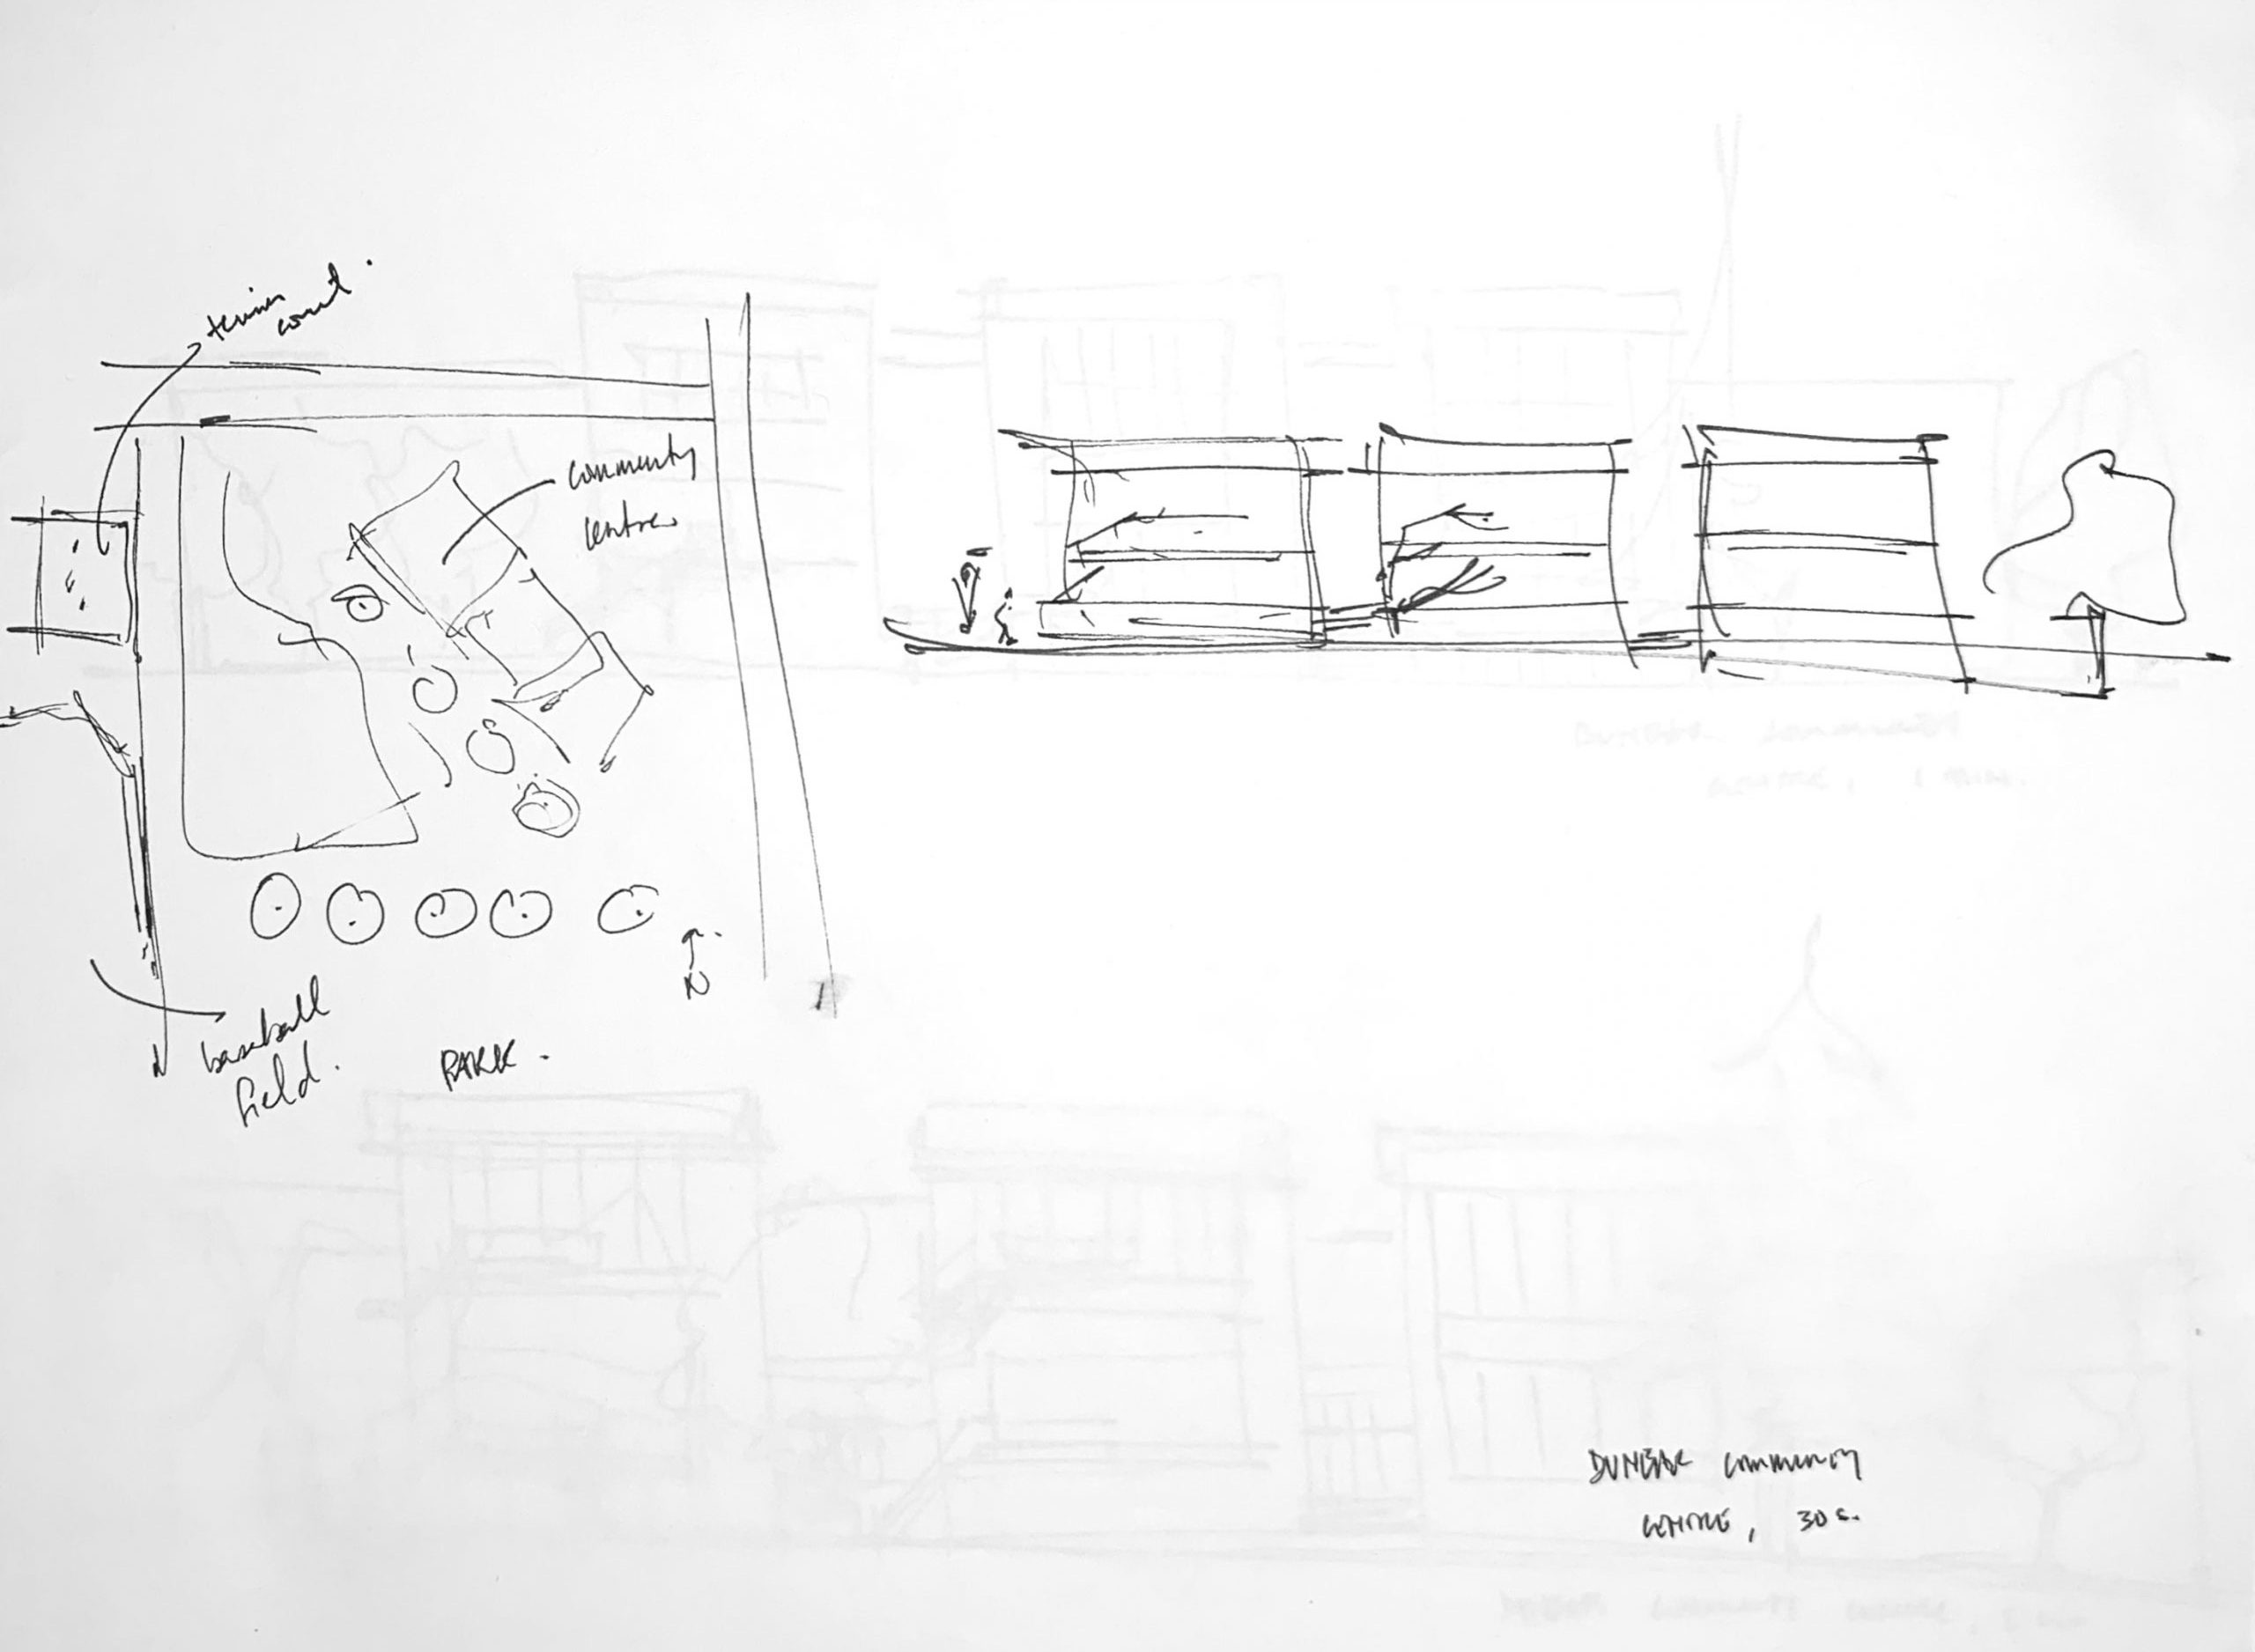
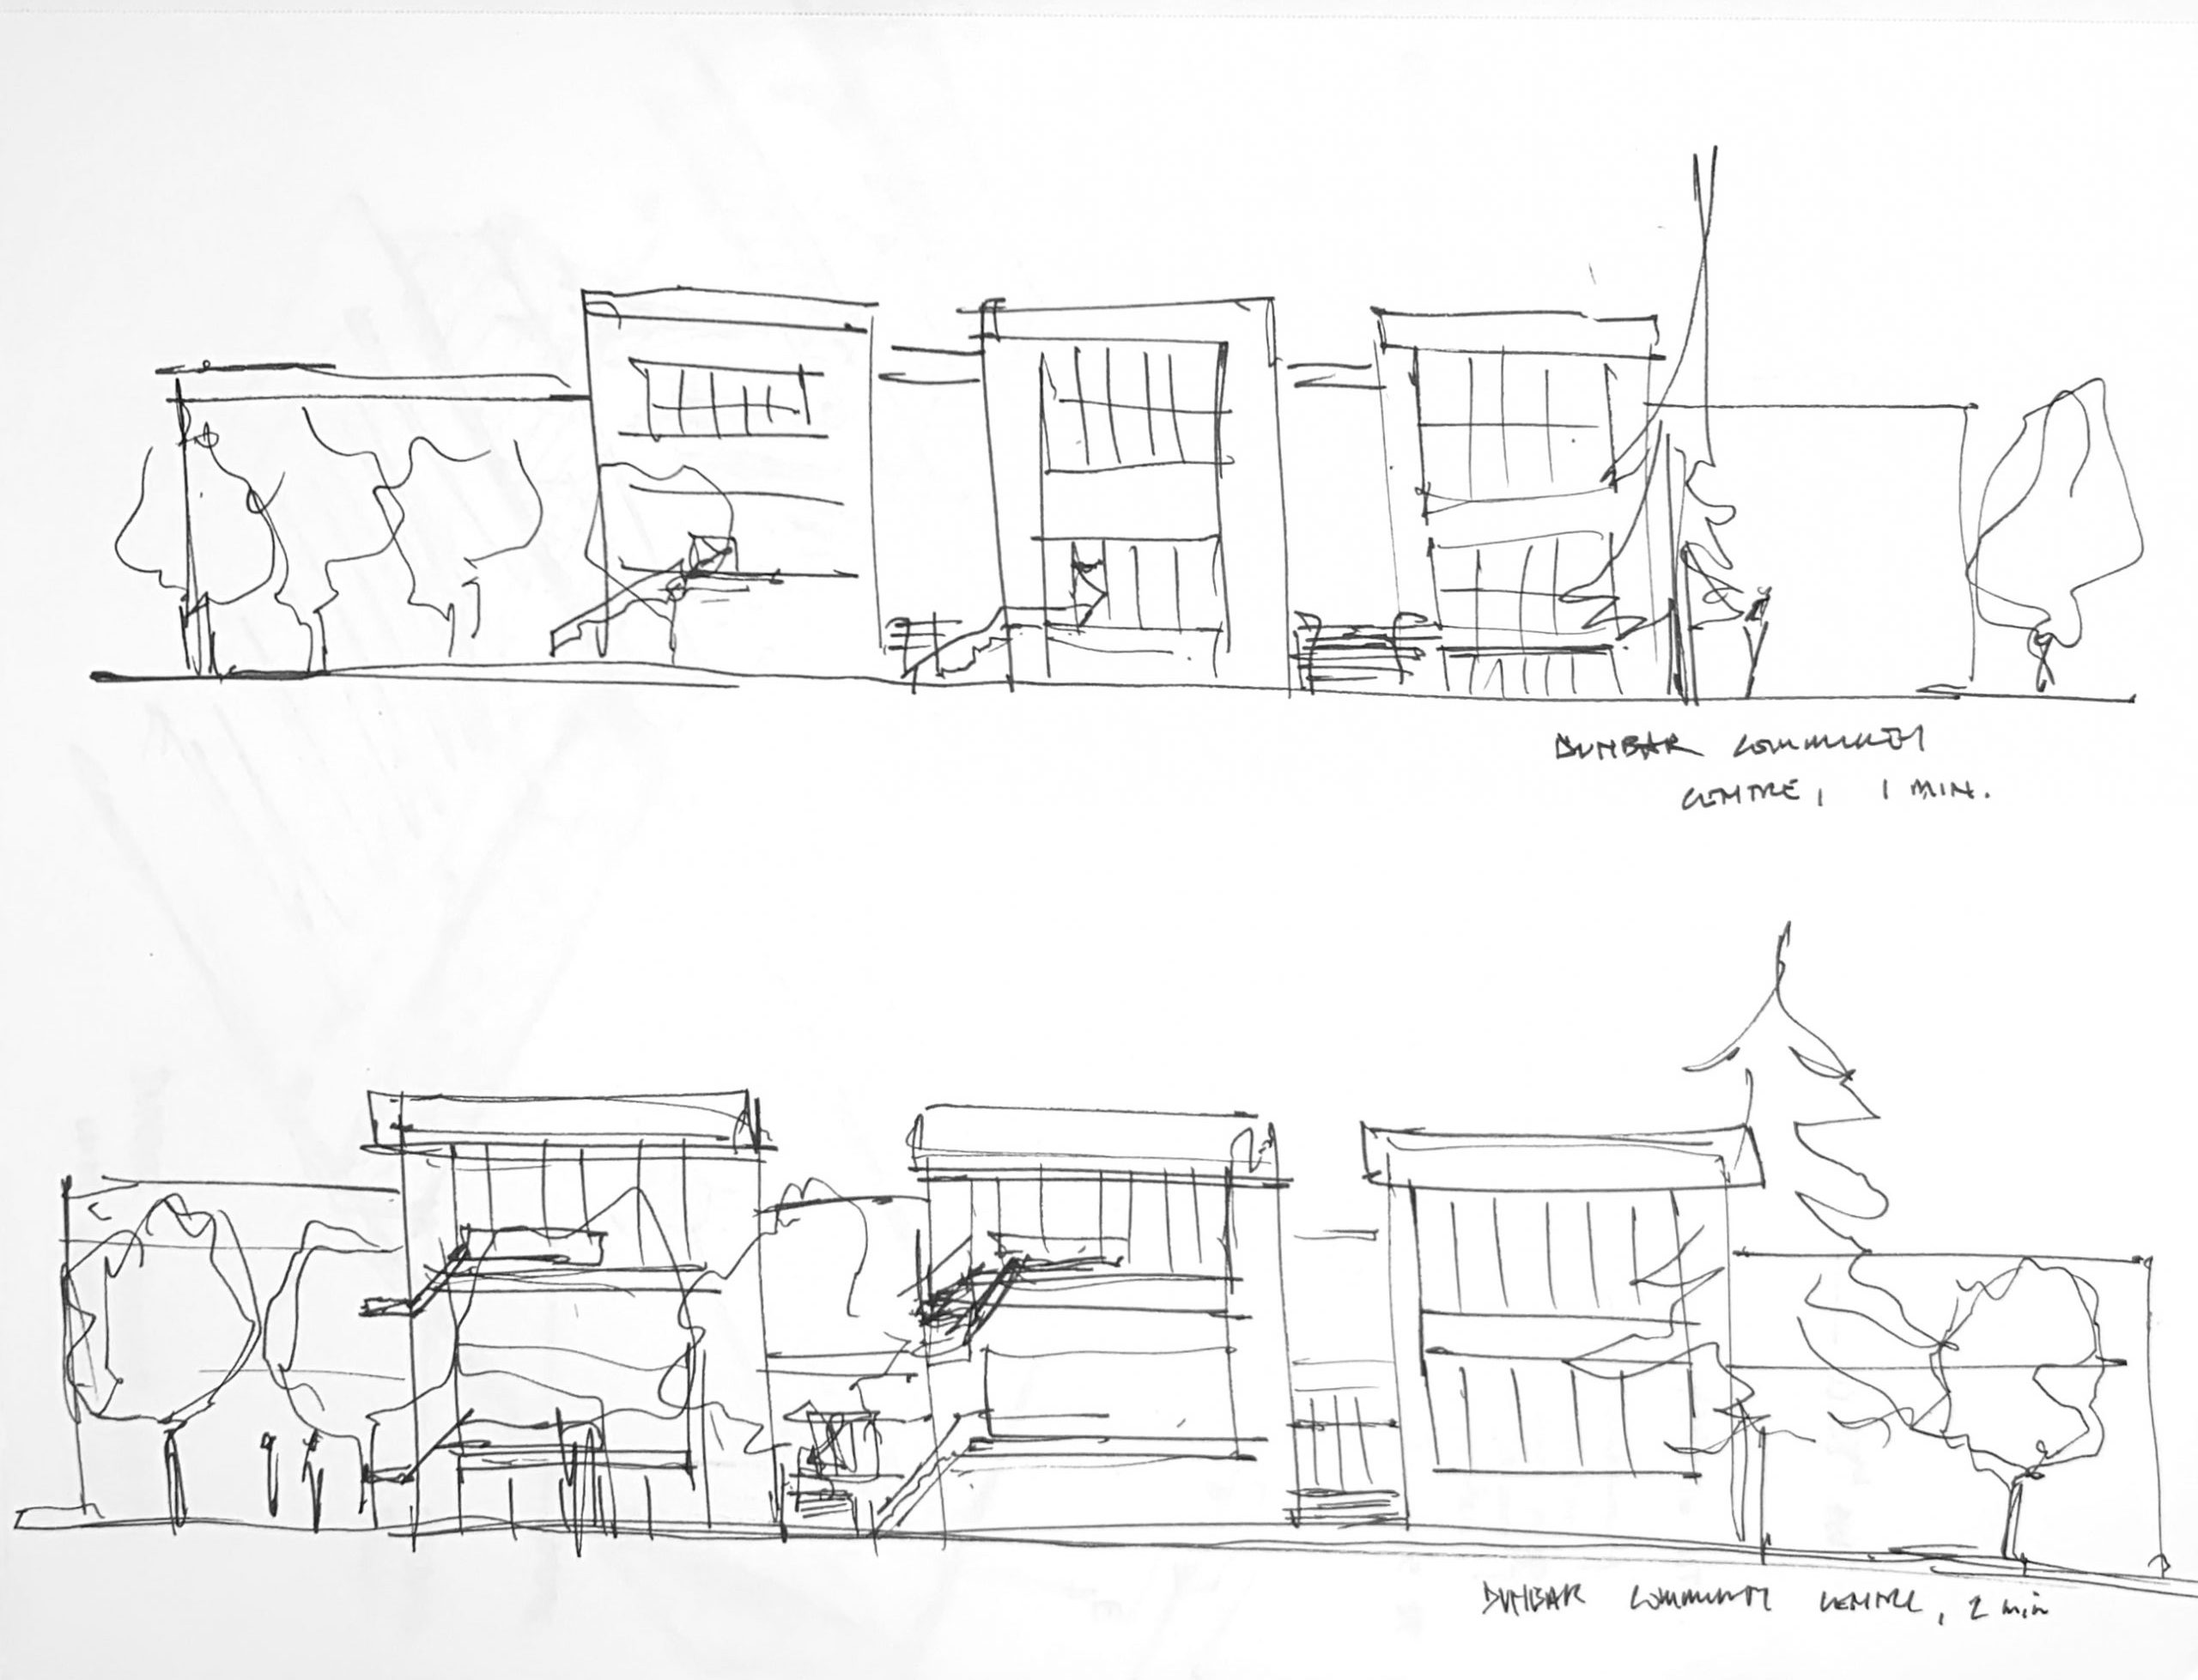
Close to home:
1(bottom) & 2(top) Minute:

5 Minute:
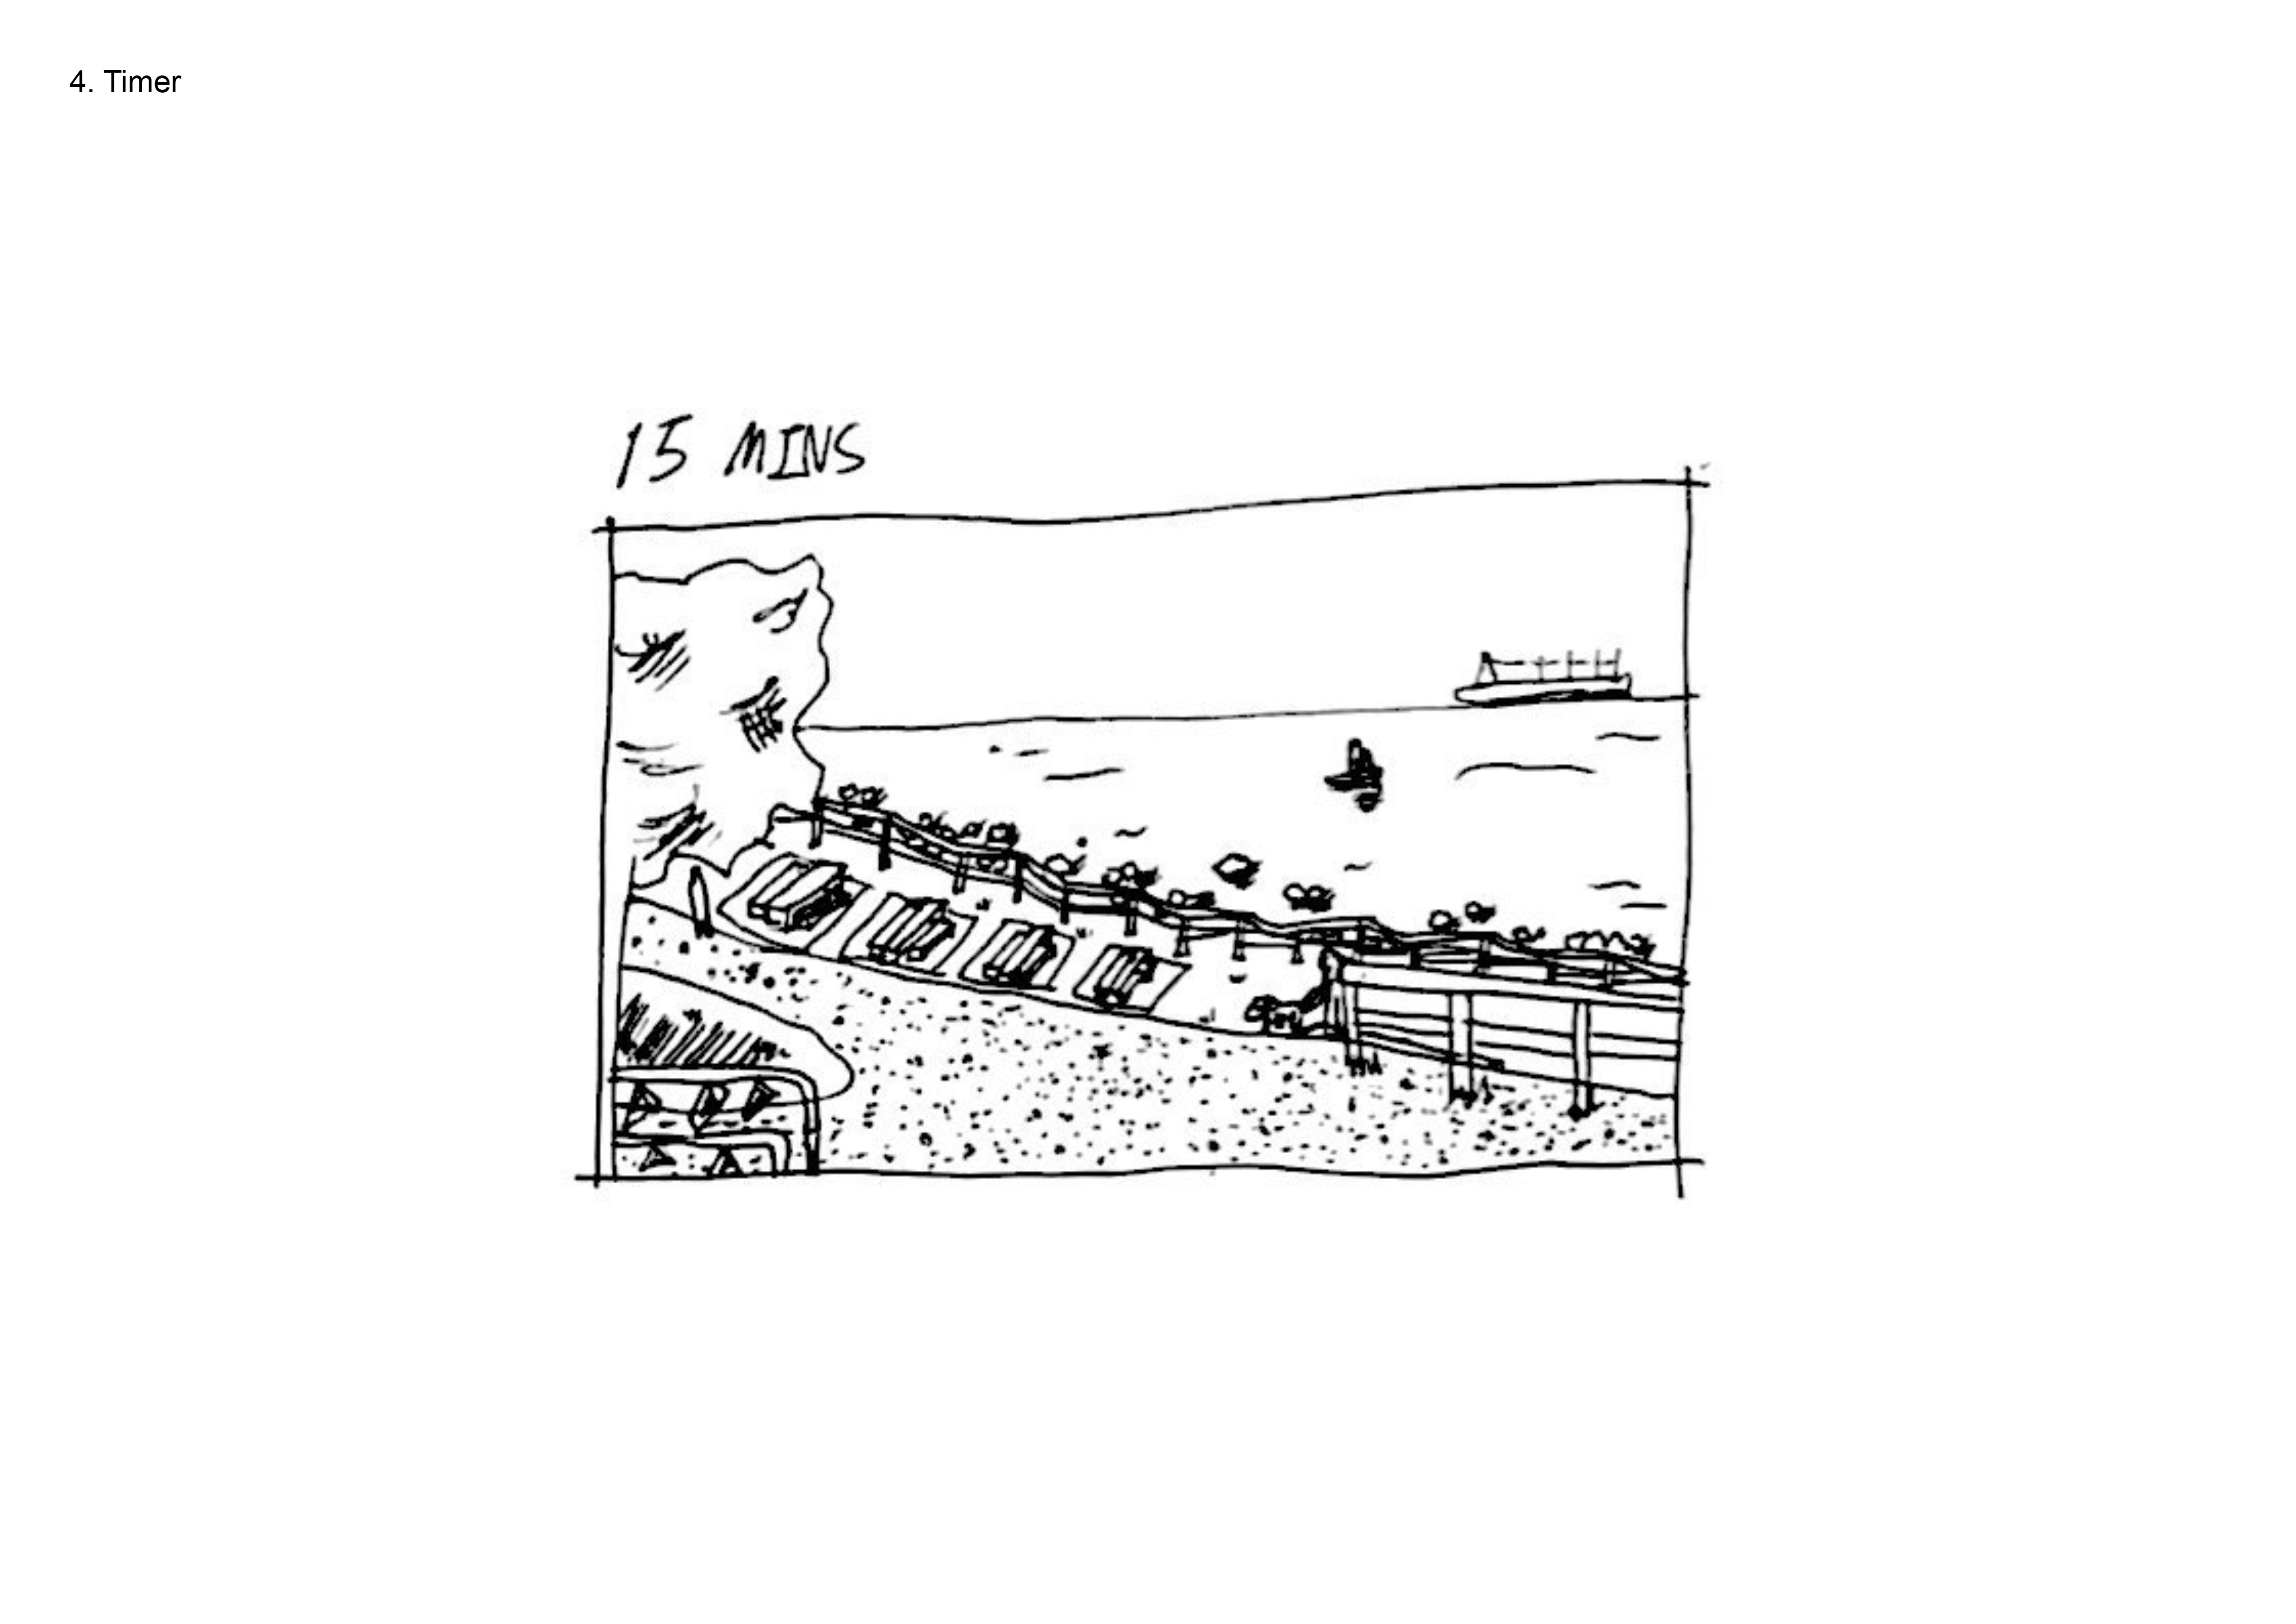
15 Minute:
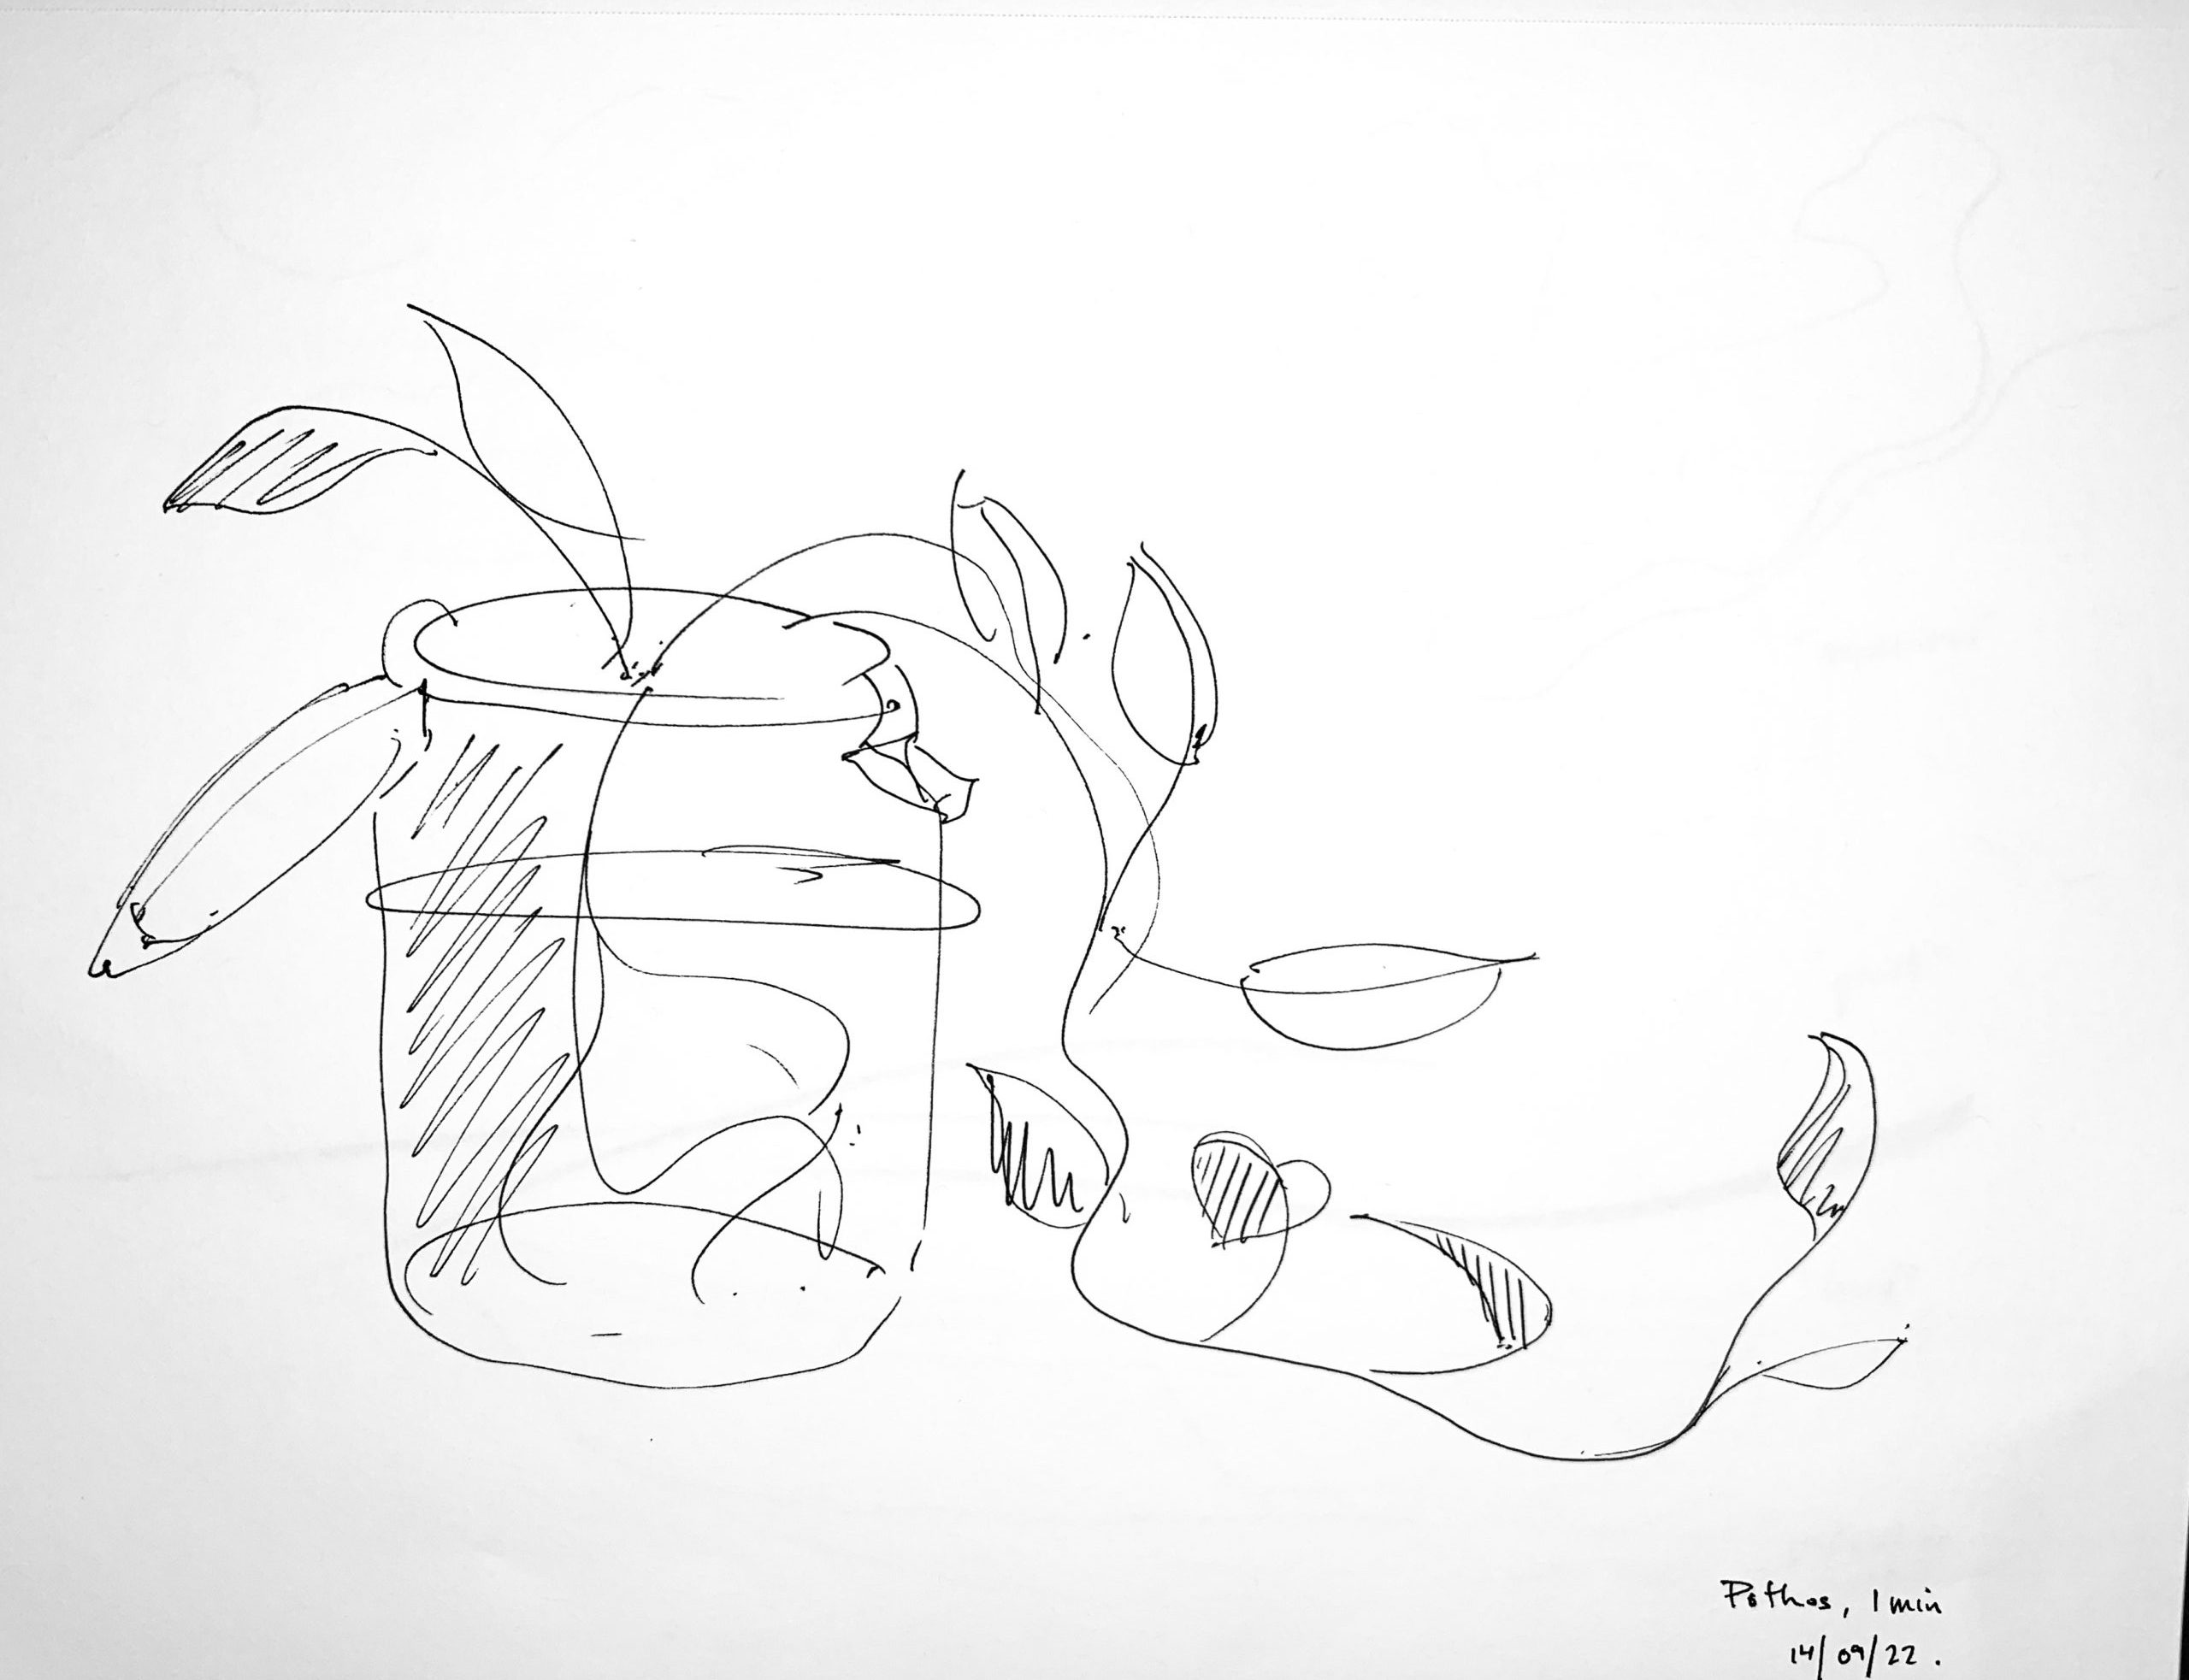
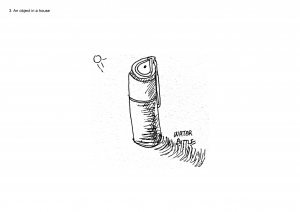
Object in the home:

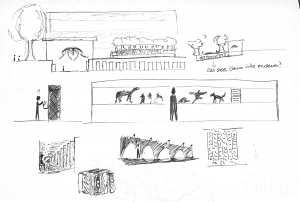
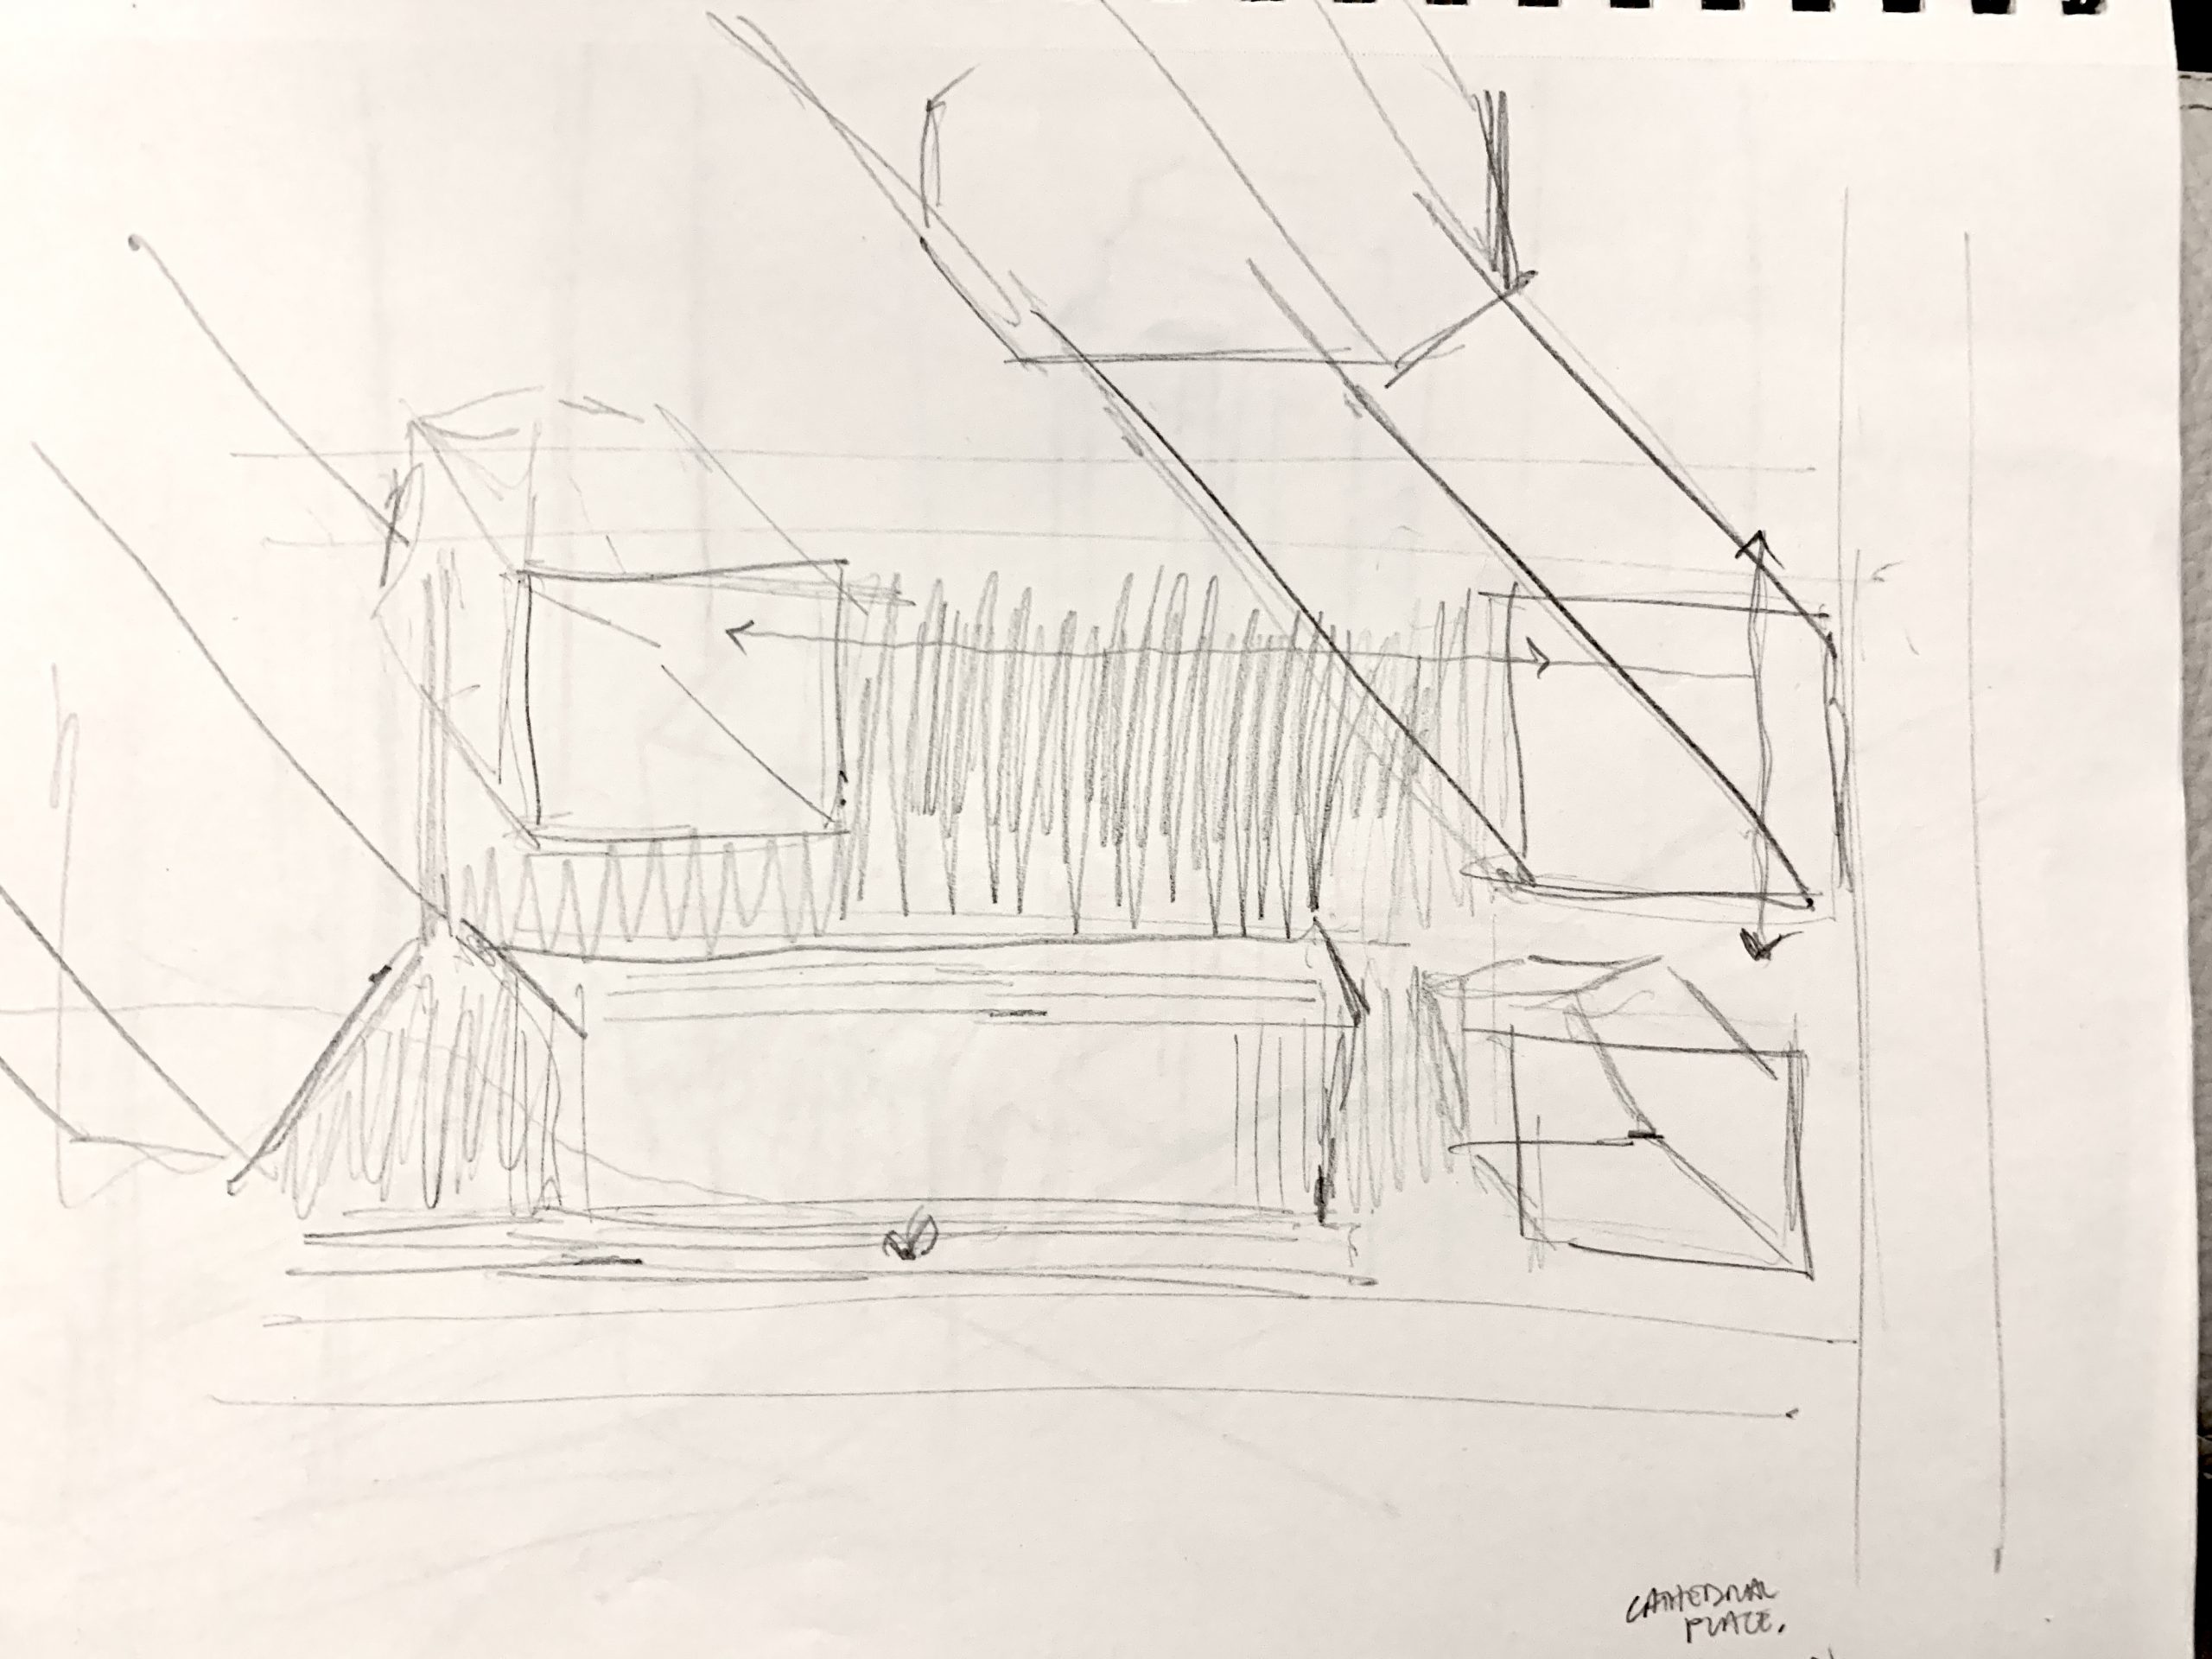
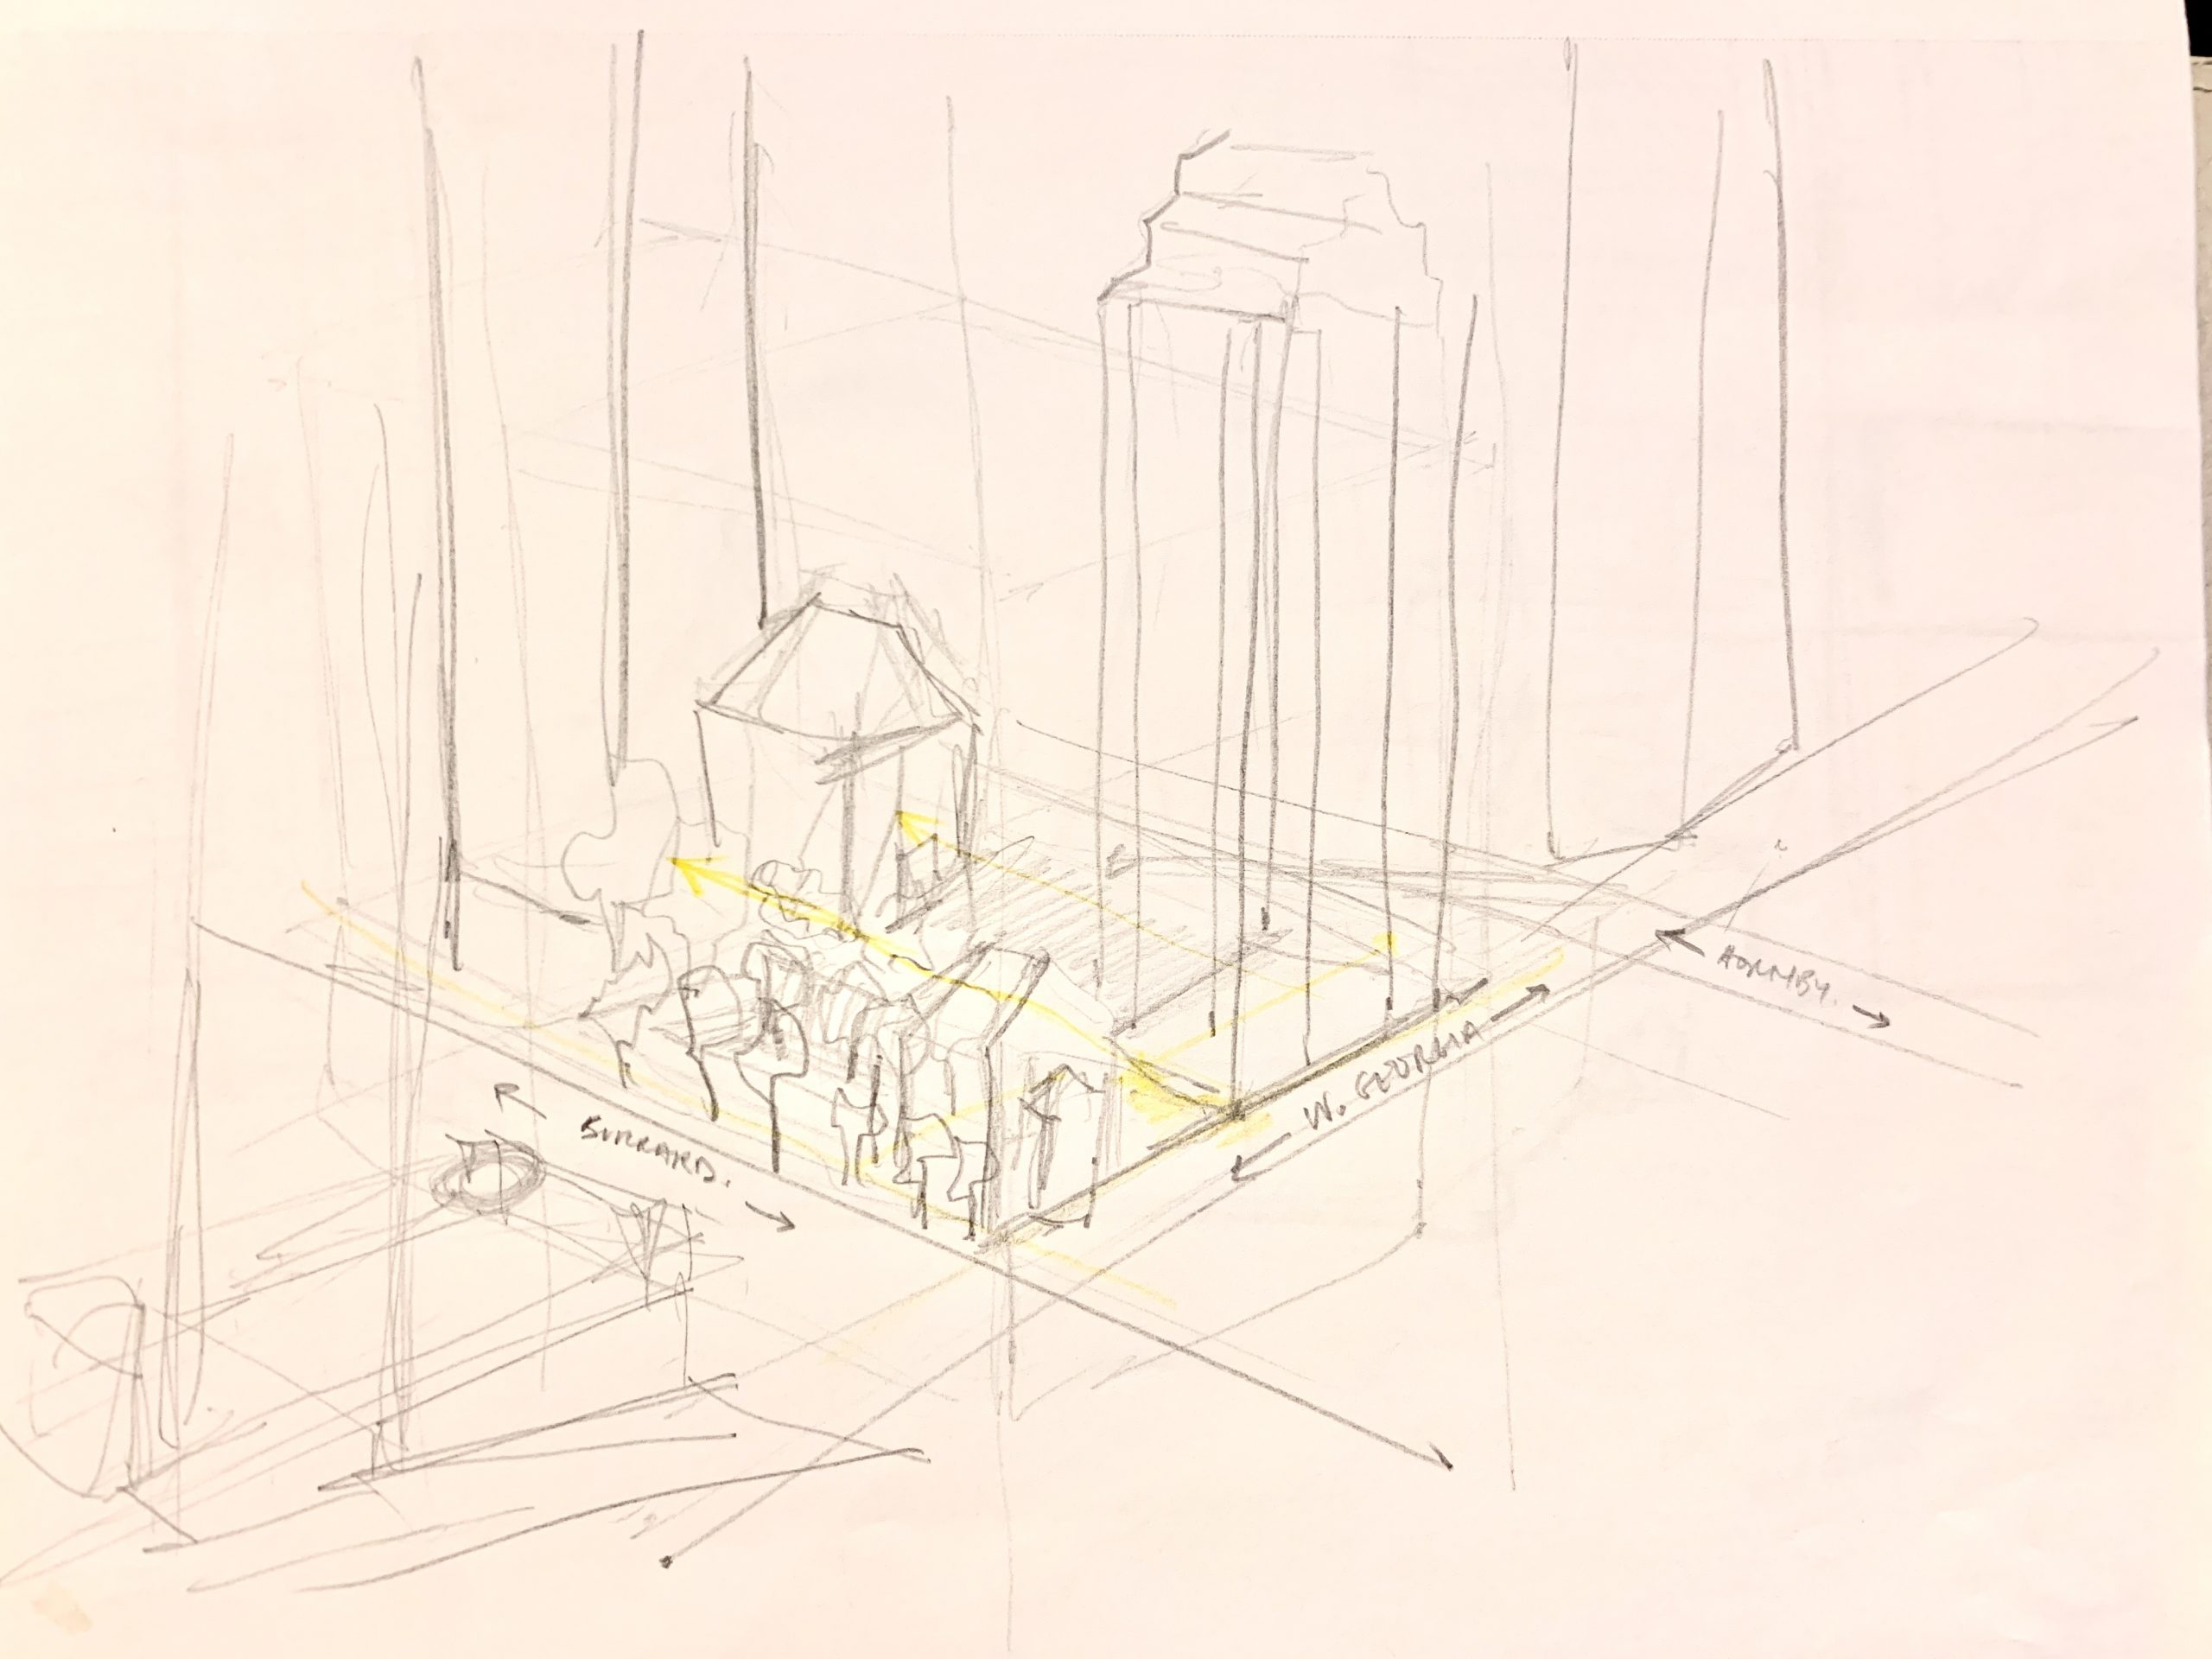
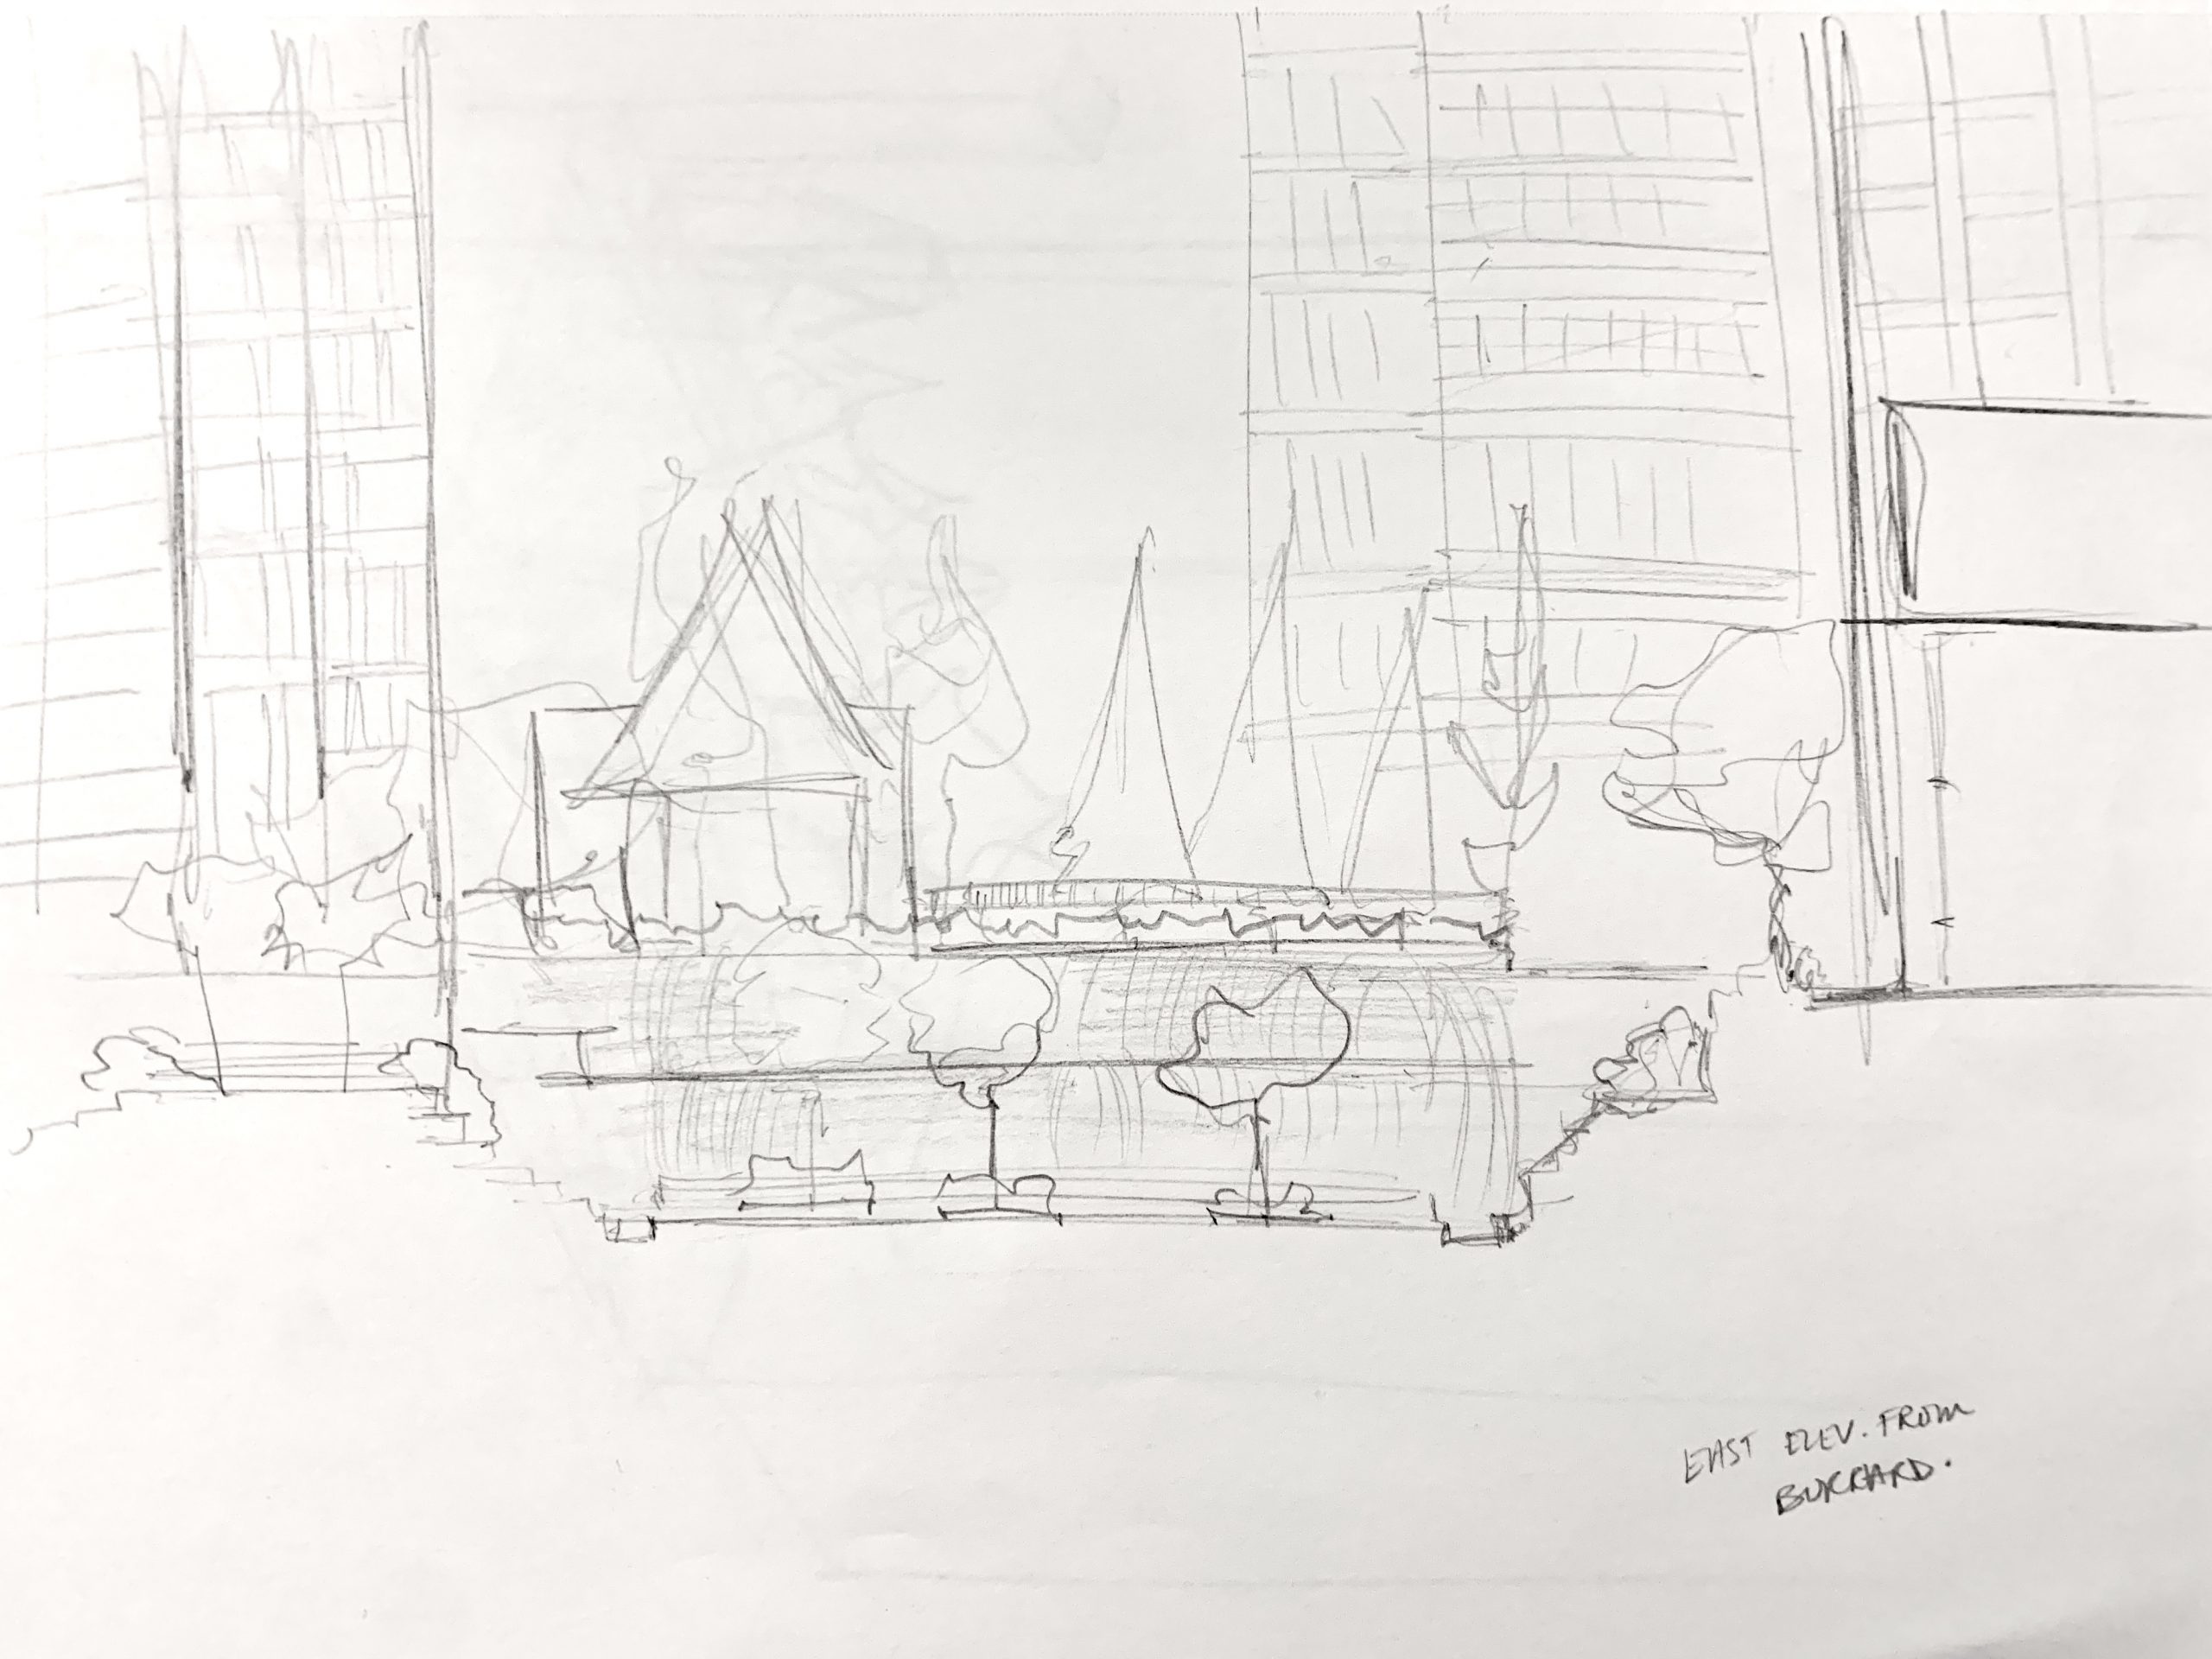
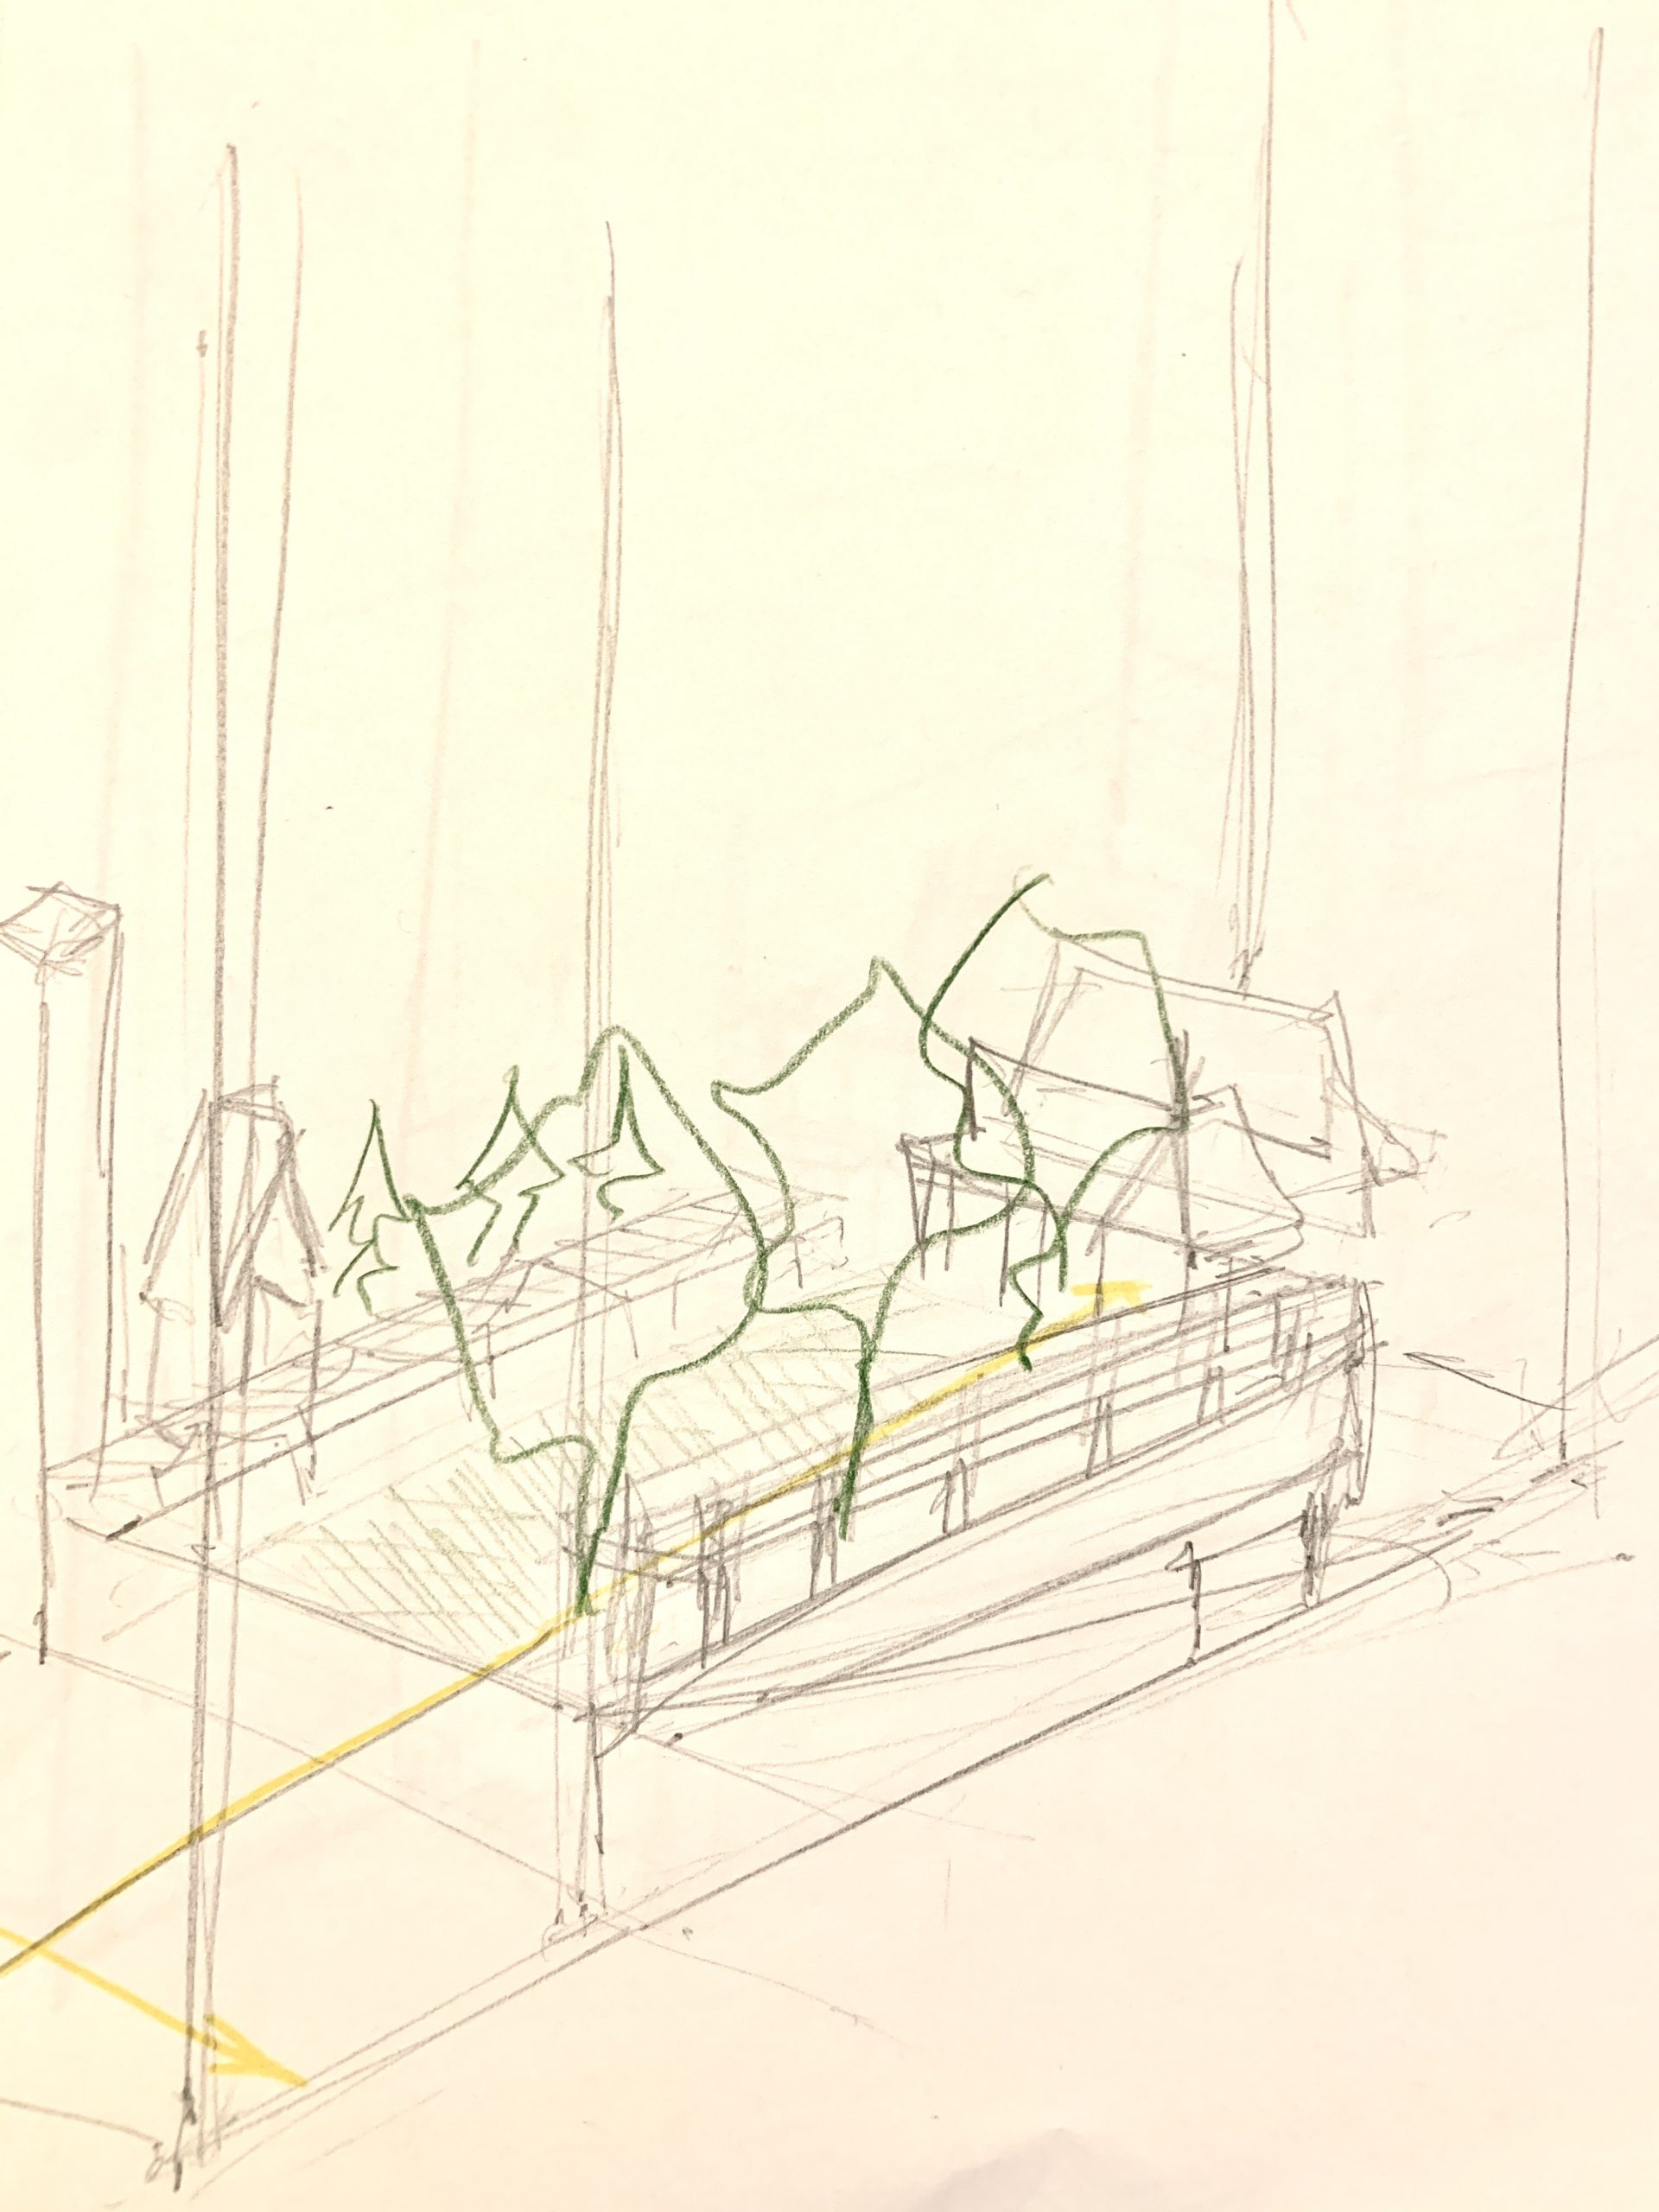
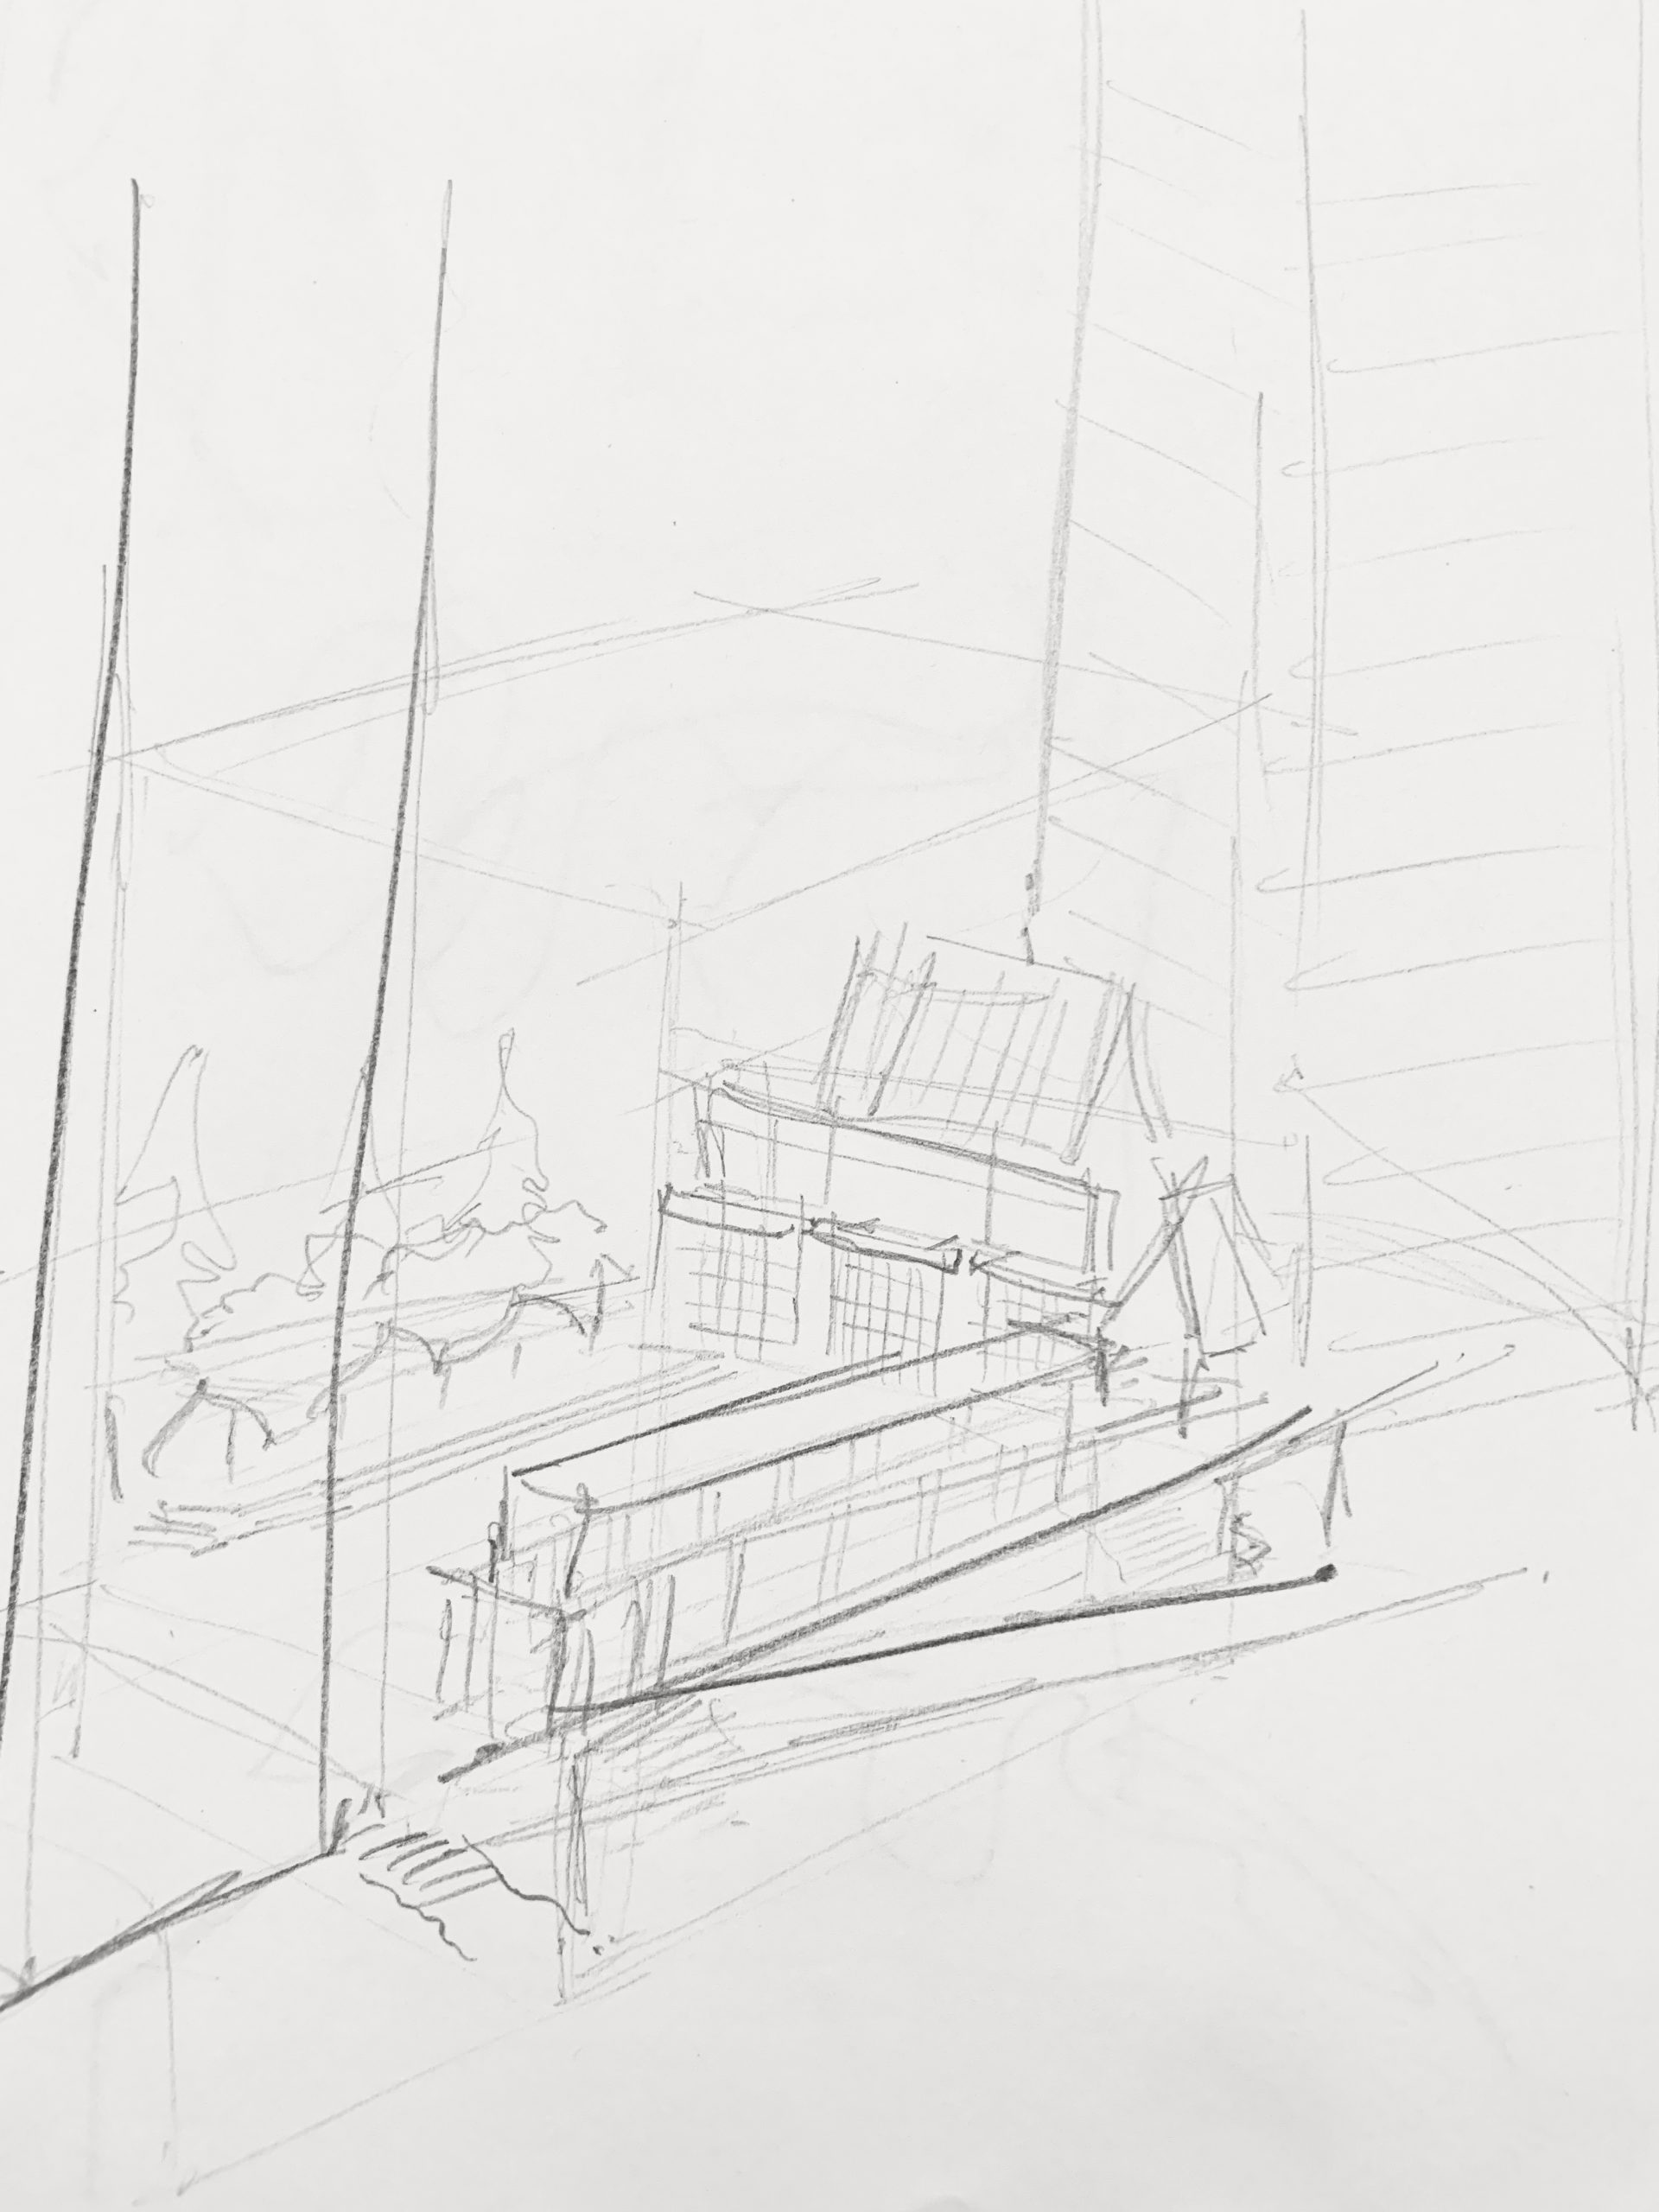
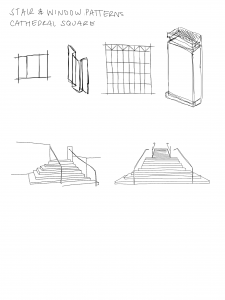
In-class sketches at Cathedral Park:
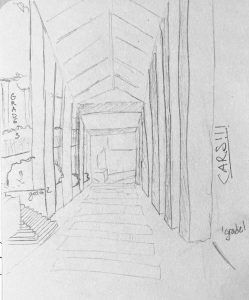
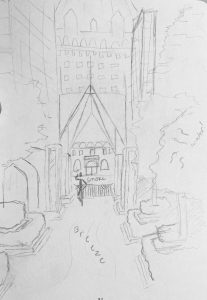
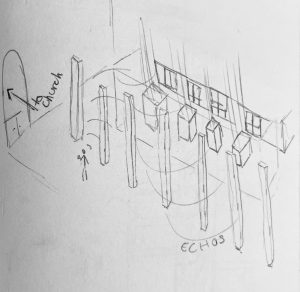
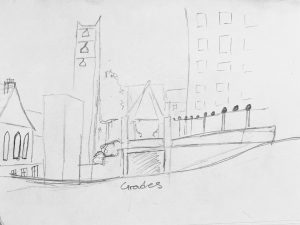

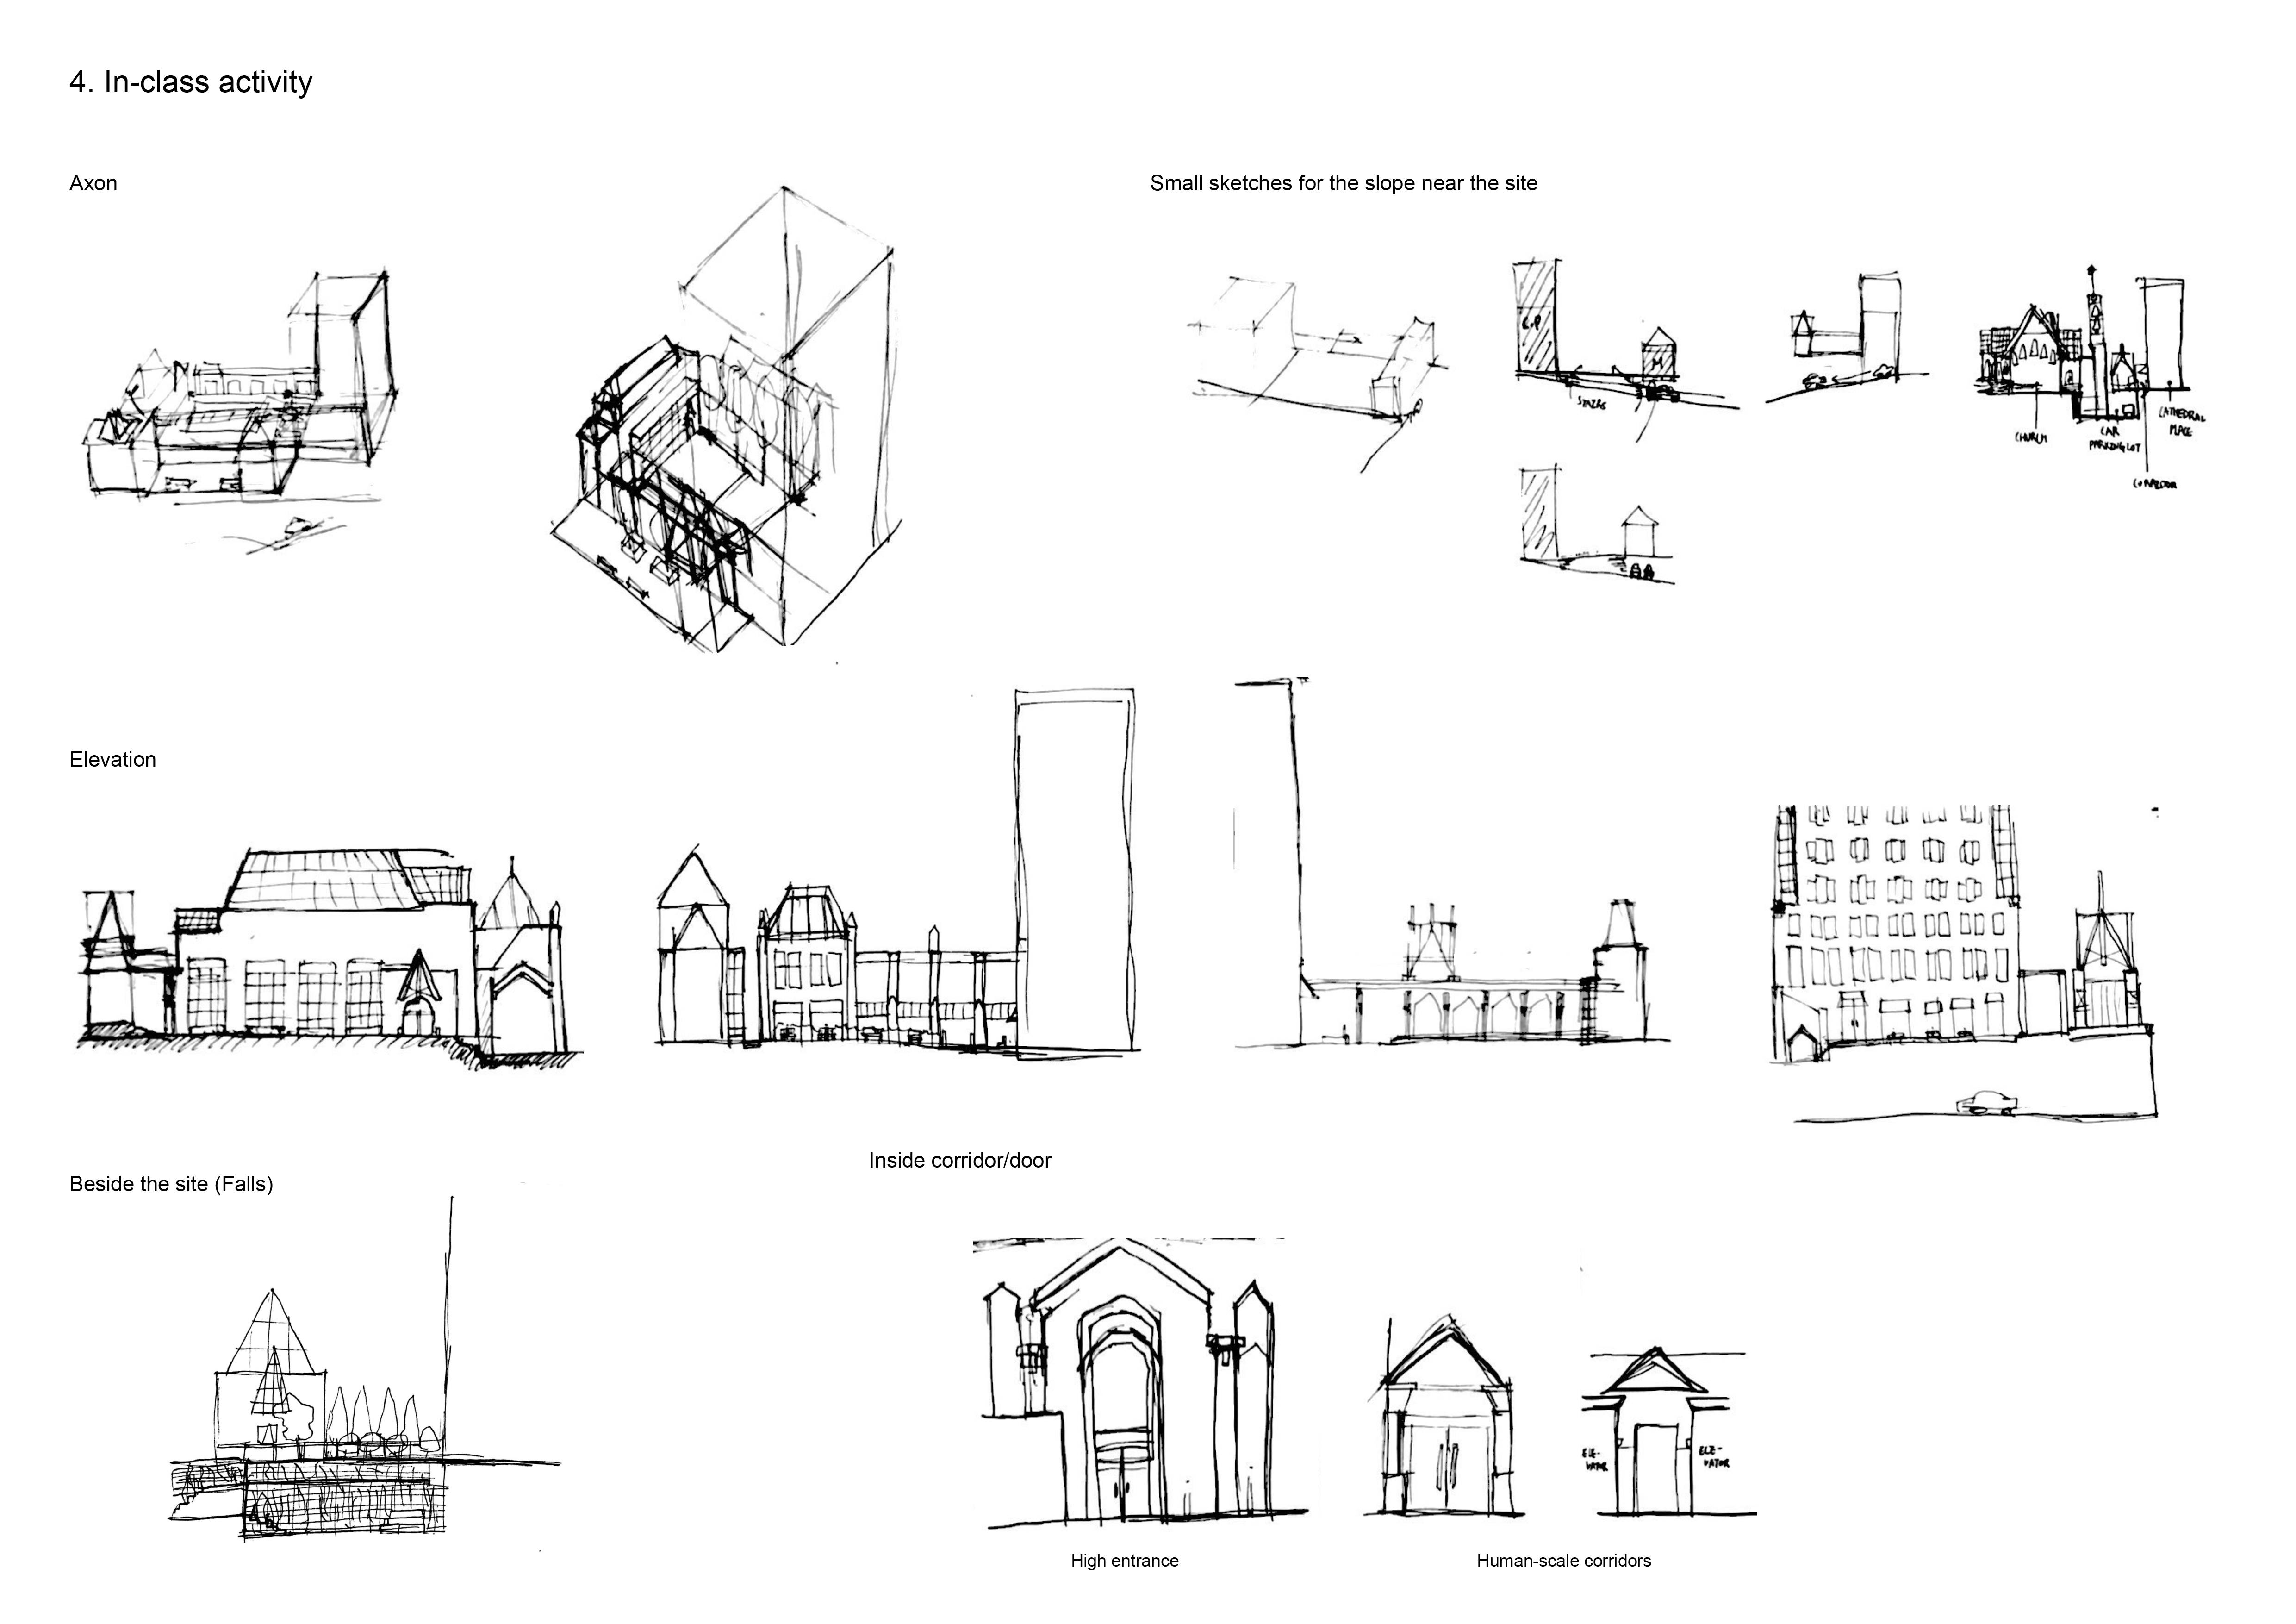
Cathedral Place, downtown Vancouver