Please note: the source for this material comes from the project work, and my contributions. For specific references, please see project website.
PDFs of all project maps can be found here.
summary of project:
The idea of this project stemmed from my interest in health geography. From the lecture content, previous GIS courses, and through my personal experience, I found fascination in using GIS for health care. Therefore, this group project enabled me to explore this concept, while improving skills in team work, task delegation, and GIS.
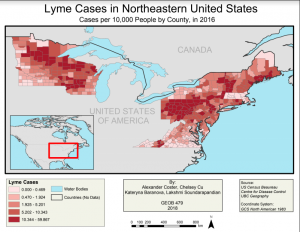
Focusing on Northeastern United States, this project delved into the spatial distribution of Lyme disease, the most common vector borne (or insect-caused) disease in the United States, and an endemic in Asia and Europe. In our area of focus, there were 38,069 reported cases of Lyme disease in 2015 alone (CDC, 2017; Adams et al., 2017). From previous years, it was observed that the geographical range of Lyme disease was increasing, as well as the number of reported cases. Spread by bacteria carrying tick bites, Lyme disease acts as a detriment to health for those infected. Hence, this presented the need for such a study.
An interesting part of this project was the use of MaxEnt, a technology which I had never used in the past. MaxEnt, a statistical probability software that uses maximum entropy modelling and various environmental factors to model the distribution of the species of interest, provided predictions of tick existence based on the ecological suitability of the variables used (Phillips et al., 2018).
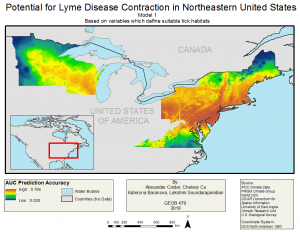
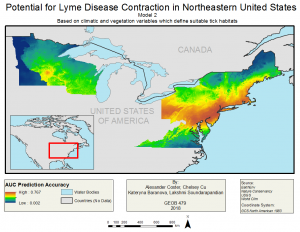
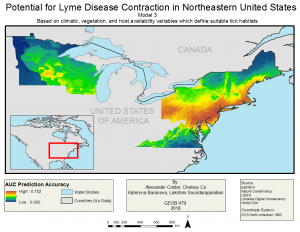
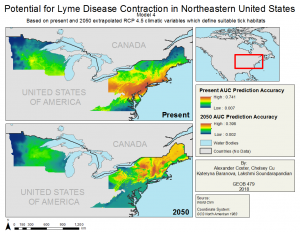
By investigating the ecological needs of ticks, this study used MaxEnt technology to create suitability predictions of tick habitats, and has produced four models that use ecological variables to infer tick existence. The existence of ticks was then inferred as existence of Lyme disease as well. Model 1 uses purely climatic variables such as temperature and precipitation. Model 2 uses climatic variables coupled with vegetation variables, Model 3 uses climatic and vegetation variables, along with deer population data, and Model 4 presents an extrapolation of climatic variables into the future. It was found that all Models produced a prediction accuracy of 74%, with the exception of Model 1, which produced an accuracy of 68%. The variables of mean temperature of the coldest quater, ecoregions, isothermal, annual mean temperature served as the best predictions of tick habitat suitability across all the models, when used both individually and in conjunction with other variables. Using purely the climatic variables, Model 4 predicted a spatial increase in tick habitats, and particularly a northward spread. Hence, it is clear that tick habitats, and therefore the chances of Lyme disease contraction, are increasing, with a high possibility of the disease moving into Canada.
What I found particularly interesting was how clear of a difference is seen between the maps of Model 4. The stark difference shows that Lyme disease is definitely increasing, which is in agreement to the recent studies that have been conducted on the issue.
All the maps produced in this project are shown below, along with the link to the whole project:
LINK TO PROJECT WEBSITE: https://blogs.ubc.ca/geob479lyme/