Summary
In this post, PCA climate spaces are built from interannual climatic variability at centroid surrogates instead of spatial variability of climate normals. I found that patterns of spatial variability dominate the climate space because the spatial variation at the regional or provincial scale is much greater than the scale of interannual climatic variability at individual centroid surrogates. The conservation of spatial variation has the advantage that both spatial and temporal variability are represented in the reduced climate space. However, it has the disadvantage that temporal variability is inefficiently compiled into the principal components. I’m not sure of which method will help to address this issue. Another problem specific to PCA is that large variability in winter temperature causes related variables high weight in the PCs, even though there is little spatial variation in winter temperatures. This problem can be solved using LDA. Finally this post introduces the use of standard deviation of z-scores as a multivariate measure of interannual climatic variability.
Next steps are to experiment with discriminant analysis for this same purpose, and expand the analysis to assessment of climatic differentiation between BEC variants.
Introduction
To this point, I have been building multivariate climate spaces using spatial variation in climate normals. In this post, I take my first steps into climate spaces built from interannual climatic variability. The multivariate data set for this analysis is the annual climate elements at each BEC variant centroid surrogate for individual years in the 1961-1990 period. For conceptual simplicity, I use PCA for this stage of exploratory analysis.
Results
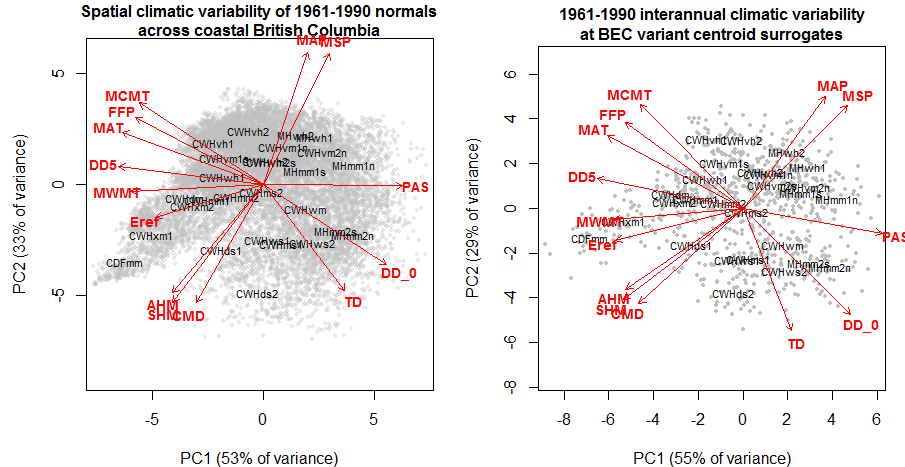
Figure 1: comparison of PCA rendering of spatial variability of climate normals at 1600-m grid points vs. interannual variability at BEC variant centroid surrogates. Data are for the characteristic BEC zones of coastal BC (CWH, CDF, MH).
The pattern of spatial climatic variation across the BC coast in is remarkably well preserved in the climate space of interannual variability at centroid surrogates (Figure 1). This indicates that interannual variability on the coast is of a lesser scale than the main spatial gradients in climate described by BEC variants. The pattern of spatial variability is marginally less conserved in south and central interior BC (Figure 2). Notably, TD (the total difference between mean coldest and warmest month temperatures) is a very minor element in the spatial climate space, but is the primary correlate of PC2 in the temporal climate space. This is consistent with my previous result that there is very large interannual variability of winter temperatures in the BC interior, but little spatial variability in normals of winter temperature. The prominence of winter variability in the temporal climate space is likely undesirable for most purposes because it overrides other dimensions of variability that are much more important for differentiating BEC variants. This effect is also evident at the provincial scale (Figure 3), though it is more subtle due to the importance of TD in differentiating the coast from the interior of BC. Discriminant analysis may help to address this problem, especially at the regional scale, because it prioritizes climate elements that differentiate BEC variant centroid surrogates.
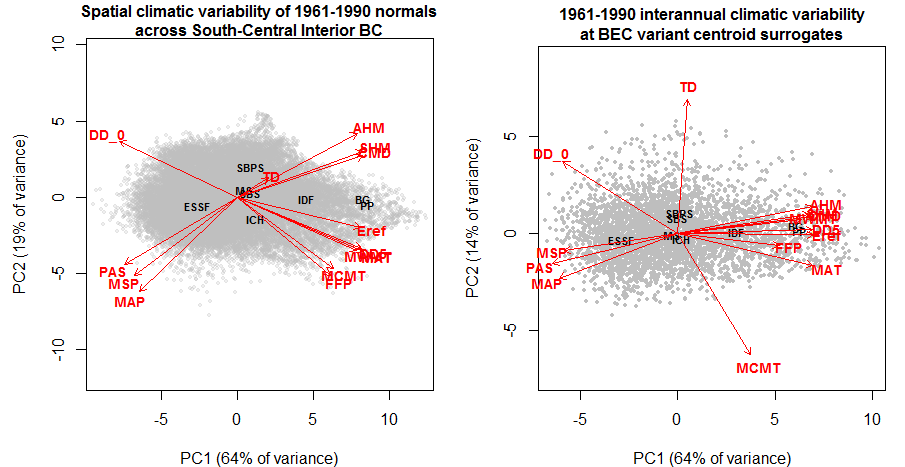
Figure 2: comparison of PCA rendering of spatial variability of climate normals at 1600-m grid points vs. interannual variability at BEC variant centroid surrogates. Data are for the characteristic BEC zones of South-central BC.
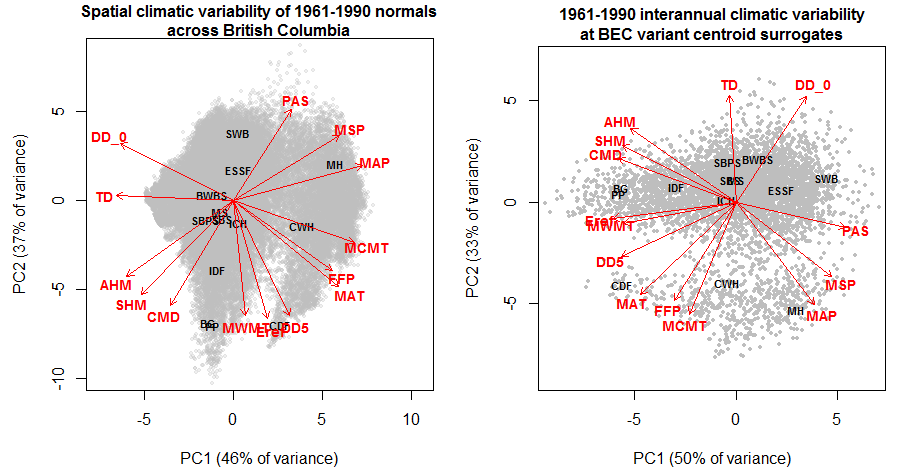
Figure 3: comparison of PCA rendering of spatial variability of climate normals at 1600-m grid points vs. interannual variability at centroid surrogates. Data are for the entire area of BC excluding alpine and subalpine parkland climates.
The graphs above demonstrate that, for the most part, the first two principal components are driven by spatial variation in average climatic conditions, even in the temporal data set. This is an inevitable result of the spatial variance at the regional and provincial levels being considerably greater than the temporal variance at individual points on the landscape. The next question is: if spatial variation is overriding temporal variation in the PCA, how well do principal components of the temporal data set represent the important dimensions of interannual variability at each centroid surrogate?
Figure 4 demonstrates that there is a decreasing trend in the interannual variability of principal components. However, the decrease is much more gradual for the overall variance of the data set. On average it takes 7 of the 14 PCs to explain 95% of the variance in the climate years at individual centroid surrogates. Notably, the first three principal components are all equally important to describing interannual variability (25%, 22%, and 22% respectively, on average). These results indicate that PCA does not create an efficient reduced climate space for representing local interannual climatic variability.
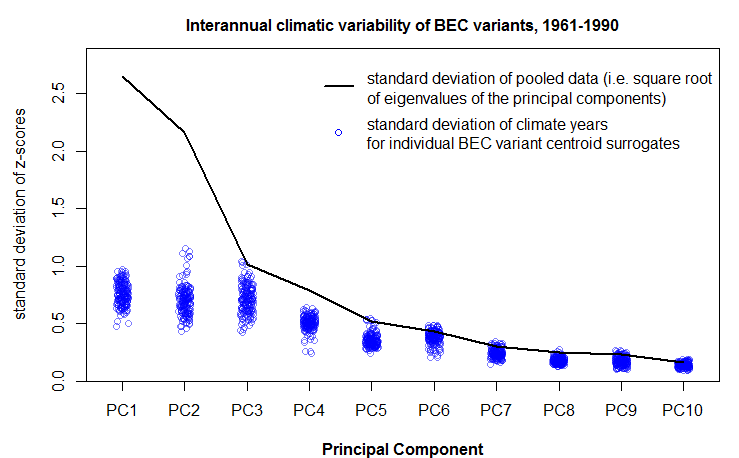
Figure 4: modified scree plot showing the total variability (in standard deviations) of each principal component, and the scale of interannual variability around each of the BEC variant centroid surrogates.
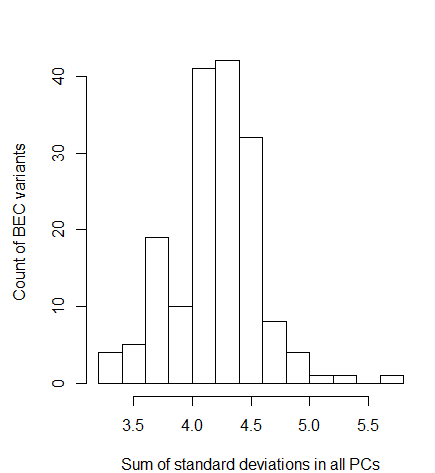
Despite the potential inefficiencies of PCA as a dimension reduction tool, the graph above illustrates how standard deviation of z-scores can be used as a measure of interannual variability at each BEC variant centroid surrogate. There is reasonable variation between BEC variants in terms of this measure of interannual climatic variability (Figure 5). This variation facilitates mapping of overall climatic variability. Since the values of the map are total standard deviation across all PCs, they are a quantity of the raw data and are independent of any rotation.
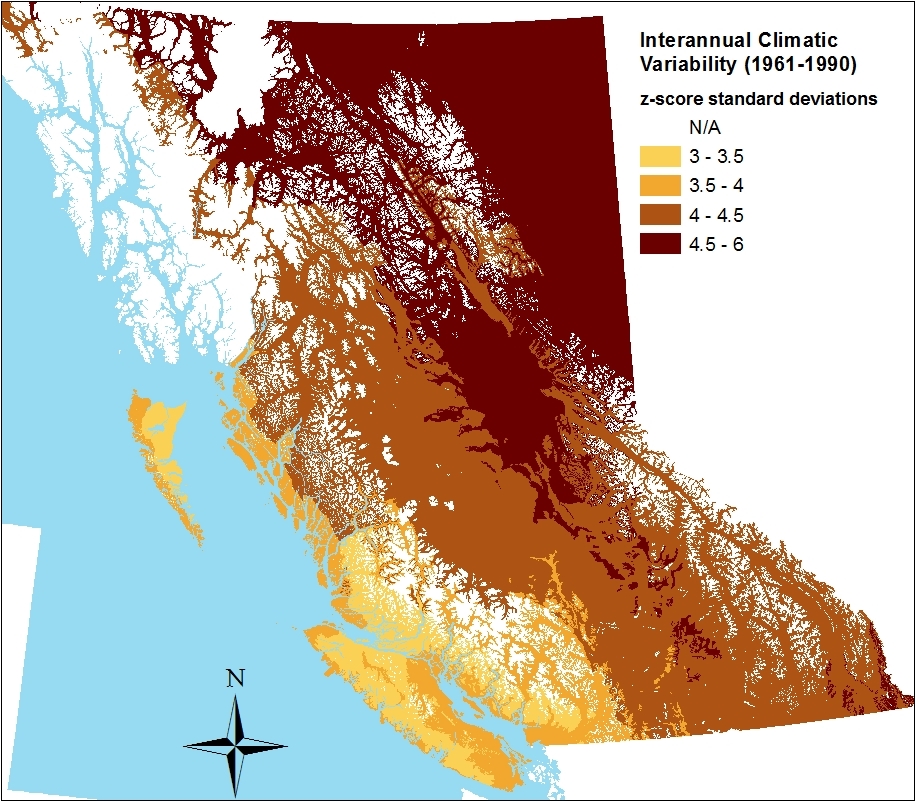
Figure 6: map of interannual climatic variability measured as the sum of standard deviations of z-scores in all principal components for each BEC variant centroid surrogate.
i wonder how does the variability map compare to a map of continentality?
It looks like places with large within year variability also have more variability among years. I guess that’s expected? Curious to see where that isn’t true – must be exceptions somewhere.
Hey Susannah, good observation. I think variability in winter temperatures (highly correlated with TD) are driving the pattern on the map. yet winter variability is less ecologically important than growing season variability. You’re right that finding the exceptions to the continentality pattern would be interesting. perhaps i could look at variability in individual PCs that are not related to winter temperatures, or use discriminant analysis to highlight climate variables that differentiate BEC units. Thanks for the suggestion!