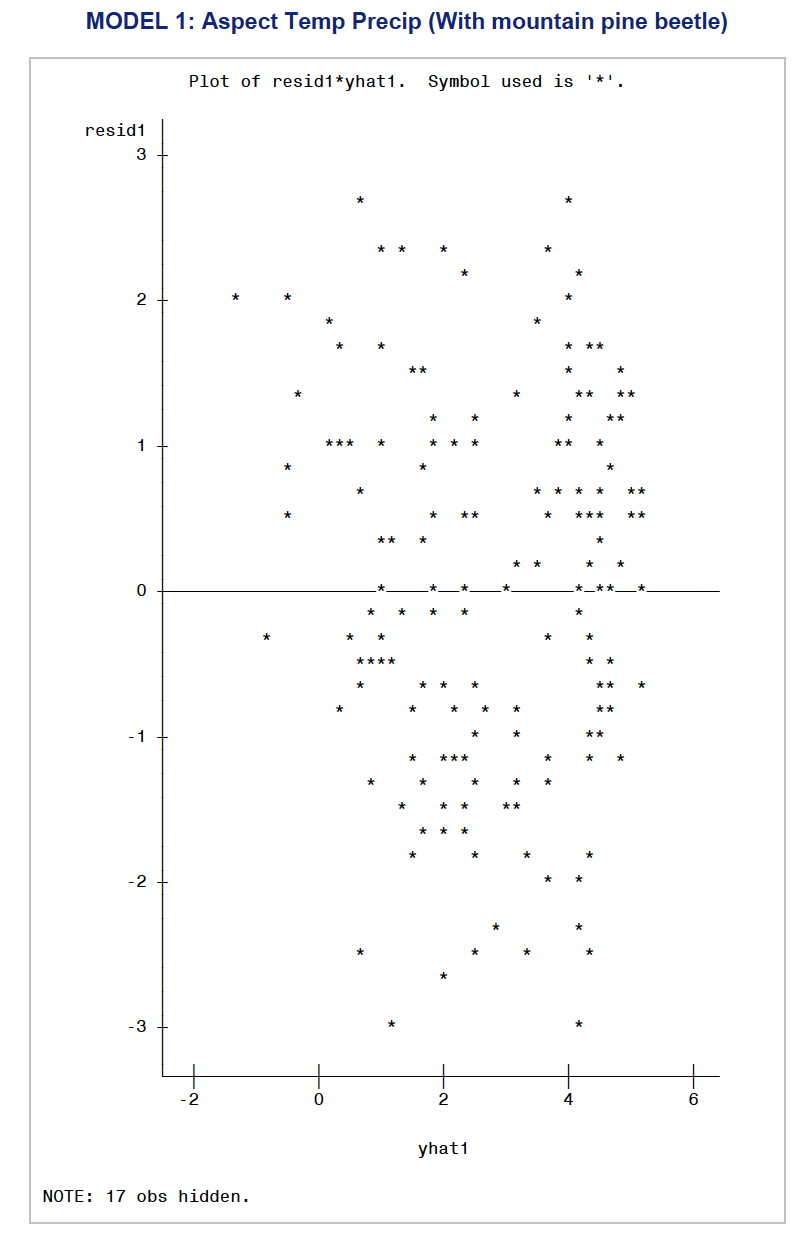
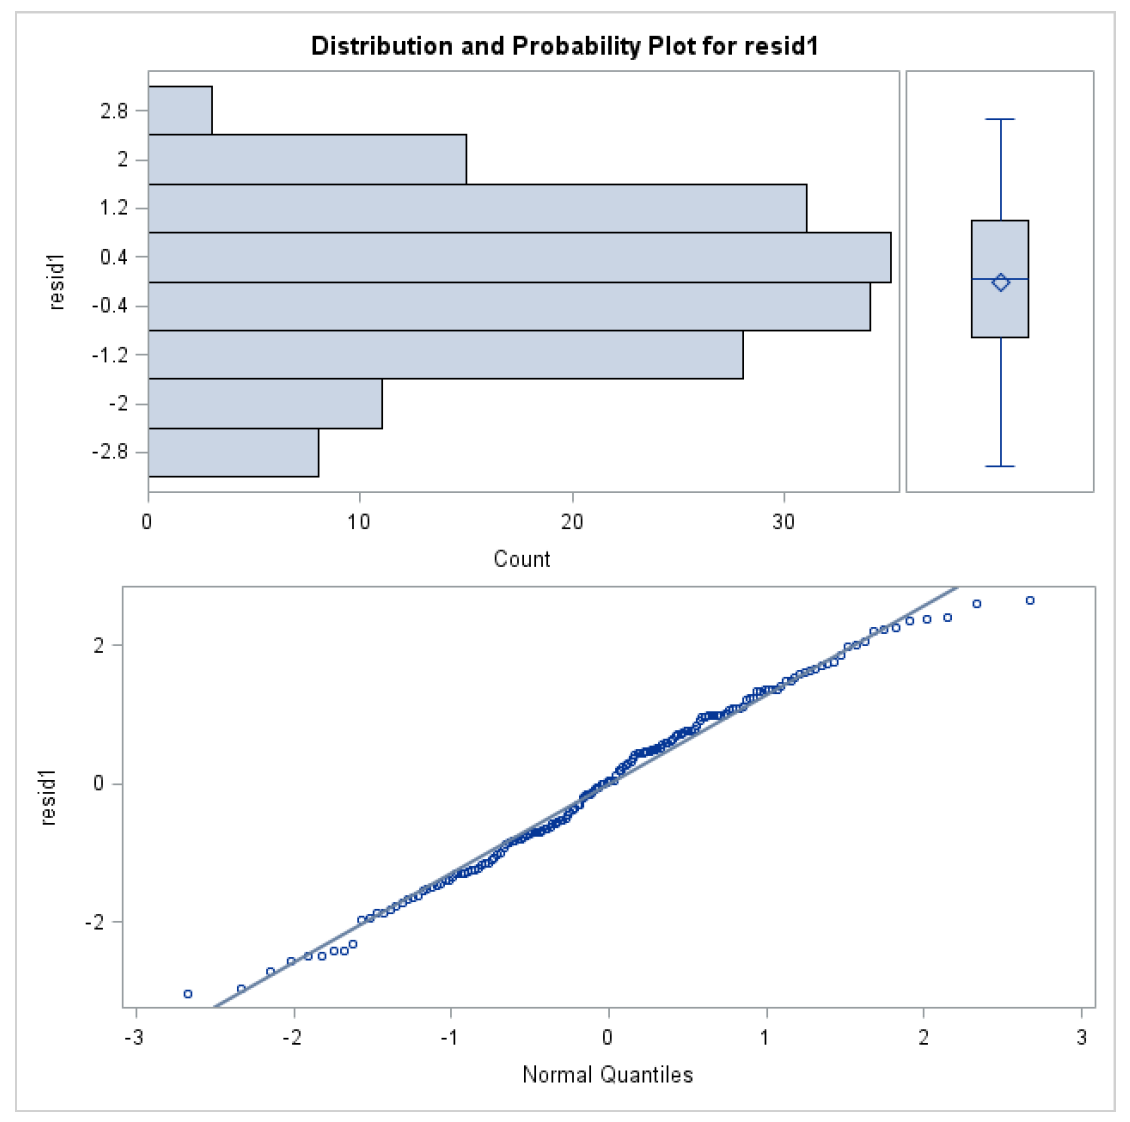
Model 1: Fire Spreading Potential with 3-year-prior Mountain Pine Beetle Infestation as a Predictive Variable
The GLM Procedure
Dependent Variable: SizeHA
| Source | DF | Sum of Squares | Mean Square | F Value | Pr > F |
| Model | 9 | 422.9978563 | 46.9997618 | 26.61 | <.0001 |
| Error | 155 | 273.7724656 | 1.7662740 | ||
| Corrected Total | 164 | 696.7703219 |
| R-Square | Coeff Var | Root MSE | SizeHA Mean |
| 0.607084 | 47.74389 | 1.329012 | 2.783628 |
| Source | DF | Type III SS | Mean Square | F Value | Pr > F |
| EASTING | 1 | 44.4672451 | 44.4672451 | 25.18 | <.0001 |
| sqrtEasting | 1 | 52.7388668 | 52.7388668 | 29.86 | <.0001 |
| SOUTHING | 1 | 105.6822587 | 105.6822587 | 59.83 | <.0001 |
| sqrtSouthing | 1 | 124.8646083 | 124.8646083 | 70.69 | <.0001 |
| IBM_2007 | 1 | 17.2721928 | 17.2721928 | 9.78 | 0.0021 |
| SLOPE | 1 | 19.3962967 | 19.3962967 | 10.98 | 0.0011 |
| PPT_sm | 1 | 8.9468396 | 8.9468396 | 5.07 | 0.0258 |
| Tave_sp | 1 | 9.9448637 | 9.9448637 | 5.63 | 0.0189 |
| Tmin_sp | 1 | 14.2468223 | 14.2468223 | 8.07 | 0.0051 |
| Parameter | Estimate | Standard Error | t Value | Pr > |t| |
| Intercept | -3.65134066 | 1.49000450 | -2.45 | 0.0154 |
| EASTING | -9.34766982 | 1.86299756 | -5.02 | <.0001 |
| sqrtEasting | 7.86375958 | 1.43910958 | 5.46 | <.0001 |
| SOUTHING | -13.25953401 | 1.71417933 | -7.74 | <.0001 |
| sqrtSouthing | 11.46772119 | 1.36391241 | 8.41 | <.0001 |
| IBM_2007 | 0.00842460 | 0.00269404 | 3.13 | 0.0021 |
| SLOPE | 0.04633359 | 0.01398188 | 3.31 | 0.0011 |
| PPT_sm | -0.00489876 | 0.00217661 | -2.25 | 0.0258 |
| Tave_sp | 0.49588887 | 0.20898445 | 2.37 | 0.0189 |
| Tmin_sp | -0.65333597 | 0.23004172 | -2.84 | 0.0051 |
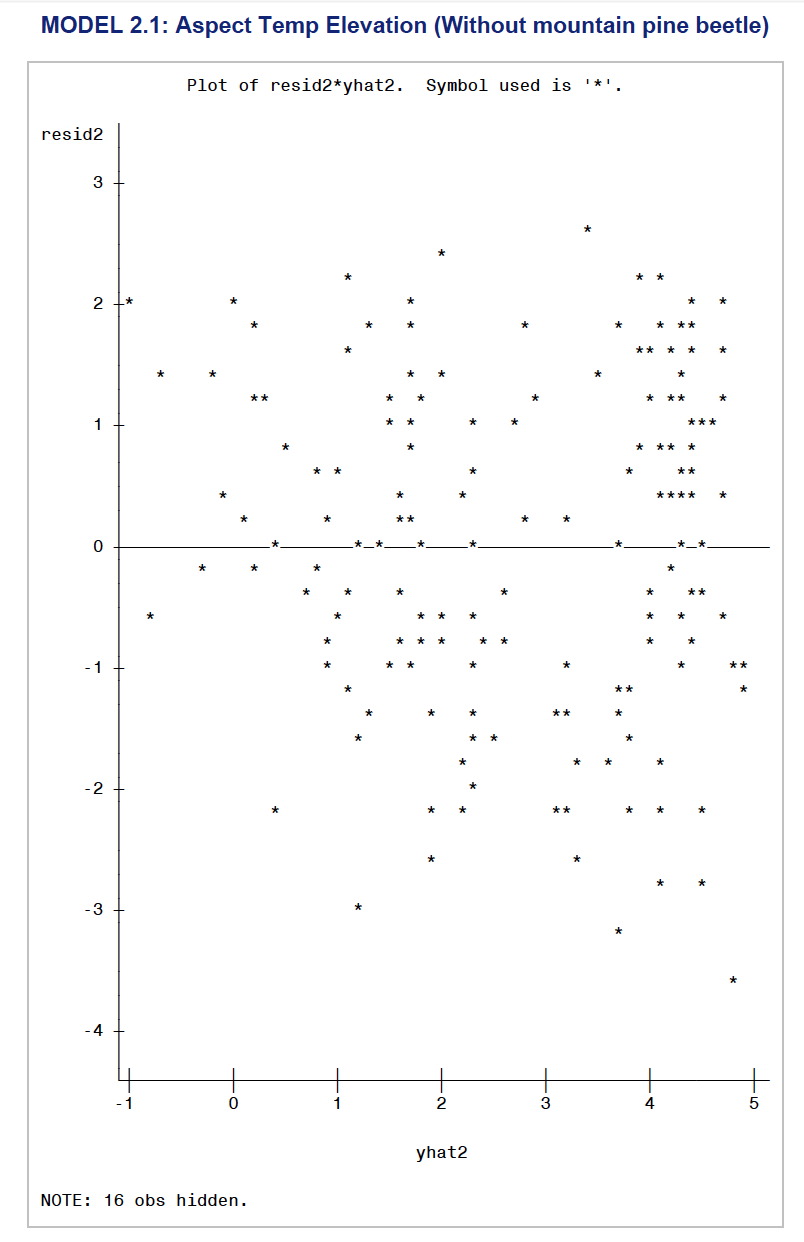
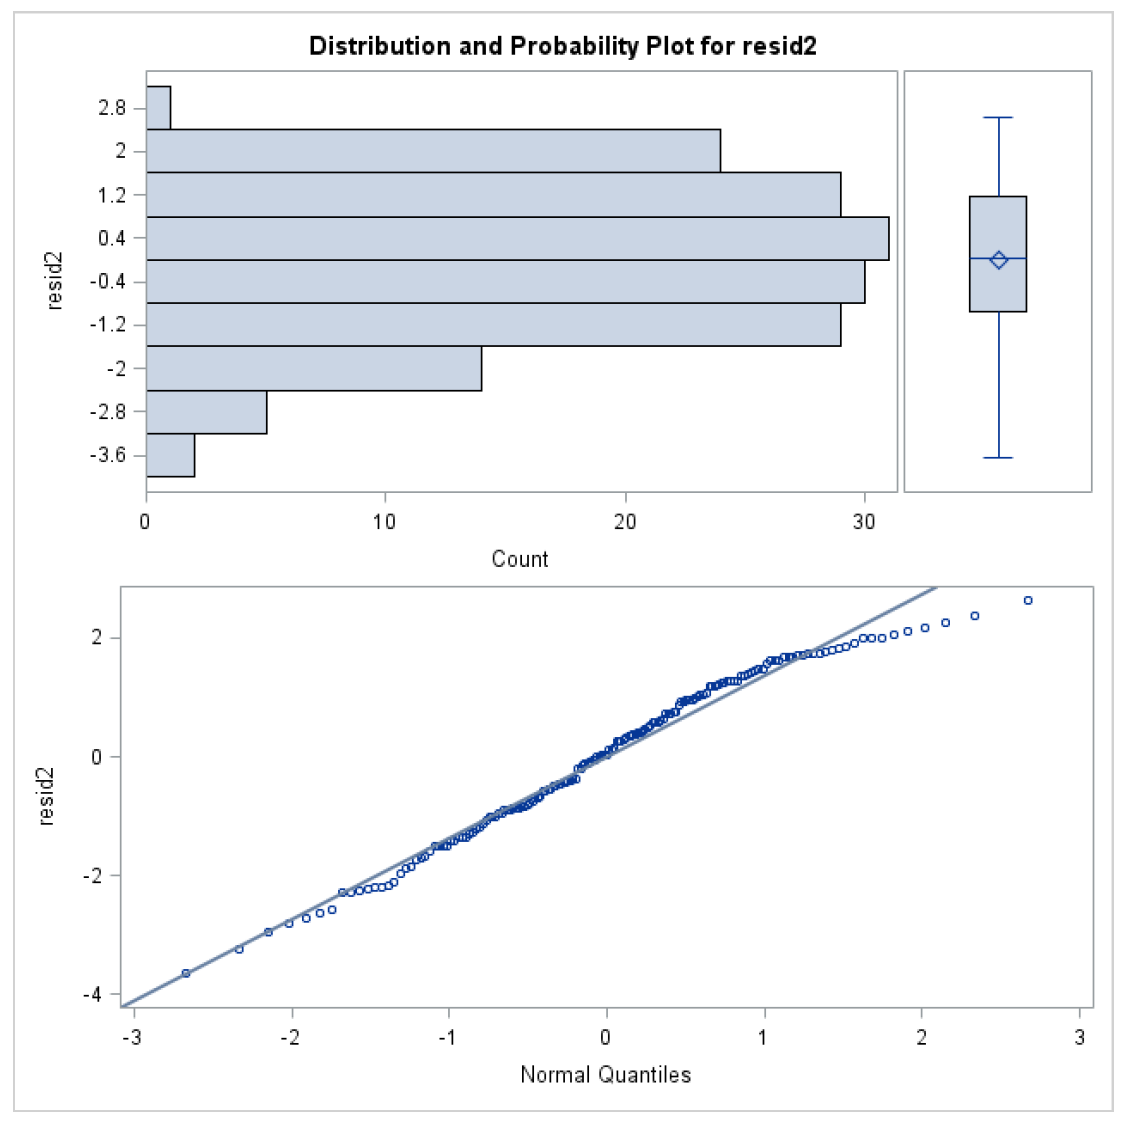
Model 2: Fire Spreading Potential without Mountain Pine Beetle Infestation as Predictive Variable
The GLM Procedure
Dependent Variable: SizeHA
| Source | DF | Sum of Squares | Mean Square | F Value | Pr > F |
| Model | 7 | 388.4324746 | 55.4903535 | 28.25 | <.0001 |
| Error | 157 | 308.3378473 | 1.9639353 | ||
| Corrected Total | 164 | 696.7703219 |
| R-Square | Coeff Var | Root MSE | SizeHA Mean |
| 0.557476 | 50.34453 | 1.401405 | 2.783628 |
| Source | DF | Type III SS | Mean Square | F Value | Pr > F |
| EASTING | 1 | 54.9456856 | 54.9456856 | 27.98 | <.0001 |
| sqrtEasting | 1 | 66.2640091 | 66.2640091 | 33.74 | <.0001 |
| SOUTHING | 1 | 107.9368153 | 107.9368153 | 54.96 | <.0001 |
| sqrtSouthing | 1 | 127.6374948 | 127.6374948 | 64.99 | <.0001 |
| SLOPE | 1 | 18.1921823 | 18.1921823 | 9.26 | 0.0027 |
| Tave_sp | 1 | 12.1845318 | 12.1845318 | 6.20 | 0.0138 |
| Tmin_sp | 1 | 12.6640162 | 12.6640162 | 6.45 | 0.0121 |
| Parameter | Estimate | Standard Error | t Value | Pr > |t| |
| Intercept | -3.92951509 | 1.55293406 | -2.53 | 0.0124 |
| EASTING | -10.31452654 | 1.95005155 | -5.29 | <.0001 |
| sqrtEasting | 8.73133750 | 1.50316105 | 5.81 | <.0001 |
| SOUTHING | -13.39768504 | 1.80720973 | -7.41 | <.0001 |
| sqrtSouthing | 11.58550996 | 1.43710868 | 8.06 | <.0001 |
| SLOPE | 0.04378938 | 0.01438765 | 3.04 | 0.0027 |
| Tave_sp | 0.54572363 | 0.21909473 | 2.49 | 0.0138 |
| Tmin_sp | -0.61157995 | 0.24084138 | -2.54 | 0.0121 |