Monthly Archives: April 2018

Review: “Spatial and temporal aspects of alcohol-related crime in a college town”

Brower, A. M., & Carroll, L. (2007). Spatial and temporal aspects of alcohol-related crime in a college town. Journal of American College Health, 55(5), 267-75.

This paper addressing the relationship between drinking and student crime in Madison (Wisconsin), making two major arguments:

  1. More serious crimes occur at the intersection between high density student areas and high density drinking outlets.
  2. Non-student residents living near students submit noise complaints at around midnight when they are going to sleep and student parties are still continuing.

Methodology:

The methodology was very basic – effectively mapping reported crimes by time onto a basemap in ArcGIS.

Results:

  1.  There was a peak in serious crimes  when bars closed downtown, which was identified as a high density cluster for drinking and crime incidents.
  2. Noise complaints, as expected, were highest between 9pm and midnight. 

Although the paper lead to genuine zero-tolerance policies by the University and the city, the authors underestimated the statistical potential of GIS, as they presented it as a merely descriptive tool. As such we assigned the paper a mark of 5/10.

Class 8: Use of GIS in Fire Departments

The Calgary Fire Department (CFD) actively use GIS analysis for the following:

  • Risk Analysis
  • Response Mapping
  • Decision Making
  • Spatial Planning
  • Apparatus Deployment
  • Station Relocation

To collect the risk data the team use basic on-paper mapping techniques to classify areas by risk as a function of concentration and distribution. Another form of analysis they use is the identification of proximity loss where incidents are a function of structures in close proximity to one another. This analysis lead to the identification of roads that are too narrow for fire trucks and where the buildings have a high fire risk due to proximity.

By mapping out the locations of oil and gas stations and hydrants, the team have a better understanding of where to situate apparatus and fire stations. Furthermore it is possible to apply a temporal element by analysing the distribution of historical fire incidents. Call and drive fire and medical response times were also mapped out across the city. Fire location analysis can be used alongside potential explanatory variables like population growth and annex lands, and number of firefighters likely to arrive on scene.

These analyses together can help in the proposal of new fire station locations to ensure service provisions to communities based on need from growth and the results of the gap analysis. Indeed, this was implemented to created a new station in northwest Calgary that fulfilled a number of locational requirements.

Review: Spatial Access to Health Care in Costa Rica (Kevin Hu)

Rosero-Bixby, L. (2004). Spatial access to health care in Costa Rica and its equity: a GIS-based study. Social Science & Medicine58(7), 1271-1284.

Kevin presented a paper that used GIS analysis to investigate differential access to health care in Costa Rice. The data consisted of census data and health care provision data, with missing data acquired through the use of telephone interviews. The author also conducted random field visits to hospitals and did some groundtruthing for the GPS coordinates.

The author built a model to simulate distance to the nearest healthcare facility, mapping proximity to outpatient facilities. The smallest distances were clustered around San Jose but were otherwise very sparsely distributed. The model also accounted for visitor’s satisfaction and the choices they make when selecting between healthcare facilities.

The results indicated that 12-14% of the population of Costa Rica were underserved. On a temporal scale, inequity declined by up to 30% as a result of reforms in 1995 and 1996, although this number has been steadily increasing in recent years.

Overall, Kevin gave this paper a 9/10 because the models were well designed and the data was carefully validated. However, some decisions (i.e. cut-off values in the models) appeared to be selected arbitrarily.

Review : “Using geographically weighted regression for environmental justice analysis: Cumulative cancer risks from air toxics in Florida”

Gilbert, A., & Chakraborty, J. (2011). Using geographically weighted regression for environmental justice analysis: Cumulative cancer risks from air toxics in Florida. Social Science Research, 40(1), 273-286.

This paper draws on previous literature about inequality in health geography to investigate the risk of cancer risk  from ambient exposure to air pollutants between different socioeconomic groups across Florida, focusing on the following 2 research questions:

  1. Are cumulative lifetime cancer risks from ambient exposure to multiple sources of hazardous air pollutants distributed inequitably with respect to race/ethnicity and socioeconomic status across Florida?
  2. How does the direction and significance of statistical relationships between cumulative lifetime cancer risk and race/ethnicity or socioeconomic status vary across the state of Florida?

Methodology:

Using modelled cumulative air cancer risk and socio-economic factors such as racial structure of communities, the authors conducted two forms of regression analysis. Ordinary Least Squares was used to acquire a global fit and Geographically Weighted Regression was used to determine whether the difference in the fit between the explanatory variables and the overall cancer risk changed differed across the state.

Results:

  1. There is a positive and significant relationship between the proportion of Black, Hispanic and Asian residents and overall cancer risk and a negative and significant relationship between population density and number of people below the poverty line and overall cancer risk.

2.  In comparison to the OLS model, the GWR model fit the data disproportionately across the           map, with hotspots in urban centres like Miami. 

This paper makes a convincing case for GWR and the authors use GIS software to produce clear and legible maps, but more care could have gone into the selection of model data. The authors elaborate on the theoretical element of GWR but this soon becomes repetitive. As such, this paper has been given a rating of 7/10.

Lab 4: CrimeStats

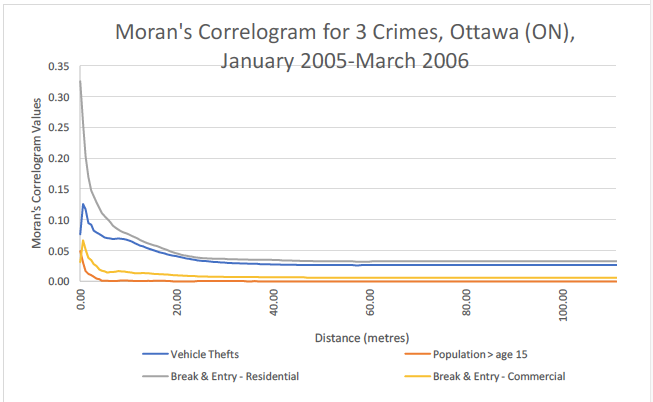
In this lab, the Crimestats analysis software was used to analyse the spatial and temporal distribution of a number of crimes between January 2005 – March 2006 in Ottawa (ON): vehicle theft, breaking and entry (residential), breaking and entry (commercial). A Moran’s Correlograms (below) shows that the spatial autocorrelation of breaking and entry (residential) incidents is highest of the crimes, followed by Vehicle thefts and break and entry (commercial) incidents. Additionally, these all appear to share spatial autocorrelation with the population variable.

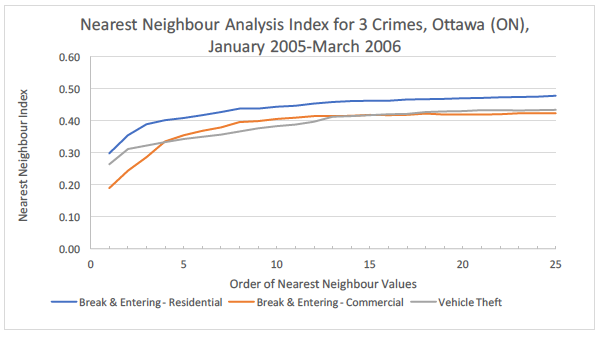
The Nearest Neighbour Analysis Index (below) indicate that the crime with the highest level of spatial clustering is breaking and entering (commercial), while the lowest is breaking and entering (residential). This is unsurprising considering the presence of commercial hubs in urban areas.

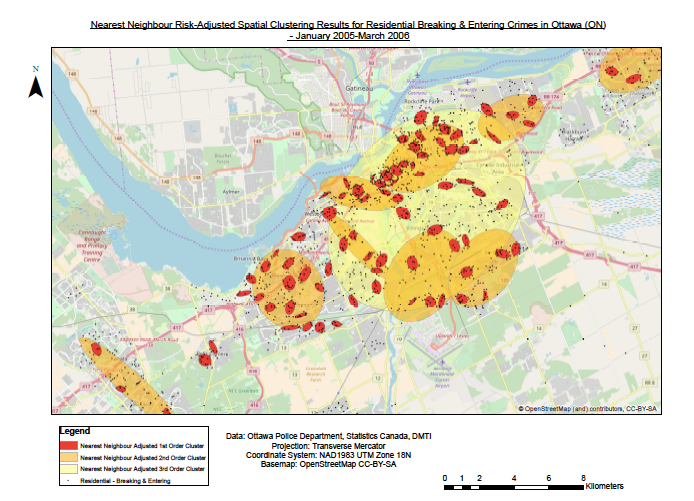
1st, 2nd and 3rd order nearest neighbour risk-adjusted spatial clustering results (below) represent ‘clusters’ within ‘clusters’ of crimes and accounts for population distribution. Thus, the map indicates areas at particular risk of residential breaking and entry crimes, given the population. The areas at risk are in the central downtown area and in other distinct pockets in suburbs and satellite towns.

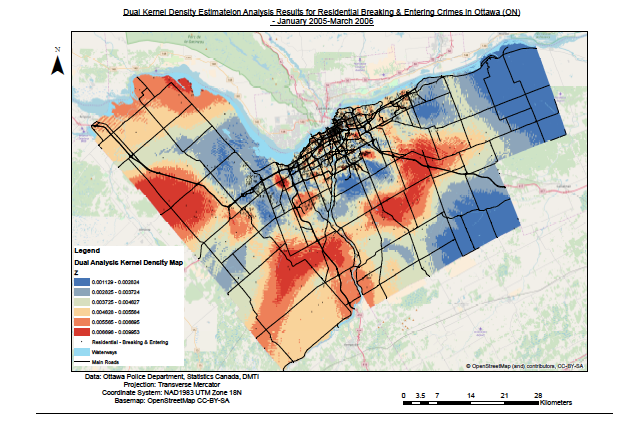
While we also produced single dual kernel density analysis maps, I found the dual kernel density map to be the most useful as it shows the relative density of breaking and entering (residential) crimes in Ottawa while accounting for population density. The map indicates higher risk in localised pockets downtown in and particular suburbs away from the city centre, with low z-scores likely representing more sparsely populated parts of Ottawa.