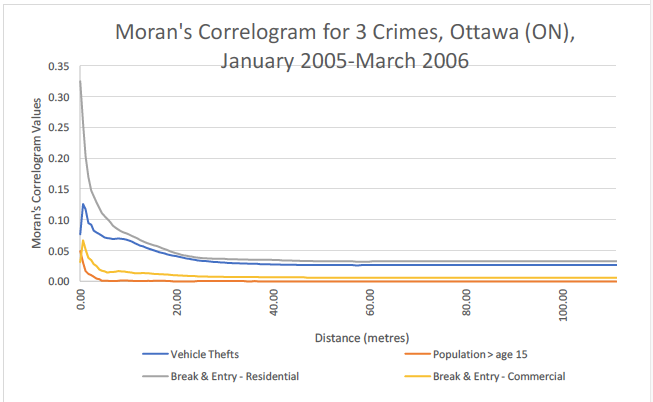
In this lab, the Crimestats analysis software was used to analyse the spatial and temporal distribution of a number of crimes between January 2005 – March 2006 in Ottawa (ON): vehicle theft, breaking and entry (residential), breaking and entry (commercial). A Moran’s Correlograms (below) shows that the spatial autocorrelation of breaking and entry (residential) incidents is highest of the crimes, followed by Vehicle thefts and break and entry (commercial) incidents. Additionally, these all appear to share spatial autocorrelation with the population variable.
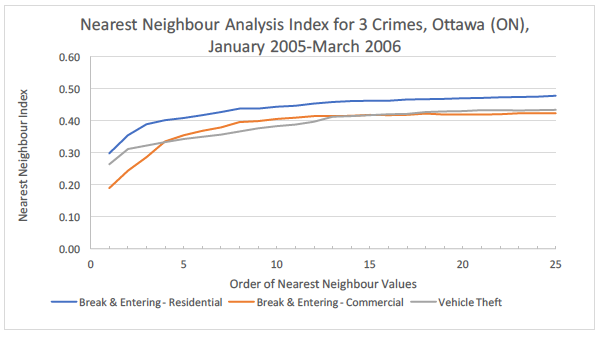
The Nearest Neighbour Analysis Index (below) indicate that the crime with the highest level of spatial clustering is breaking and entering (commercial), while the lowest is breaking and entering (residential). This is unsurprising considering the presence of commercial hubs in urban areas.
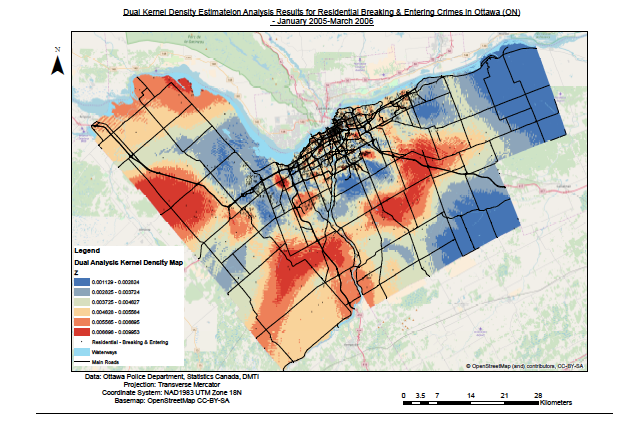
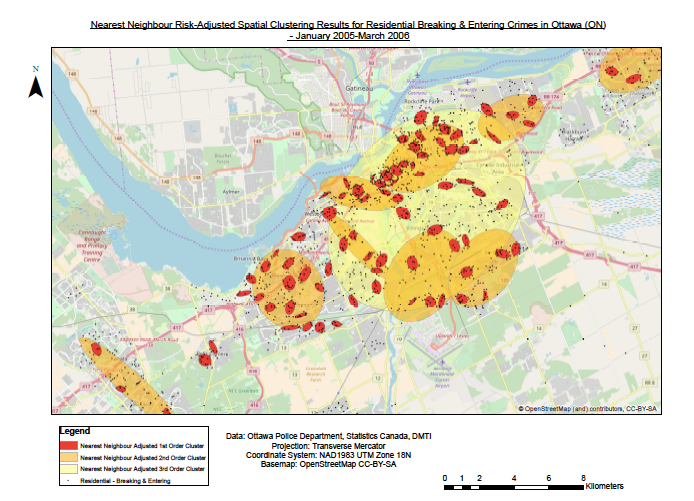
1st, 2nd and 3rd order nearest neighbour risk-adjusted spatial clustering results (below) represent ‘clusters’ within ‘clusters’ of crimes and accounts for population distribution. Thus, the map indicates areas at particular risk of residential breaking and entry crimes, given the population. The areas at risk are in the central downtown area and in other distinct pockets in suburbs and satellite towns.
While we also produced single dual kernel density analysis maps, I found the dual kernel density map to be the most useful as it shows the relative density of breaking and entering (residential) crimes in Ottawa while accounting for population density. The map indicates higher risk in localised pockets downtown in and particular suburbs away from the city centre, with low z-scores likely representing more sparsely populated parts of Ottawa.