The spatial nature of some datasets (for example, Census data) allows us to investigate the extent to which these associates vary in strength and direction across space. The aim of this lab was to model child social skills against a model Geographically Weighted Regression (GWR) model composed of a set of statistically selected independent variables related to the child and to their neighbourhood. Geographically Weighted Regression (GWR) is a spatially resolved statistical form of regression that allows the value of the dependent variable to vary between locations based on the assumption that so too do the values of the independent variables, as the relationship between phenomena are not fixed across space.
Gender as a predictor of social skills in children
Gender appears to have a notably varied effect on children’s social skills across the cities. In the West End and Mount Pleasant, being a female predicts lower social skills, in comparison to areas of South Vancouver and Hastings where it appears to have a positive impact. The relationship between language skills and social skills is positive across the city, though notably less pronounced in parts of South Vancouver (i.e. South Granville, Shaughnessy and Cambie) where the standard deviation reaches a low of 0.31. Finally, the relationship between parent’s income and social skills is lowest in areas of East Vancouver (i.e. Main and Victoria) with a standard deviation of -1.8, higher in Renfrew (standard deviation of 2.5), though the map indicates a relatively weak relationship between the two variables in comparison to the gender and language skills. The r2 values from the model output were plotted as point data and overlaid onto the raster coefficient maps – the highest fit of the models to the data are clustered in central East Vancouver and lowest in areas such as UBC and South Vancouver.

Grouping Analysis:
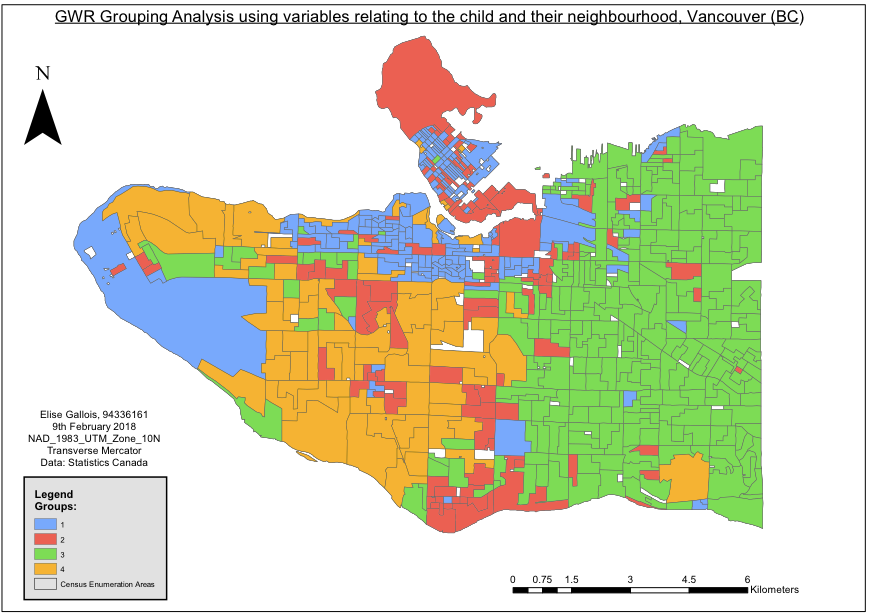
The ArcGIS grouping tool was used to categorise neighbourhoods of the city with shared characteristics as determined by GWR. This provides a more nuanced view of differences in childhoods across the city than simply ‘east vs west’. This analysis generated the following groups, which were choropleth mapped :

The legend categories 1-4 are detailed below:
- UBC, Mount Pleasant, West End, Marpole
This area has the lowest % of families that spend 30 or more hours on childcare per week, the lowest number of families >4 and the lowest number of neighbourhood immigrants.
- Stanley Park area, Strathcona
This area has the highest number of neighbourhood immigrants.
- East Vancouver
This area the highest number of low parent families, the highest % if families that spend 30 or more hours on childcare and the lowest average income.
- Kitsilano, Dunbar
This area has the highest income, the highest number of families >4, and the lowest number of lone parent households.
