
This page summarizes what students are learning and experiencing in EOAS QES courses. Four sections are:
- Syllabi & goals for current QES courses
- QES course content
- Students’ QES learning tasks
- Computing in EOAS
1. Syllabi & goals for current QES courses
Characteristics of syllabi and learning goals from 27 QES courses were obtained using a survey to EOAS instructors. Many of these syllabi are actually not too bad. However, there are straight forward steps that would improve their effectiveness at improving both clarity of aims and effectiveness of learning in each course. See the courses-level recommendations page for details.
Results of characterizing syllabi and learning goals are in a 5-page report (including figures) which has the following outline:
- Background: discusses why a complete and consistent syllabus is needed for every course.
- An ideal syllabus includes: lists 8 aspects that should be provided by a syllabus
- Contents of UBC’s recommended syllabus: The 17 recommended items are listed and the 12 that are required by Policy V-130 are emphasized.
- A Sampling of EOAS Syllabi: the request for data is described
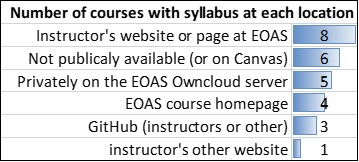
- Where are syllabi provided? The goal here is to see how “publicly visible” the syllabi are for these courses (a syllabus should ideally be a public document). Figure here summarizes the visibility of syllabi reviewed.
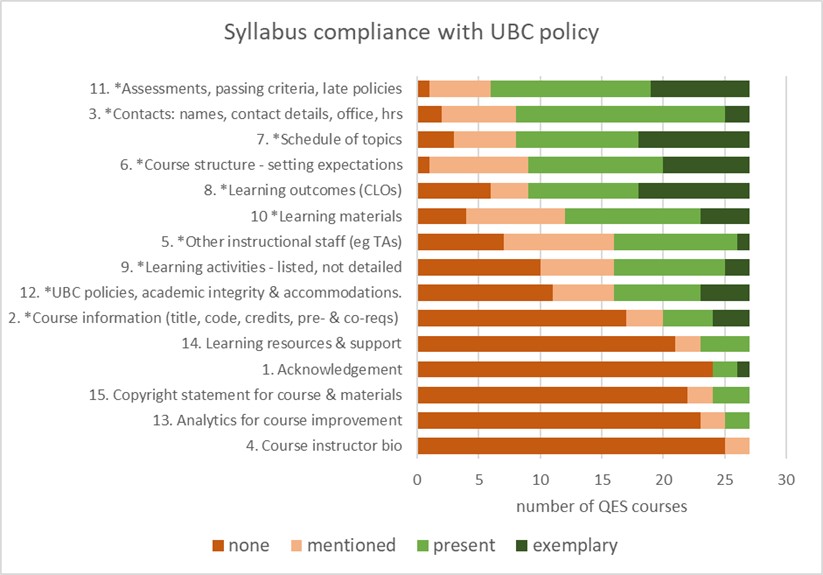
- Completeness: to what extent are items that are recommended or required by the UBC template present in the syllabi provided? Figure here summarizes the extent to which UBC’s required or recommended criteria are being met across the syllabi reviewed. *Stared items are required by Policy V-130.
- Where are syllabi provided? The goal here is to see how “publicly visible” the syllabi are for these courses (a syllabus should ideally be a public document). Figure here summarizes the visibility of syllabi reviewed.
- Course Learning Outcomes (CLOs): Updating learning goals is both important and challenging. Goals provided in the 27 syllabi were assessed to be either “exemplary”, “present”, “mentioned” or “none”. These goals turned out to be not too bad, however, there is certainly room for improvement, and for striving for consistency.
- A possible framework for CLOs: There are advantages to asking for some sort of “standards” when writing learning outcomes for a course. This section of the report suggests a framework for characterize CLOs in terms of 4 types of characteristics.
2. QES course content
Results of asking faculty at the 2019 Dep’t retreat to “list quantitative skills & learning students are exposed to (or you would like to see them use)” are tabulated here. The question was open ended, yielding 25 “types” of quantitative skills spanning six EOAS specializations. That listing is likely incomplete since some skill types that seem “obvious” are missing from some specializations. For example, no skills related to data visualization were included in the geophysics column, yet geophysical data of all types needs visualizing as part of analysis, interpretation and modeling.
During the 2020/21 teaching season, instructors of 28 QES courses provided information about quantitative concepts learned, and contexts used for that learning. The report based on these data includes the following sections:
- Data gathered: received for 25 courses, estimated for 3 more, and not received from 4. Concepts and contexts were established based on the forms. For each course, each concept was interpreted to have been taught at one of four levels: none; touched upon; intro/light use; application.
- Data quality: Two questions were asked, but no guidelines were provided, so information returned ranged from cursory to detailed.
- Also, the number of times that each concept was either touched upon, used at introductory levels or used in applications varies by course year level roughly as expected; i.e. students get more introductory exposure in 2nd and 3rd year courses and engage in more applications in 4th year courses.
- A matrix approach to summarizing results was used, inspired by Macdonald and Bailey, 2000, and presented as a workshop by Rhodes in 2019. The most effective approach to matrix-based curriculum mapping is to map existing, well-articulated learning goals as “considered”, “emphasized”, or “strongly emphasized”. However in our case the use of learning goals was inconsistent so we mapped topics or techniques instead of learning goals, in terms of whether the subject was “touched upon”, “introduced or used lightly”, or “applied”. The result is shown here.

Courses with high Totals in the final column evidently expect students to engage with a wide range of quantitative concept and capabilities. For example course “EOSC 4ee” appears to have high expectations for students’ quantitative abilities. Skills or topics with a low value for their totals (bottom row) are evidently not encountered by students very often. For example the “R” programming language is encountered in only 2 courses.
- Summary of interpreted results: Fig. 2 summarizes the number of courses using each of 25 concepts. The report presents some observations, conclusions and recommendations. The number of topics addressed in each course is also discussed.
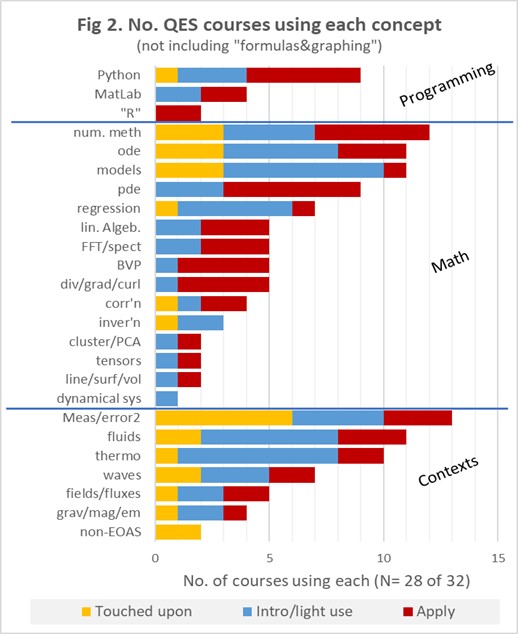
Also, the number of courses using each of 7 quantitative “tools” is discussed briefly (Fig. 4).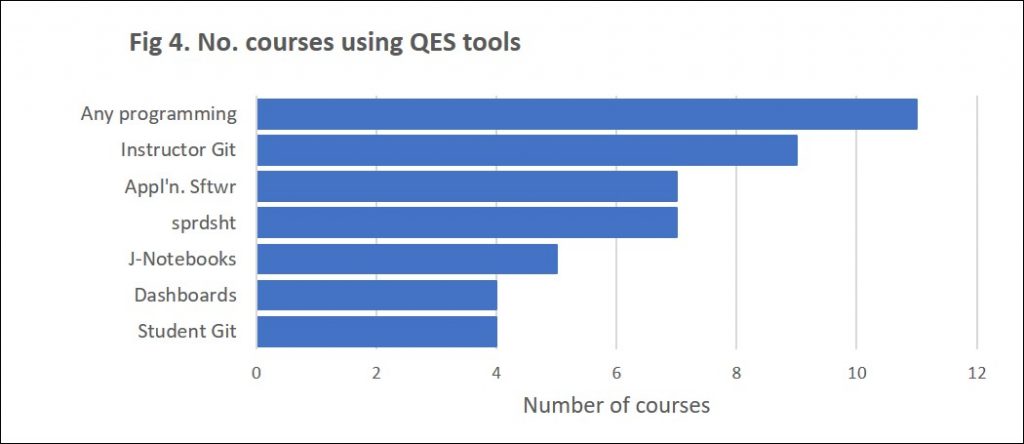
- Recommended next steps: These data might best be used as a starting point for discussions about what could be taught, what “should” be taught bearing in mind the likely needs of graduating students. See the Desirable Skills section for discussion on what could be taught.
- Data tables: this appendix lists courses, instructors and QES concepts that emerged from analysis.
In addition to survey data above, EOAS faculty discussed quantitative content at the 2019 departmental retreat. Results are incomplete as they were not been vetted by all EOAS faculty. A summary by degree specialization is in the PDF table here, and listed here (perhaps more informatively) highlighting types of QES skills compared across degree specializations. Thirty two specific quantitative skills are listed, some more generic than others. For example “calculus” is quoted as developed in 5 courses, whereas vector calculus, ODEs, PDEs, numerical analysis and others are also listed. Adjustments should be made for changes made since 2019, especially in terms of programming skills which are now focused around Python rather than MatLab and “R”.
3. Students’ QES learning tasks
To learn about what students do to learn, and resources they are provided with a brief survey was generated, reviewed by educational expert (K. Rawes, UBC’s Career Servicies), and deployed using UBC’s Qualtrics survey tool. Two out of the five questions were inspired by the Teaching Practices Inventory (Wieman & Gilbert, 2014)). The survey questions themselves can be seen here.
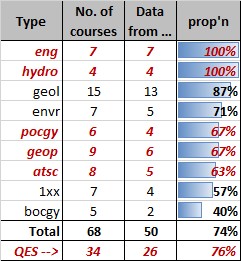
All instructors were asked to complete the survey, and results were obtained from 50 out of 68 EOSC, ATSC and ENVR courses. The following table summarizes courses for which we obtained data compared to the number of courses of each type in EOAS. At least two thirds of courses for each discipline (type) were involved, except biological oceanography and the first year “general science” courses.
Results: A separate page (PDF) summarizes results of this survey, characterizing the learning tactics that are experienced in courses for which data were obtained.
4. Computing in EOAS
Use of computing or computing resources in EOAS courses was determined by asking faculty to complete data for each course using a Google Sheet. Results are summarized as follows:
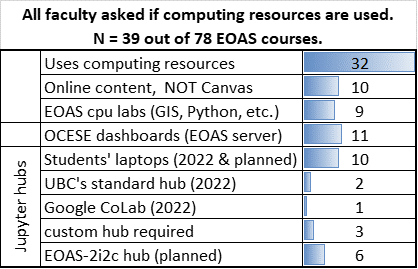
Only 3 who are not already using computing indicated that they plan or hope to. This implies that demonstrations of successful examples are needed with details about costs to design, build, maintain and employ in courses.
Whether students are writing code can be seen from the QES course content data above. As of Fall 2022, fifteen courses claim to have students using Python (9), MatLab (4) or R (2).