
Day two
Coffee.. needed. A long day planned ahead starting at 915am until 4 pm, plus I wanted to be a good athlete so I got up at 530 am to go to the gym (mixed feelings about that decision now that I am sitting here half asleep waiting for my caffeine to kick in!). Last night we had some required readings and some homework, very simple but pretty interesting if you are into that sort of thing (which I will explain later).
Lecture 1 Ageing – presented by a very lovely, very comical Siri Tellier.
A lot of focus was placed on comparing the past to the now or to the future (projections) and looking at how far we have come and how far we could possibly go with the right initiatives and actions.
Global megatrends (1950-2010)
- Fertility dropped from 5 à5
- Life expectancy increased from 47 à 71
- Most future population growth in urban centres of LDR
- World population from 2.5 billion à4 billion – future depending on fertility rates
- Sex ration: 10-20 countries (approx.) have skewed sex ratios
Outline:
- What is ageing?
- Demography
- Health
- Policy, practical approaches
Ageing:
- Demographic ageing: increasing proportion of older people
- Individual ageing: a progressive, generalized impairment of function, resulting in a loss of adaptive response to a stress and in growing risk of age-associated disease
Demography:
Health:
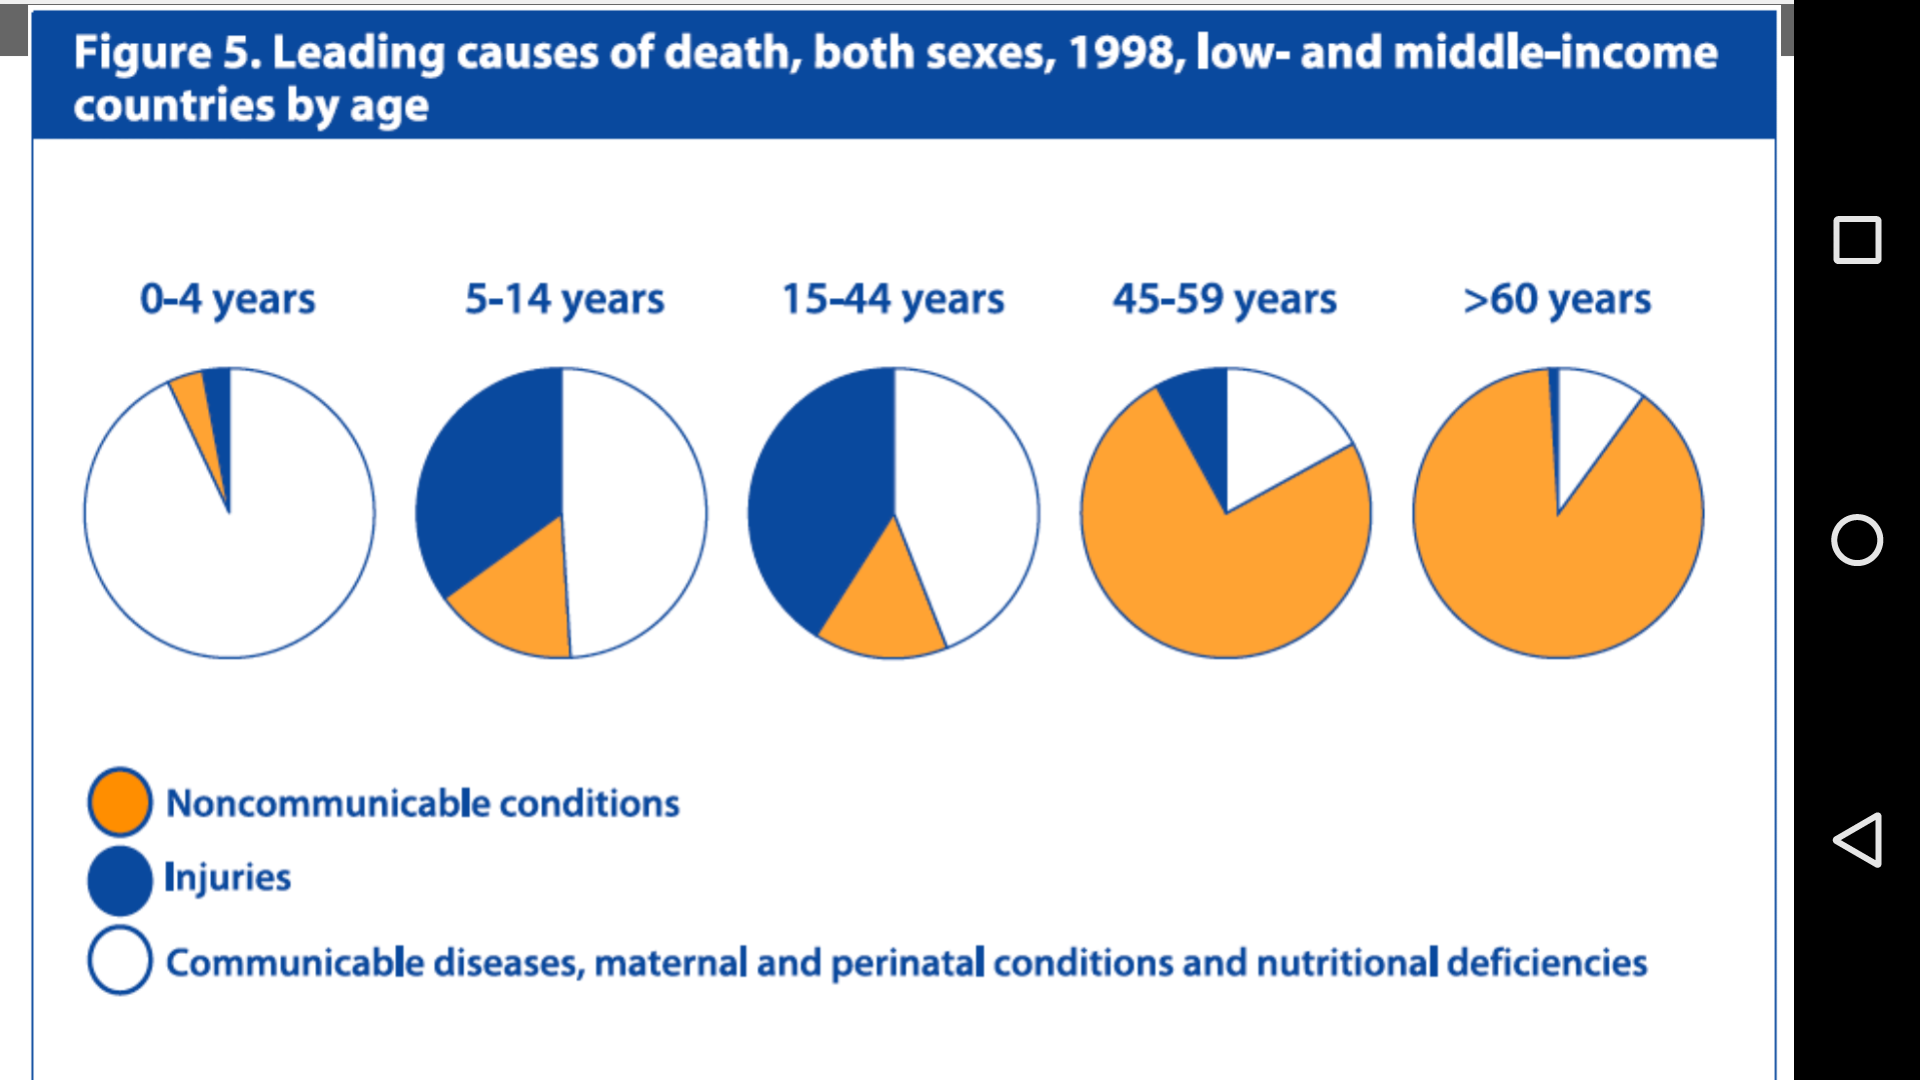
- Figure: leading causes of death, both sexes, 1998, low- and middle-income countries by age
- Looking at this figure, you can see how with age the shift goes from communicable diseases to injuries to NCDs being the main causes of death.
Policy, Practical approaches
- The three pillars of active ageing
- This figure has 3 pillars all connected to the determinants of active ageing according to the United Nations principles for older people. The tree pillars include:
- Participation
- Increasing work opportunities, productivity and competitiveness
- Health
- Security
- Ensuring sustainable public finances to help guarantee scial protection in the long-term
- Participation
- This figure has 3 pillars all connected to the determinants of active ageing according to the United Nations principles for older people. The tree pillars include:
It was brought up that in many countries, in the early stages of old age, the elderly usually contribute more hours of care and into care of others than they receive themselves. This is a major problem in many countries due to many reasons. Disease, injury, warfare and many other catastrophes have taken the lives of many parents leaving orphans. These children potentially get taken in by elder(s) or older siblings in their area. It is very common to see one elder or older adult taking care of up to 20 orphans in a small area and not receiving any care or help for themselves.
Coffee break – did you know.. if you want a coffee (comparable to a tall at Starbucks but tastes so much better….) in Copenhagen.. it costs 30 DKK or.. $6. Omg.. seriously I haven paid 6$ everyday for a coffee almost now because they are just so good and so needed when you are sitting in lecture for 6 -8 hours everyday! I have gone to every café I could find, trying new ones all the time and they all come out to the same.. you could order a latte, Americano, cappuccino, whatever you want.. and they are all the same price! I think if anything, all my money I have for this trip is being spent on coffee (my mom is going to read this and message me about it, i guarentee it) and the worst part yet.. I haven’t even gone shopping yet.
Public Health Demography – Siri Tellier
To start this lecture we all got into groups. The groups were given the night before according to the country you were assigned. The countries included: Japan, Iran, Brazil, Syria, Uganda and Denmark. We were asked to find the following numbers for 1950, 2005/10 and 2050 according to the UN for our assigned country.
- Population total
- Births
- Deaths
- Crude Birth Rate/1000
- Crude Death Rate/1000
- Total Fertility Rate
- Life expectancy
- <5 Mortality Rate/1000 total (male/female)
- % 0-4
- % Women aged 15-49/total women
- % 60 +
In our groups we were to discuss what we saw in terms of trends, changes between the years, good or bad? And what stood out the most to us.
My country that I was given was Brazil. My table looked like this once all the numbers had been found. Take a look and think about the questions above and what you would answer if someone asked you these.
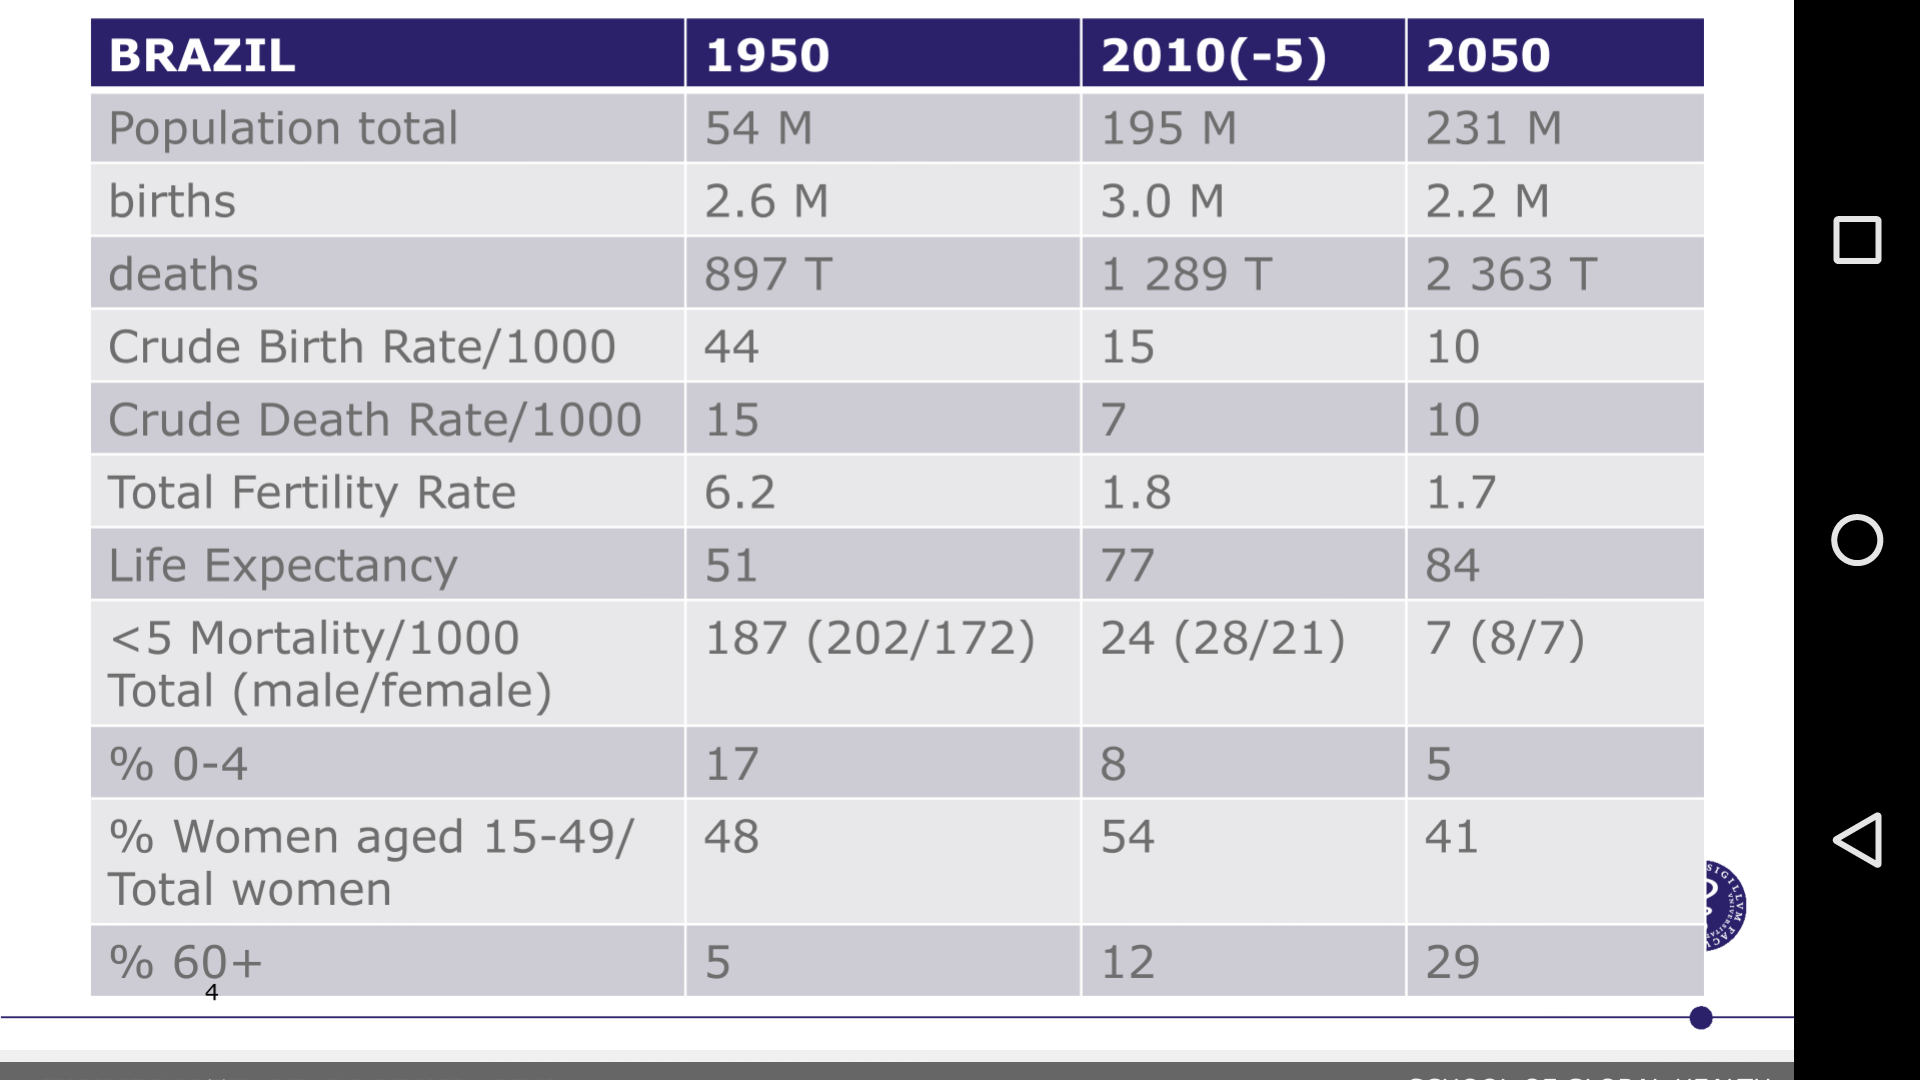
- I noticed… well, it looks fairly normal. Increase population (big jump between 1950 and 2005/10). The big jump would be due to the fertility rate.. 6.2 children per family? Babies everywhere! The population would have been very young, leading to a higher % 0-4 and a very low percent above 60. The death rates were fairly high but then again the crude birth rate was very high – 44! The young population had a very low life expectancy at 51 in 1950 and the under 5 mortality of course, proportional to the young population was very high as well up around 202:172 (male:female). In 2005/10 this was improved quite a bit, those who survived aged increasing the percent above 60 and increasing the life expectancy to 77. With the lowered fertility rate (dropped down to 1.8 per family – much more reasonable) there was a huge drop in <5 mortality rate, a decrease in percent 0-4. With an ageing population there is also an increase in deaths, but that isn’t a bad thing as life expectancy is on its way up. Finally, in 2050 the projections look level, they are fairly close to how it is now, with a hope that there will be even more of a drop in <5 mortality, an increase in life expectancy, and percent above 60. With a leveling out of the fertility rate the population won’t increase too much (compared to the increase seen between 1950 and 2005/10. So again I say.. it looks pretty normal. What do you think? Please let me know if you have any comments because I would love to hear them!
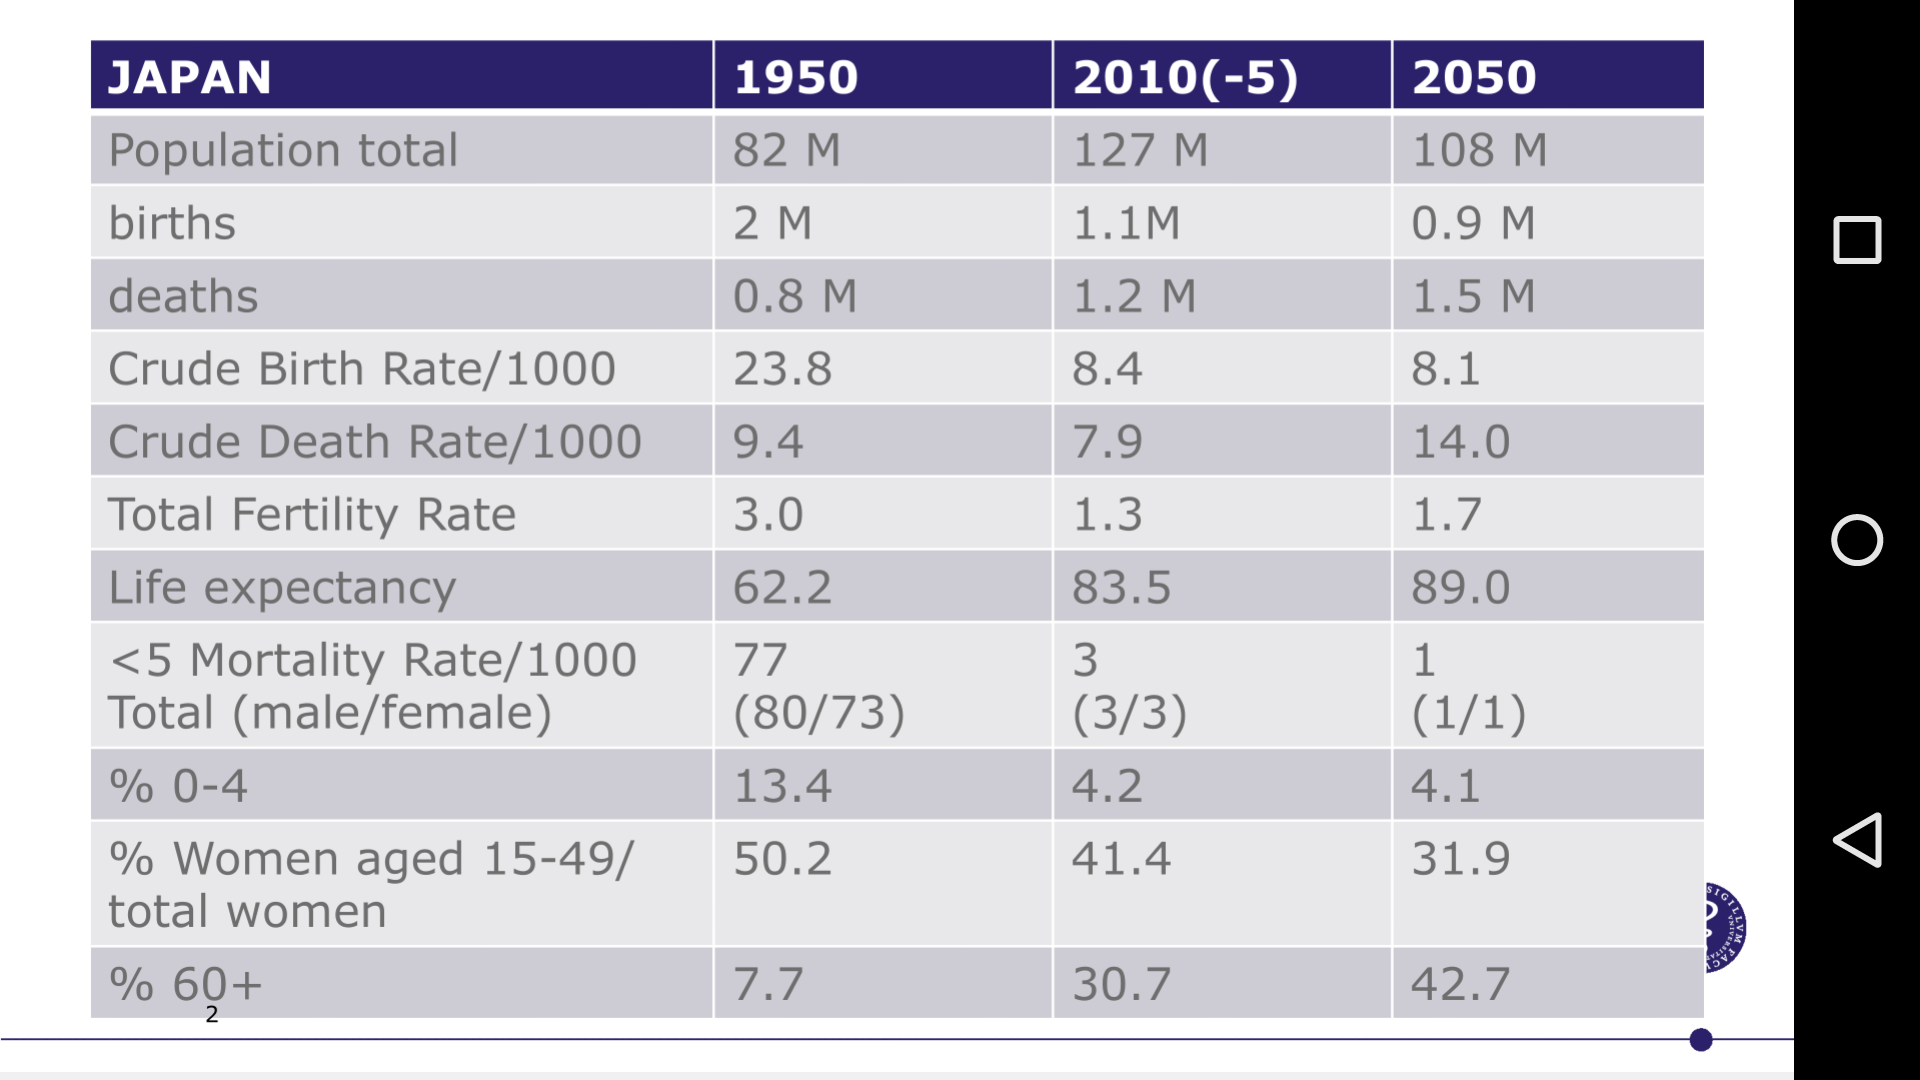
- The other countries got discussed as well, which was actually very interesting once we could compare all of them. The most shocking (at least to me) was Japan.. Look at these numbers and think about the questions above.
- First of all, who knows what japan did? What do they still do to a point? They put in a birth law or ‘rule’ – 1 child per family only. Look at the fertility rate, this is one of the few (Iran has done the same) whose fertility rate drops to control population increases, BUT after the drop there was a realization that the population had dropped too much and now these laws have been revoked and the countries are pushing for women to get married early on and have 2 children. You can see the population increased between 1950-2005/10 from 82M to 127M, this increase was very steep at the beginning. Then the 1 child rule was put into effect lowering the fertility rate to 1.3 per family dropping that increase by quite a bit. You can see how births and crude birth rate start out high and drop across the board, leaving the population to be ageing and quite old. Another factor of the dropping population is the fact that the population is and was beginning to be quite old (shown in the figure below). You can see the percent above 60 increases sharply each time and there is a big decrease in percent of children aged 0-4 (even though the <5 mortality rate has also decreased). This really is showing that the population is ageing and mainly elderly people now. One of the good things about Japan is the life expectancy, Japan is now used as the gold standard measure for the DALY with the highest life expectancy in the world.
What is demography? – Siri explained it as the quantitative study of populations – describing their structure, changes and establishing determinants and consequences.
- Changes:
- Fertility
- Dropped by 50% between 1950 and 2010
- Determinants
- Awareness
- Desire (sociological) – education, urbanization, knowledge of infant/child mortality and women’s status in work and life
- Ability – biologically, sexual preference and union, contraceptive knowledge, use and effectiveness and education/awareness of abortion
- Mortality
- Only two geographical regions show exceptions to the steady increase in life expectancy – Eastern Europe and sub-Saharan Africa
- Migration
- Growth
- With a constant increase in population (continuing from the new count of 9.7 billion reported on July 27th, 2015 – according to the world population prospects 2012 review) in 2100 there will be around 28 billion people living on earth. (only if population increases keep on a constant positive slope)
- Structure:
- Age
- Sex
- The ratio of men to women is off – many reasons are behind this (do you know what they are?)
- Fertility
Throughout the lecture Siri presented the “6 megatrends” which were:
- World Fertility halved 1950-2010 from 5 to 2.5
- Life expectancy increased by 20 years between 1950 and 2010
- Future population growth depends on changes from rural to urban areas in less developed regions
- World population growing by 80 million per year
- In a handful of countries, sex ratio is increasingly skewed – overall, there are approximately 60 million more males than females in the world
- Most future population growth will be at higher ages
And that is it!