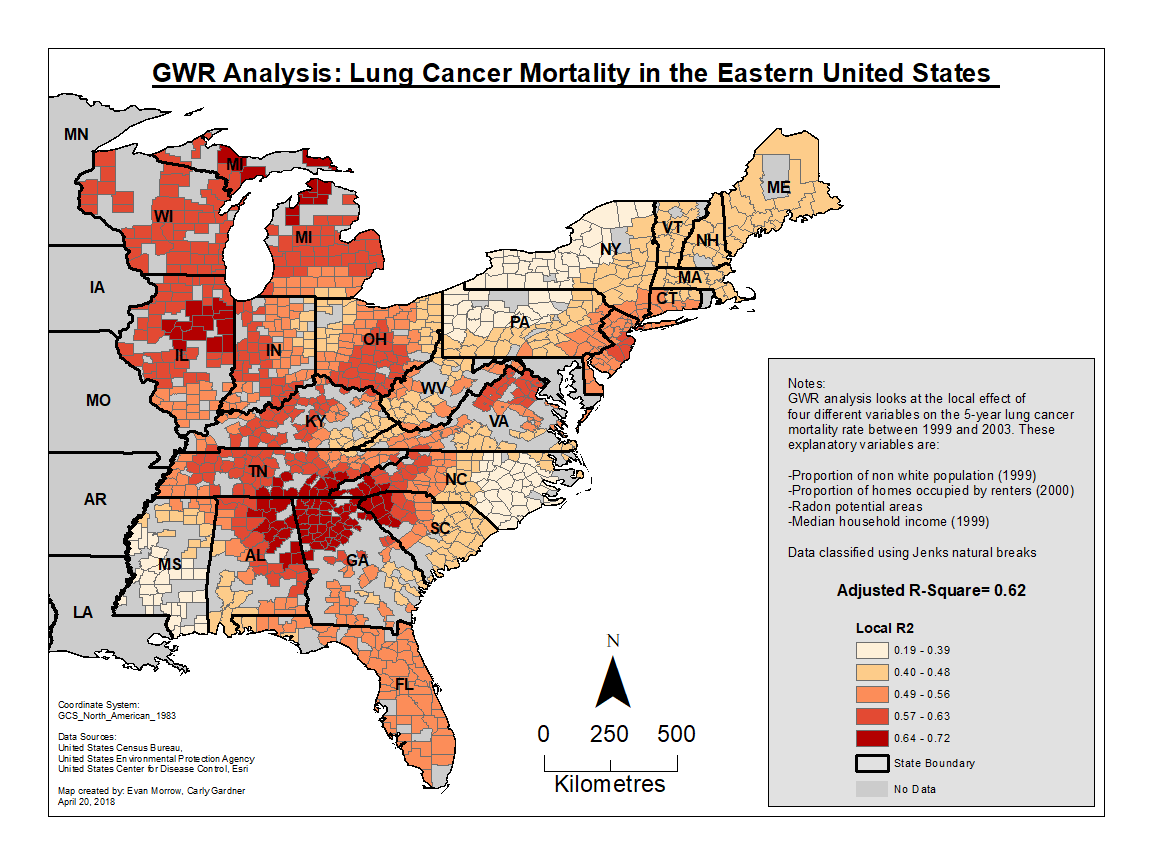
Geographically-weighted regression models assign a greater weight to observations which are nearer to each particular feature location than to those which are further away, removing any spatial dependencies which might have been present in the residuals of the OLS (global) linear regression model. GWR also allowed us to map variation in regression parameters across space. The GWR had a higher adjusted R-squared value (0.62) than the OLS Models 1 (0.48) and 2 (0.54). Highest local R-squared values were present on the western side of the region (Figure 7.1), particularly in northern Georgia, northeastern Alabama, and Tennessee (0.64 – 0.72). Medium-high local R-squared values (0.57 – 0.63) were identified in Wisconsin, Minnesota, and central Ohio. This area, which is best described by our GWR model, overlaps the south-central Appalachian subregion which exhibits multiple significant hot and cold spots for lung cancer mortality rates and explanatory variables such as income, smoking prevalence, proportion non-white population etc.
Coefficient Surfaces
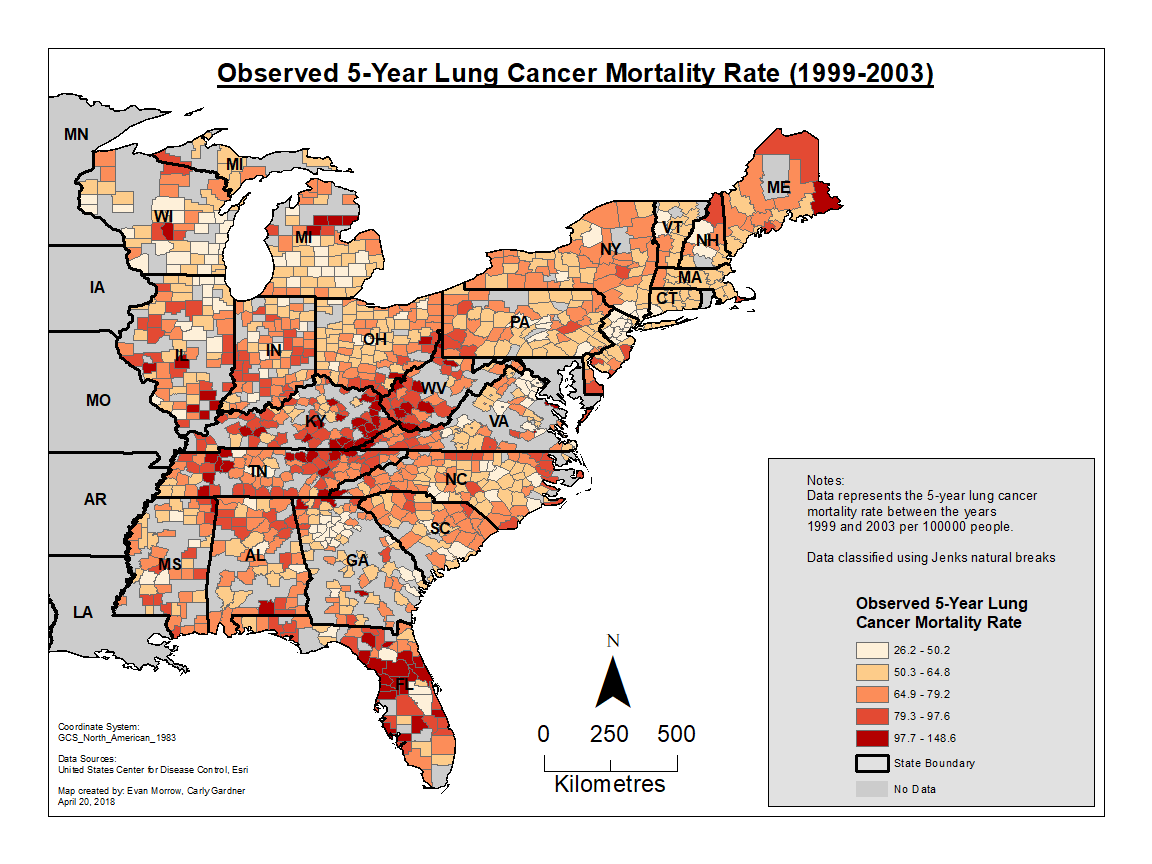
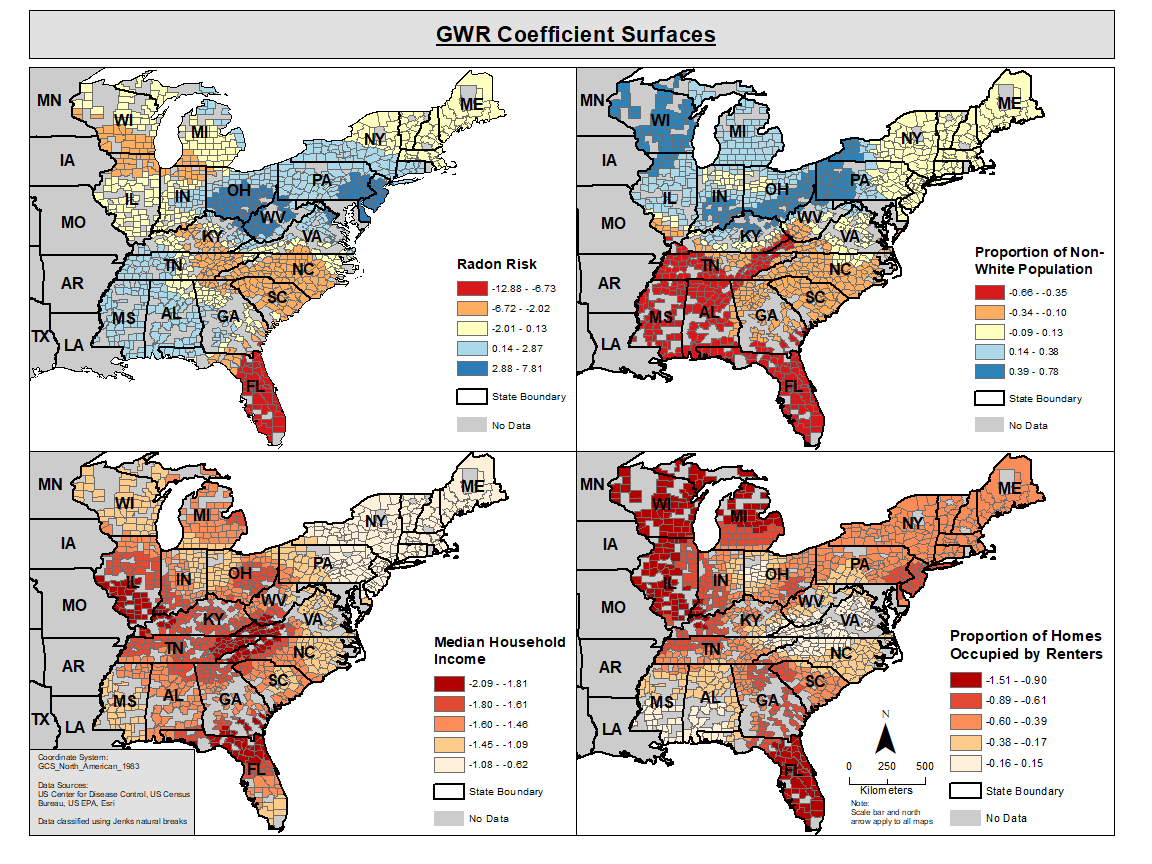
The coefficient surfaces generated by the GWR highlight regional variation in the dependent variables’ explanatory power, providing insight into the associations between observed lung cancer mortality rates (Figure 7.2) and environmental and socioeconomic factors (Figure 7.3).
Radon Coefficient Surface
The radon coefficient surface generated by the GWR highlights a strong relationship between radon risk and lung cancer mortality in Florida. Although Florida is classified as Radon Zone 3, which is predicted to have relatively low average indoor radon concentrations below 2 pCi/L, our model indicates that radon is a major influence on lung cancer mortality in this region. It should be recognized that it is possible for indoor radon concentrations to exceed predicted values and air quality targets within each zone (EPA, 2017). The results of our GWR indicate some statistical significance in Florida, where local R-squared values range from 0.49 to 0.46 across the entire state.
Another area of interest from our radon coefficient surface is the region of convergence between Tennessee, Alabama, Georgia, South and North Carolina. This is an area of highest statistical significance (local R-squared 0.64 – 0.72), where the relationship between radon and lung cancer mortality is neutral or slightly negative. This means that in areas of higher radon risk, there is a neutral or slightly increased lung cancer mortality rate.
Median Household Income Coefficient Surface
The median household income coefficient surface reveals an overall negative relationship across the entire study area. This indicates that as income increases, lung cancer mortality decreases. There are several areas where this relationship is particularly strong, such as northern Florida, southern Illinois, and the central Appalachian region. It should be noted that these regions are also areas of relatively high local R-squared values (>0.49).
Proportion of Non-White Population Coefficient Surface
The proportion of non-white population coefficient surface reveals an interesting division between northern and southern states. In the north, there is a neutral or positive relationship between non-white populations and lung cancer mortality. In other words, as the proportion of racial and ethnic minorities increases relative to the white population, lung cancer remains stable or increases. In the south it is the opposite; there is a negative relationship between non-white populations and lung cancer mortality. This indicates that as the proportion of racial and ethnic minorities increases, lung cancer mortality rates decrease. Particular areas of interest include the region of convergence between Tennessee, Georgia, Alabama, and the Carolinas, where results are a stronger negative relationship with greater statistical significance. Another area of greater statistical significance is seen in Wisconsin, Minnesota and Illinois where the relationship between the proportion of non-white population and lung cancer rates is positive (local coefficients range from 0.14 – 0.78).
Proportion of Homes Occupied by Renters
Nearly the entire area of the eastern United States appears to have a negative relationship between the proportion of homes occupied by renters and the lung cancer mortality rate. Areas of exception include Virginia, northeastern North Carolina, and southern Mississippi and Alabama, where there is a more neutral relationship (-0.16 to 0.15). The areas of greater statistical significance, such as the region of convergence between Tennessee, Alabama etc. has a clear negative relationship with coefficient values ranging from -0.39 to -0.89 in most counties. Counties in northeastern Illinois has a particularly strong negative relationship (-0.61 to -1.51) with greater statistical significance. This is contrary to what one might expect, considering that across the US, more than one in three non-smokers who rent their homes are exposed to secondhand smoke (CDC, 2015).
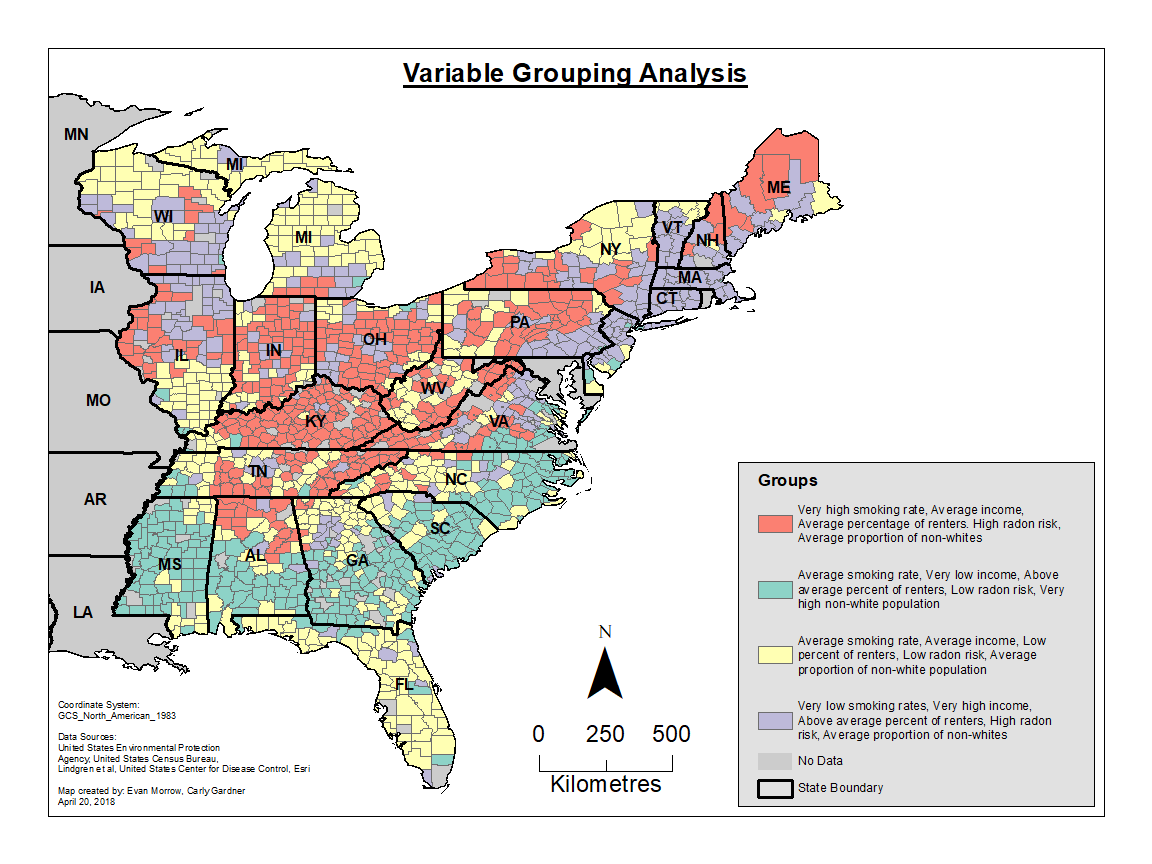
Grouping Analysis
In order to understand the population characteristics of these areas of greater statistical significance, we conducted a grouping analysis (Figure 7.4). When cross referencing the grouping analysis figure and our local R-squared GWR output map (Figure 6.1), it is evident that our GWR regression model best describes the red and yellow groups. The red group spans the largest area in the region, and is characterized as having higher than average risk of radon exposure, a population with very high smoking rates, and average income and average proportion of non-white population. However, it is also evident that Pennsylvania (PA) and western New York (NY) are also in the red group, but are not explained well by our GWR model. This may be due to the fact that the smoking prevalence variable was included in the grouping analysis and excluded from the GWR.