
After identifying significant hot spots of variables within the study area, we input some of those variables into two separate ordinary least squares (OLS) regression models. OLS regression is set upon several important assumptions, including 1) that the observations are independent of each other; and 2) that the relationships between dependent and independent variables are consistent across space. The first OLS regression model (Model 1) excluded smoking prevalence from the model specification in order to observe patterns of association between lung cancer mortality and other environmental and socioeconomic variables (Figure 3.1). The second OLS regression model (Model 2) included smoking prevalence in order to allow for comparison between the two sets of results.
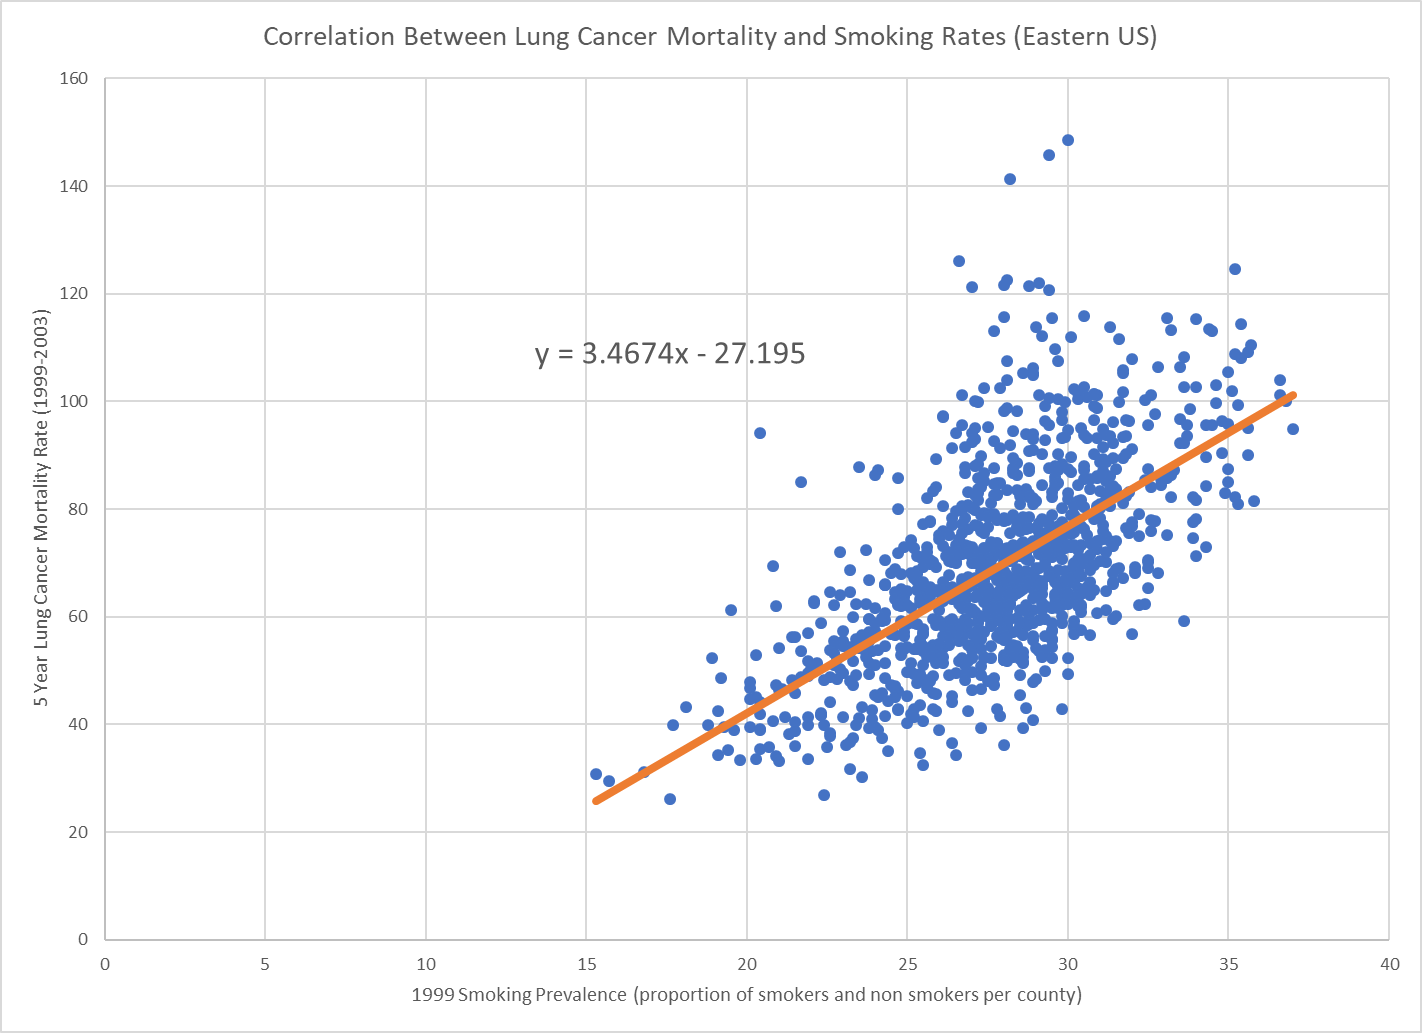
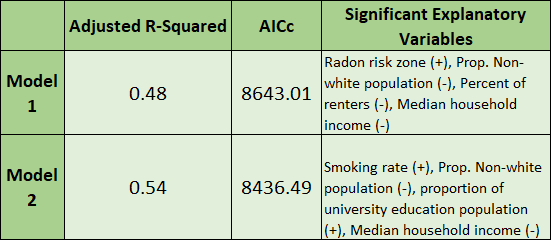
In order to conduct the OLS regression, models had to be properly specified. This is important to ensure that variables chosen for the regression have the highest degree of correlation or explanatory power with the highest level of parsimony. To specify our models we used ArcMap’s exploratory regression tool. Exploratory regression takes a set of explanatory variables and determines models of best fit for explaining a specified dependent variable. For both of our models we chose the combination of variables which had the highest R-squared values and lowest corrected Akaike Information Criterion (AICc) scores. The figure below (Figure 3.2) outlines our properly specified models as well as their associated adjusted R-squared and AICc statistics.
The OLS regressions determine an expected lung cancer mortality rate value based off the relationship with the explanatory variables. By mapping the residuals determined in the analysis, it is possible to identify areas with higher or lower than expected values based on whether or not the residual is significantly higher or lower than the expected value.