The infinite slope analysis is a simplistic slope stability model that can be applied using ArcGIS on a regional scale. The infinite slope equation depends on several soil parameters such as cohesion and friction angle which can all be related to a specific rock/soil type. This model makes large assumptions but is a more analytical approach and should improve hazard analysis compared to arbitrarily assigning weights to both slope and soil type.
Infinite Slope Equation
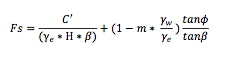
Fs : Factor of Safety (FS) = resisting forces/driving forces; a FS under 1 means that the slope is at risk of failure, a FS above 1 means that the slope is most probably stable.
C’ : Cohesion (kN/m^2)
ϒe : effective unit weight of material = (1-m)ϒdry + mϒsat (where Ydry is dry unit weight of the material, where Ysat is saturated unit of the material (N/m^3))
H : Soil depth
β : slope angle = “Slope”
m : wetness index
ϒw : Saturated (wet) unit weight of material
Φ’’ : angle of internal friction [degrees]
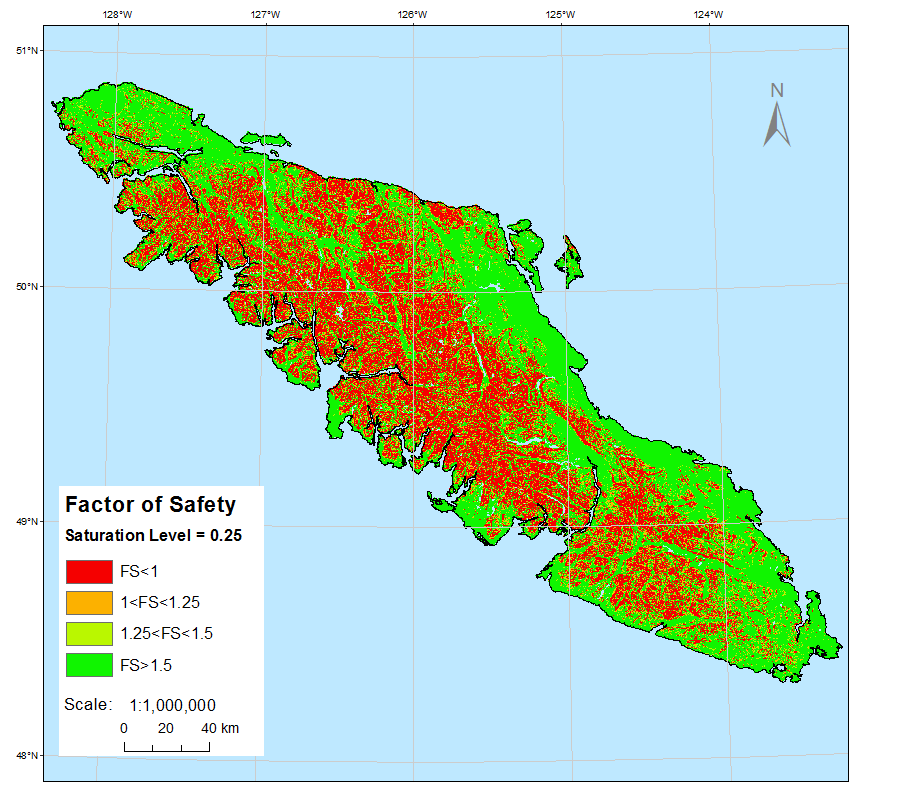
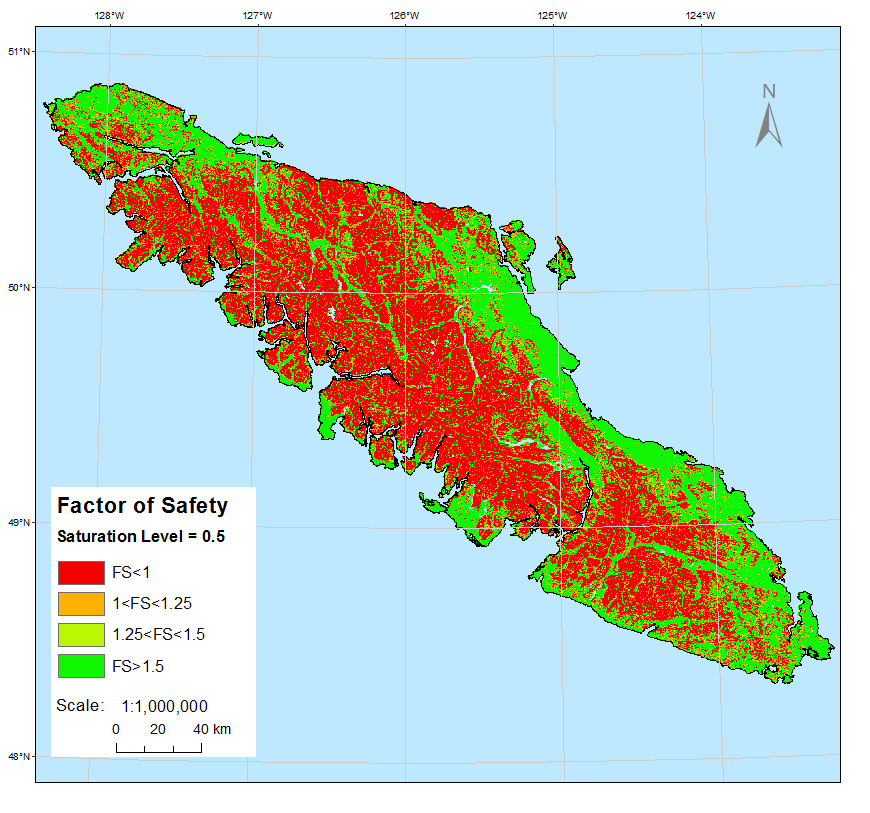
We did run tests with a changing saturation, but the saturation level is very hard to estimate and so we chose to assume the ground was dry. These are the various saturation levels that we tested but only used the dry scenario:
m=0: Assume ground is completely dry, Saturation Level = 0

m=0.25: Assume ground is a quarter saturated, Saturation Level = 0.25
m=0.5: Assume the ground is half saturated – high risk, Saturation Level = 0.5
As we weighted the impact of precipitation on our model during the MCE we could assume that the soil was dry (m=0) for this equation. Thus, effective unit weight equals the dry unit weight in equation (2) which becomes:
![]()
Soil Depth (H)
Depth of material above failure slopes was obtained using map algebra. Raster calculator was used and safety slope equation was imputed to the Vancouver Island DEM (where b is the slope):
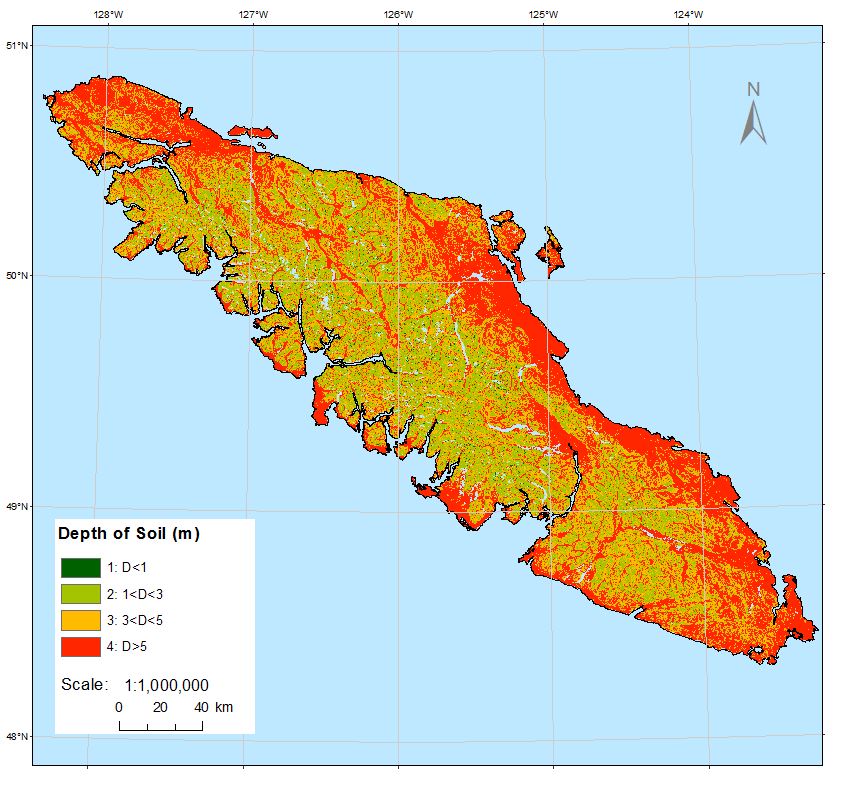
Figure 1 display the distribution of soil depth (m) on Vancouver Island. As illustrated, the coastal regions tend to have on average a greater soil depth than mountainous region. Note that pixels are 100m x 100m.
Geology
First we digitized a map of surficial soil, related geological units to specific geotechnical parameters found in a literature review and then we made rasters for each parameter to use in the deterministic model: Dry unit weight, cohesion and friction angle. The rasters are shown below for each parameter.
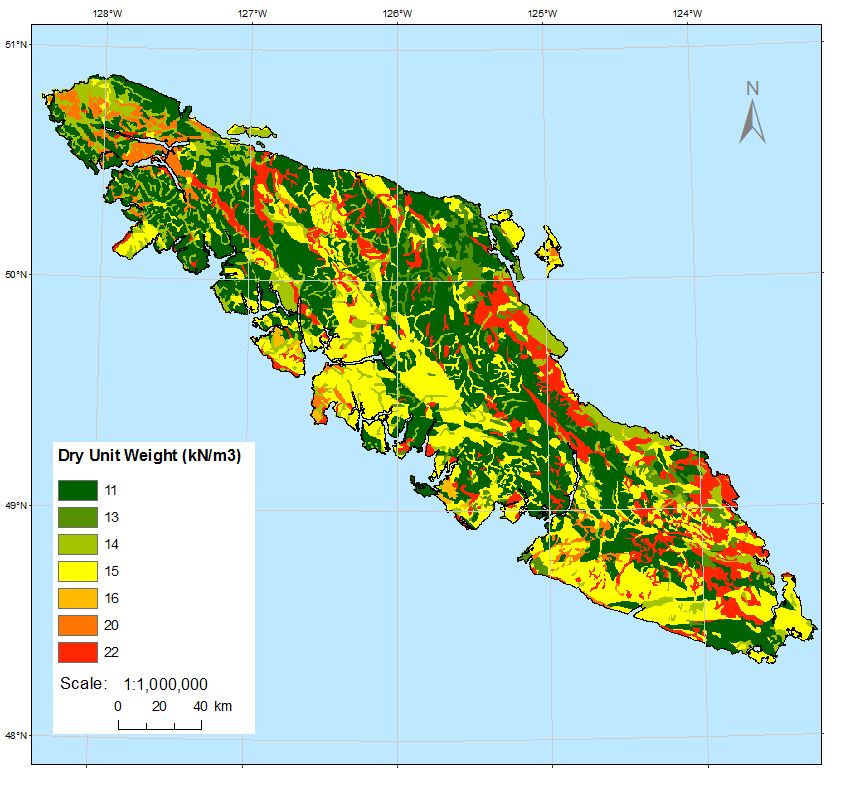 Figure 2 displays the dry unit weight (kN/m3) distribution on Vancouver Island. The values range from 11 to 22 kN/m3. Note that pixels are 100m x 100m.
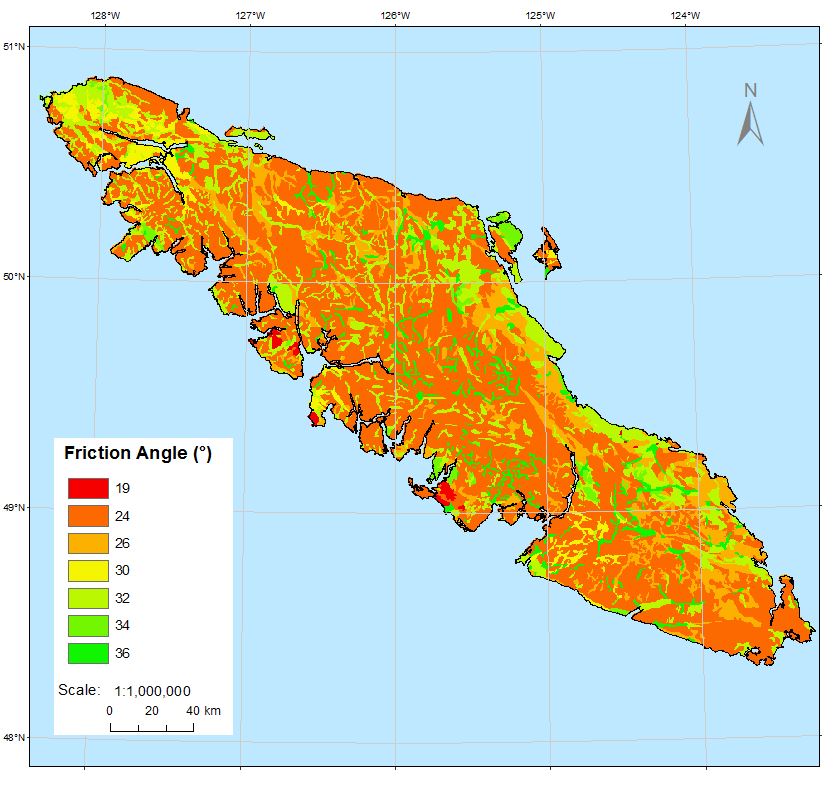
Figure 3 illustrates the distribution of friction angle (degrees). The angle varies from 19 to 36. The most unstable region will have friction angles of 36 degrees and higher while the most stable region will have friction angles of 19 and lower. Note that pixels are 100m x 100m.
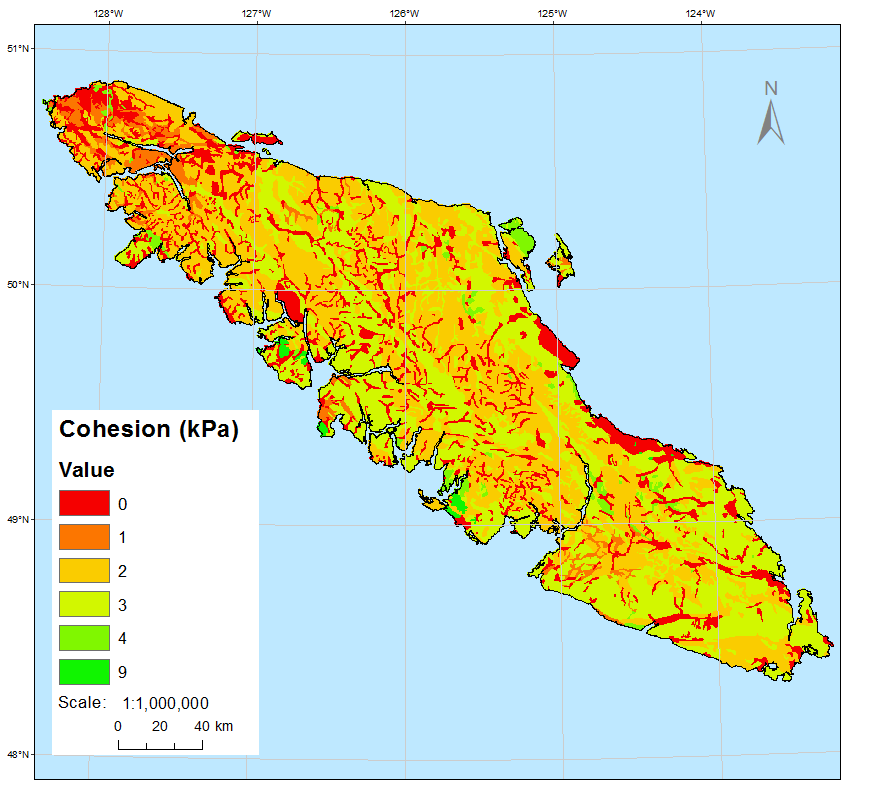
Figure 4 illustrates the distribution of Cohesion.
Factor of Safety (unsaturated) (includes soil and slope properties)
| FS | Int(FS*1000) | New Classification |
| FS<1 | 1000 | 10 |
| 1<FS<1.25 | 1000<FS<1250 | 5 |
| 1.25<FS<1.5 | 1250<FS<1500 | 3 |
| FS>1.5 | FS>1500 | 1 |
http://www.kgs.ku.edu/Publications/pic13/pic13_3.html
The factor safety model used a floating data type, which means it contains decimals. In order to be able to classify the factor safety, we had to convert the data type to integer. We maintained the data integrity by multiplying it by a 1000 and intergized it using the raster calculator. We used the reclassify tool to convert to a new classification and normalized data using linear membership (0-1).