We obtained the data of total precipitation on Vancouver Island from Climate BC and Climate WNA_Map. We initially changed the raster file from Lambert Conformal Conic projection to Albers BC projection. We then extracted Vancouver Island raster by mask using the outline of the Island. Finally, we conducted a fuzzy membership analysis with a linear membership type (obtained normalized data from 0 to 1).
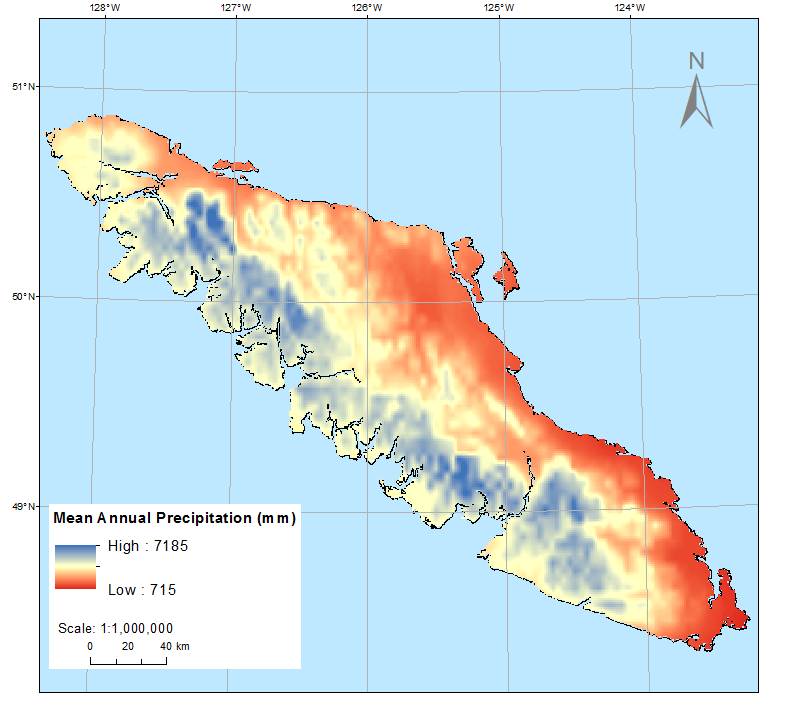
The image above illustrates the distribution of mean annual precipitation (mm) on Vancouver Island. The data were obtained from Climate WNA_map for decade from 1991-2000.The highest value recorded is 7185 mm. Pixels sizes are 1000 x 1000.