Is Westernized Food Killing Our Gut?

Well not really killing your gut, but the vast and diverse biome of microbes that live in your gut. That’s right, you have around one hundred TRILLION helpful bacteria living inside of you! They have many jobs, ranging from helping break down food, helping with the production of vitamins, are a key component in our immune system and much more.

Studies have shown that when humans migrate from less westernized cultures to North America, their gut’s microbiome was significantly reduced in diversity and was predominated by two bacteria, Bacteroides and Prevotella. This decrease in diversity is shown to increase the inflammation in your gut, leading to gut-related diseases that are skyrocketing in modern society. Some of these are obesity, diabetes, Crohn’s disease, ulcerative colitis, allergies, and asthma, to name a few. This change in our microbiome was shown to be due to the Westernized high protein/fat/sugar diet whereas more developing countries have diets of very high fibre with fewer meats and fats.

source: Phys.org

Dr. Dan Knights, an assistant professor at the University of Minnesota, has done research on this change of microbiomes using wild monkeys and their captive counterparts to see if there were any differences. He found that the monkeys had much higher microbe diversity in the wild than when they were confined in a zoo.

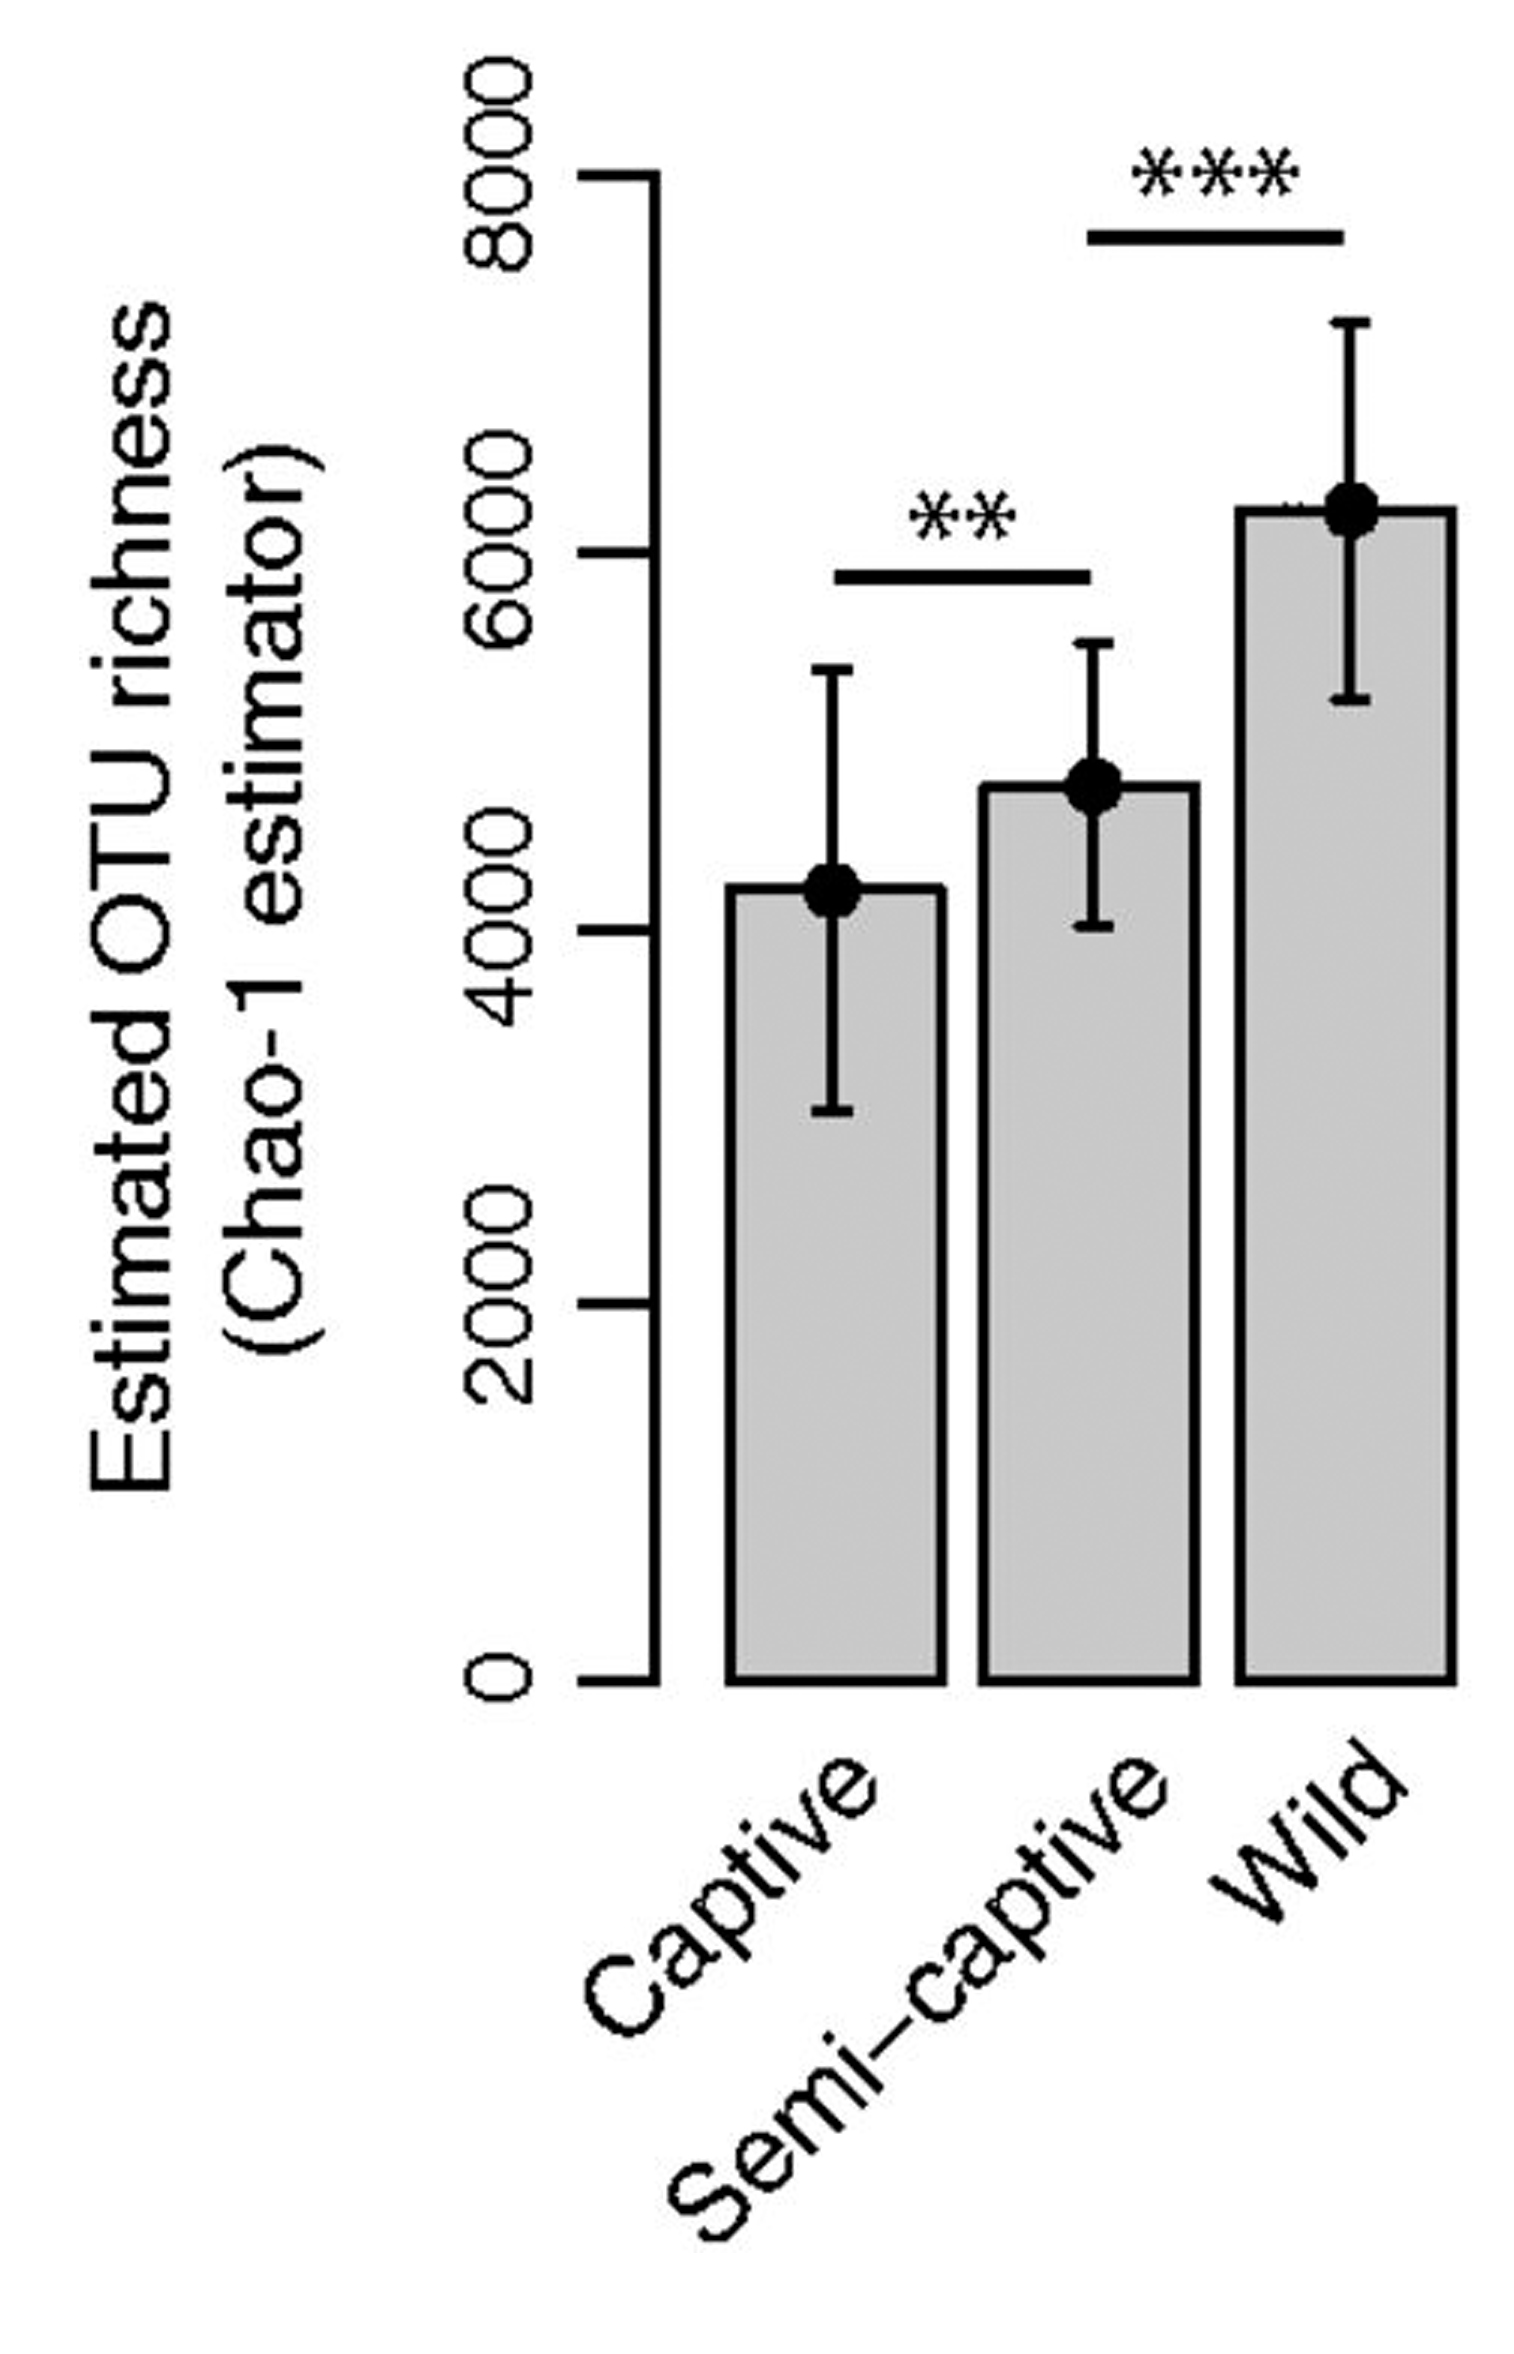
Shows that the diversity of the primates microbiome decreases significantly when removed from the wild. Error bars indicate SD, and asterisks denote significance at **P<0.01, and ***P<0.001. Source: PNAS

Another exciting result he found was that two different wild monkey species with very different gut microbiomes converged to similar lower diverse microbiomes when captive, even though they did not live in the same zoo, never mind the same continent. They were converging towards the microbiome that modern humans have today.

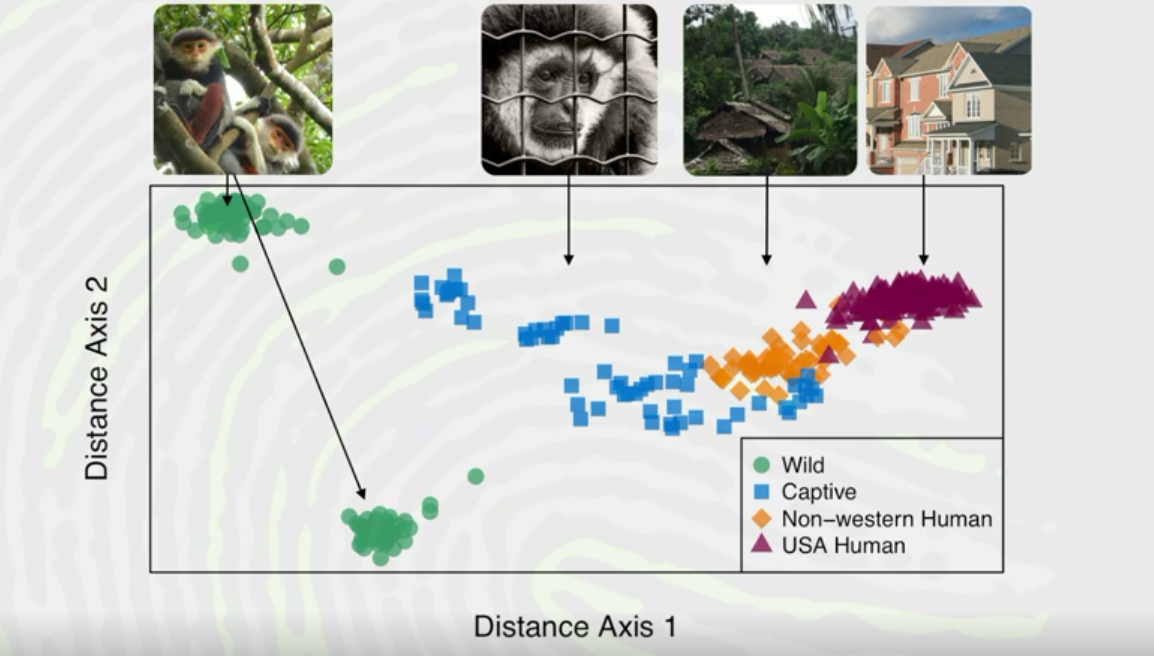
As primates move from wild to captive, their microbiomes converge in the direction of modern humans. Non-western humans also have higher gut microbiome diversity than humans living in westernized areas. Source: TED

The data also showed that non-western humans followed this trend of having higher microbe diversity and subsequently losing this diversity when moving to the USA. This results in these migrants increasing their risk of obesity, diabetes and other gut-related diseases. These results beg the questions on what this ultimately means for our health? Further, this really makes you wonder, are captive monkeys becoming more like modern-day humans or are we just an example of super-captive primates??

~ Amanda Fogh

Gravitational constant G, the one value that behind “everything”

New equipment for the measuring the gravitational constant G is reported by Li on Nature using two techniques TOS and AFF.

As we all have studied in High school science class or physics class, the reason that an apple will fall from trees, a rocket needs to thrust hot air to the ground to take off and even how can astronauts can ‘fly’ in the middle of air all have to do with gravitational constant G.  The gravitational acceleration is often been mistaken as gravitational constant just as mistaking gravity as the only gravitational force. The gravitational force is the attractive force between any two objects and the force is proportional to the weights of the two objects(assume the distance is a constant) and this proportion is the G. Just like the most common noticed gravitational force we are experiencing, gravity, is actually the attraction between us or an object with earth.

Nowadays, even though there are still some strong arguments on G should not be treated as a constant, it is generally been accepted that Newton’s law of universal gravitation is ‘true’ and gravitational constant can be measured.  Starting from this point of view, getting an accurate gravitational value is crucial since this value has been used for lots of daily life technology and precise aerospace calculations in astronomy.

Uncertainties of current and previous experiments. Made by Stephan Schlamminger

This passage will compare the traditional way of measuring G and a new improved way of doing it developed by a research group lead by Qing Li. The measurement of G is affected by lots of factors such as air, magnetic field and more importantly other objects that are near the equipment. For the reason of presenting so much factors, the uncertainty of the results is very large as reported by Mohr the uncertainty is 47 parts per million. While in Li’s group, they achieved recorded the smallest uncertainty of 14 parts per million while the largest uncertainty is 550 parts per million larger.

In the early days, the first successful measurement of G was done by Cavendish in 1798 and the part that is hanged by string is two connected spheres in a dumb-bell shape as you can see from the video below.

But in Li’s group, they built a “two plate-containing torsion balances” which uses two plates to replace the spheres to improve the precision. Also what worth mention is they used a fused silicon dioxide (silica) fibers with high-quality factor of the torsional oscillation mode (Q) to reduce the anelastic effect. And with all the other improvements together they managed to obtain the smallest uncertainty.

The instruments made by Li’s team. Source

This experiment can potentially benefit a lot of area of work by providing a more accurate fundamental constant value. The accuracy of work and research from the benefited field can also be improved.

The Return of Measles

Why Parents Fear Vaccines | Tara Haelle https://www.youtube.com/watch?v=ggtkzkoI3eM (Accessed Mar 20, 2019)

Can vaccines cause autism? A question posed by many uneducated masses, the fear of an article read online far outweighing the scientific backings of hundreds of research studies1. For the majority of people, the answer is simple, vaccines are completely safe, but it only takes a small group of people to make a huge negative impact on the rest of society. By being entrenched in the mindset that vaccines are harmful, it creates a backdoor for the re-introduction of various harmful and deadly diseases, like measles2.

                              Infographic of measles cases in the United States                                Blount, E. Misinformation on Vaccines Causes Measles Outbreak. https://gmhslancerledger.com/5508/news/misinformation-on-vaccines-causes-measles-outbreak/ (accessed Mar 21, 2019).

Measles is a highly contagious and highly preventable disease. Symptoms can lead to high fevers and body-wide rashes. Complications with the diseases can arise including pneumonia. They are also responsible for infecting 20 million people each year and resulted in the deaths of hundreds of thousands3. The disease is airborne so passing it on person to person is quite easy. Once a person is infected there is no specific treatment, only supportive care. Measles is most common in developing parts of the world such as developing parts of Asia, but with the return of “anti-vaxxers” it is making its comeback to many developed parts of North America. As shown in the provided figure, the number of measles deaths was expected to rise after continually falling.

A figure of estimated worldwide deaths of measles and projected worst-case scenarios
Global Measles Mortality, 2000–2008. https://www.cdc.gov/mmwr/preview/mmwrhtml/mm5847a2.htm (accessed Mar 21, 2019).

Herd immunity is a form of indirect protection in which a large portion of a population is immune to disease through previous exposure or vaccines, thereby providing a measure of protection for those that are not immune4. It works by having a large portion be immune, therefore containing a breakout from spreading person-to-person. This is one of the best forms of protection for those that can not be immune due to medical reasons. This system falls apart though if more and more people decide against vaccinations. The fewer people that are immune, means the more opportunity for the outbreak of diseases to spread and infect those who are not immune5.

                                                 An infographic of herd immunity                                      Herd immunity. https://en.wikipedia.org/wiki/Herd_immunity (accessed Mar 22, 2019).

Imagine a world where polio is still a prevalent disease affecting millions or a world where smallpox is still around and active. The eradication of these diseases was only possible due to the worldwide vaccine movement and subsequent herd immunity that followed6. Most adults are set in their stubborn ways, as such explaining to them the importance of vaccines usually falls on deaf ears. The best solution to prevent further outbreaks and help create a world eradicated of preventable diseases is to start young and teach kids the importance for future generations.

1Dixon, G. N.; Clarke, C. E. Science Communication 201235 (3), 358–382.

2Chang, L. V. Health Economics 201827 (7), 1043–1062.

3Moss, W. J. The Lancet 2017390 (10111), 2490–2502.

4Fine, P.; Eames, K.; Heymann, D. L. Clinical Infectious Diseases 201152 (7), 911–916.
5Betsch, C.; Böhm, R.; Korn, L. Health Psychology 201332 (9), 978–985.

6Phadke, V. K.; Bednarczyk, R. A.; Salmon, D. A.; Omer, S. B. Jama 2016315 (11), 1149.

~ Danial Yazdan

Image

New technology might allow mammals to have super-visual capabilities in the future

Radio waves, gamma rays, visible light, and all the other parts of the electromagnetic spectrum are electromagnetic radiation. However, a typical mammalian eye can only respond to visible light, which is a small portion (<1%) of the electromagnetic spectrum. But a recent study shows a new technology that may enable humans to sense near-infrared light.

The electromagnetic spectrum. Retrieved from Wikipedia Common.

The group of Professor Tian Xue from the University of Science and Technology of China and the group of Professor Gang Han from the University of Massachusetts State University have for the first time achieved the naked-eye infrared light perception in mice. Mice were able to see near-infrared light after being injected with special nanoparticles into their eyes. The special nanoparticles named pbUCNPs can anchor tightly on the retinal photoreceptors of mice and convert near-infrared light into visible green light. Additionally, these nanoparticles can stay in the eye for over two months without any obvious side effect.

The injection of the nanoparticles into the eyes of the mice. Image created by Ma et al.

Xue said: “This research breaks through the limitations of traditional near-infrared spectroscopy and develops a naked-eye passive infrared vision expansion technology, suggesting that humans have the potential for super-visual capabilities.”

To prove that the injected mice could see near-infrared light, the scientists did two experiments.

One experiment called pupillary light reflex. The pupillary light reflex gives the constriction of pupils in response to stimulation of eyes by light. The researchers shined near-infrared light into the eyes of injected and non-injected mice. The pupils of the injected mice constricted, while the non-injected mice showed no response.

pbUNCPs allow for detection of near-infrared (NIR) light. (A) Images show only the mouse injected with pbUCNPs gives a reflex when exposed to NIR light (980 nm), indicating that pbUCNP-injected mice are able to sense NIR light. (B) The curve shows the more intensive the NIR light is, the greater the pupil constriction response. Data are mean±SD. (Ma et al., 2019)

In the second experiment, as mice prefer to stay in the dark, the researches designed a box with two connected compartments. One compartment was completely dark, and the other was illuminated with near-infrared light. Scientists observed that the injected mice spent more time in the dark compartment, while the non-injected mice spent similar amounts of time in both compartments. 

The set-up of the Light-Dark Box. (Ma et al., 2019)

pbUCNP-injected mice recognize and respond to NIR light. Control mice and those injected with pbUCNPs responded to visible light (525 nm). However, when the light was in the NIR range (980 nm), only mice injected with pbUCNPs responded. Data are mean±SD. (Ma et al., 2019)

These two experiments proved that the injected mice perceived near-infrared light. Moreover, the scientists showed that the nanoparticles would not affect the normal vision of the injected mice.

This technique can potentially be applied to humans not only for generating super vision but also for repairing visible spectrum defects, such as colour blindness. 


Wenxin Zhao

Using uncertainty-based strategies for modelling atmospheric pollutants

After World War II, thousands of synthetic chemicals became commercially available for use in agriculture, manufacturing, or disease control. Some of these chemicals were classified as “persistent organic pollutants”, or POPs, because of how they resist degradation, persist in the environment, and are toxic to plants or animals.

One well-known example is DDT, an insecticide that became infamous for its health and environmental impacts after Rachel Carson’s Silent Spring was published in 1962, and was ultimately banned for American agricultural use in 1972. Like many POPs, DDT magnifies along the food chain and accumulates in fish. In 2018, University of Maine researchers found that children who eat fish from rivers fed by the Eastern Alaska Mountain Range have a cancer risk above the Environmental Protection Agency’s threshold limit.

A biogeochemical cycle of PAHs in the environment. Source: Microbial Biodegradation and Bioremediation (Das et al. 2014)

In order to better understand the atmospheric chemistry of POPs, Colin Pike-Thackray—a graduate student in Dr. Noelle Selin’s group at the Massachusetts Institute of Technology—used quantitative models based on uncertainty. One class of pollutants that Pike-Thackray focused on in his thesis were polycyclic aromatic hydrocarbons (PAHs), which result from fuel or biomass consumption. Similar work in the field had revealed that uncertainty in simulations of DDT concentrations result from estimated emission and degradation constants, while uncertainty in simulations of mercury concentrations in the air and ocean surface were due to partition coefficients and reaction rate constants.

Uncertainty distributions for the atmospheric concentrations of different PAHs (colour-coded) in the Northern Hemisphere and the Arctic. Anuual (solid), winter averaged (dot-dashed), and summer (dotted) averages are shown. Source: Environmental Science and Technology (Pike-Thackray et al. 2015)

Using the mathematical method of “polynomial chaos”, in which each parameter of a dynamic system is a source of uncertainty, Pike-Thackray et al. (2015) found that a variety of factors increased the uncertainty of estimated PAH concentrations. One leading contributor was the black carbon-air partition coefficient, which describes the relative concentrations of PAHs trapped in in air or black carbon at equilibrium. The oxidation rate constants of PAHs were also significant sources of uncertainty. In addition to uncertainty arising from parameters specific to PAHs, the researchers also considered the uncertainty associated with precipitation or advection (the horizontal mass motion of the atmosphere).

Measured (black) and simulated (blue) monthly concentrations for different PAHs, where the shaded regions mark one and two standard deviations for the uncertainty distribution. Source: Environmental Science and Technology (Pike-Thackray et al. 2015)

Notably, Pike-Thackray et al. modified their models to be consistent with experimental observations. The researchers also compared the different strategies and amount of computational power needed for different modelling approaches, and claimed that their methods offer “a significant advantage over traditional model parameter sensitivity tests” because of how they “quantify the relative importance of each parameter, as well as account for their interactions in the model system”.

Best estimates, uncertainties, and literature values for various physical and chemical parameters associated with a specific PAH. Source: Environmental Science and Technology (Pike-Thackray et al. 2015)

Overall, this research reveals which parameters cause the greatest uncertainty in modelling the concentration and transport of PAHs in the atmosphere. My opinion is that this research is extremely interesting and worthwhile because targeting these parameters could allow the development of better environmental models and predictions, which could in turn influence both government regulation and commercial use of POPs. Furthermore, the work presented in Pike-Thackray’s thesis is an interesting example of how chemistry, environmental science, statistics and mathematics can all intersect and be applied towards a real-world issue.

— Jessica Li

References

  1. United States Environmental Protection Agency. Persistent Organic Pollutants: A Global Issue, A Global Response. https://www.epa.gov/international-cooperation/persistent-organic-pollutants-global-issue-global-response (accessed Mar 22, 2019).
  2. United States Environmental Protection Agency. DDT – A Brief History and Status. https://www.epa.gov/ingredients-used-pesticide-products/ddt-brief-history-and-status(accessed Mar 22, 2019).
  3. The University of Maine. DDT in Alaska meltwater poses cancer risk for people who eat lots of fish.  https://umaine.edu/news/blog/2018/12/06/ddt-in-alaska-meltwater-poses-cancer-risk-for-people-who-eat-lots-of-fish/(accessed Mar 22, 2019).
  4. Schenker, U.; Scheringer, M.; Sohn, M. D.; Maddalena, R. L.; McKone, T. E.; Hungerbühler, K. Using information on uncertainty to improve environmental fate modeling: A case study on DDT. Env. Sci Technol 2009, 43, 128–134.
  5. Qureshi, A.; MacLeod, M.; Hungerbuhler, K. Quantifying uncertainties in the global mass balance of mercury. Glob. Biogeochem Cycles 2011, 25.
  6. Kim K.; Shen, D.E.; Nagy, Z.K.; Braatz, R.D. Wiener’s Polynomial Chaos for the Analysis and Control of Nonlinear Dynamical Systems with Probabilistic Uncertainties. IEEE Control Systems Magazine, 2013, 33, 5.
  7. Thackray, C.P.; Friedman, C.L.; Zhang, Y.; Selin N.E. Quantitative Assessment of Parametric Uncertainty in Northern Hemisphere PAH Concentrations. Env. Sci Technol 2015, 49, 15, 9185–9193.
  8. Pike-Thackray, C.M. An uncertainty-focused approach to modeling the atmospheric chemistry of persistent organic pollutants. Ph.D. Dissertation, Massachusetts Institute of Technology, Cambridge, MA, 2016.

Ketamine as an antidepressant. Is that oK?

Since its development in 1962, ketamine has been used primarily as an anesthetic for veterinary procedures. In recent years, however, research investigating its use has extended to psychiatry, with evidence supporting ketamine as a viable treatment for Major Depressive Disorder, colloquially known as depression.

https://www.researchgate.net/figure/Chemical-Structure-of-Ketamine-5_fig2_320345763

Figure 1. Chemical structure of Ketamine

The most commonly used antidepressant drugs are tricyclic antidepressants and selective serotonin reuptake inhibitors (SSRI). Upon daily administration, these drugs relieve depression, but only after approximately 3- 6 weeks. Moreover, for those with treatment-resistant depression (TRD), SSRIs prove to be of little benefit. Remarkably, current studies suggest that ketamine improves symptoms within 30 minutes, with therapeutic effects for even TRD patients.

An article published in JAMA elucidates the potential of N-methyl-D-aspartate (NMDA) ketamine for the treatment of TRD: in a preliminary study involving eight subjects with depression, Zarate et al determined that a single dose of NMDA ketamine resulted in a rapid but short-lived antidepressant effect. In a subsequent double-blind randomized clinical trial, subjects received intravenous infusions of ketamine hydrochloride or midazolam as placebo. The participants used the Hamilton Depression Rating Scale (HDRS) to measure the changes in drug efficiency. As seen in the linear mixed model, in Figure 2, the difference between ketamine and placebo treatment over 9 points from baseline to 7 days were examined with standard error. Within 110 minutes after the injections, participants receiving ketamine showed significant improvement in depression compared to subjects receiving placebo (with P<0.05).

Figure 2. Changes in the 21-item Hamilton Depression Rating Scale (HDRS)

The implications from this study and the many other breakthrough studies have not gone unnoticed. The development of chemical variations of ketamine has shown that the drug is a powerful tool that can allow people to live life to the fullest potential. In fact, on March 5th, 2019, the Food and Drug Administration (FDA) approved Esketamine, a nasal spray formulation derived from ketamine, for TRD. Targeting the brain’s glutamate pathway, Esketamine is the first drug in thirty years to be approved with a new mechanism of action for treating depression. Of course, the FDA approval of Esketamine does not negate the lingering caveats and concerns relating to its abuse. Nonetheless, even as studies continue to investigate Esketamine’s adverse effects, many physicians remain optimistic that it may become “the biggest breakthrough in depression treatment since Prozac.”

Figure 3. Esketamine, which will be marketed under the trade name, Sparavato

In the following video, Dr. J. John Mann at Columbia University highlights the importance of the approval of Esketamine and the potential risks involved.

-Brina

The Search for Exoplanets: A New Frontier in Astronomy

Have you ever wondered how many stars there are in our universe? The number is anywhere between ten thousand trillion (1022) to one quadrillion (1024). The fraction that fall within the same classification as our sun, a G type star, is about 7.6%. Additionally, it is estimated by NASA that 1 in 6 stars will contain an Earth-Sized planet. Further, detecting Earth-sized planets hundreds of trillions of miles away is a non-trivial feat to say the least, leading to possible underestimates and uncertainty. Human curiosity of space and the intrinsic challenge of finding these seemingly hidden planets in the vastness of space has led astronomy to a new frontier.

The discovery of new exoplanets canidates by the Kepler Space Telescope as of June 2017. Source: Wikimedia commons

Astronomy is constantly reminding us that earth and our solar system is minute. While much is known about our immediate solar neighborhood, gaps in knowledge and improved technology has driven a strong surge in detection of astronomically small objects. In particular, there has been a growing interest in exoplanet detection. Exoplanets are simply planets outside of our solar system. So far, we have discovered 3926 exoplanets, with the Kepler space telescope launched in 2009 claiming 2338 with another 2423 living in limbo yet to be confirmed. While stars emitting immense amounts of light may occasionally be detected directly, exoplanet detection often relies on indirect techniques.

Artist depiction of Pegasi 51 b. Source: Wikimedia commons

The first exoplanet detection was made in 1992 by astronomer Aleksander Wolszczan orbiting around an exotic type of star called a pulsar at 2300 ± 100 light years away. Another breakthrough occurred in 1995 when the exoplanet 51 Pegasi b was discovered orbiting around a star more comparable to our sun. 51 Pegasi b since has been extensively studied alongside it’s star Pegasi b. Using the radial velocity technique which takes advantage of changes in the wavelength of light by a phenomenon called the doppler effect and the gravity of an orbiting planet, 51 Pegasi b was determined to have an orbital period of 4.230785 ± 0.000036 day. In addition to the accuracy in which these measurements could be made, the detection changed planetary astronomy according to Didier Queloz who at University of Geneva alongside Michel Mayor made the discovery: “The shock was so profound that 51 Peg completely changed our perspective of how we could look for planets.”

Radial velocity measurements of 51 Pegasi from 1995 where the exoplanet 51 Pegasi b was detected with error bars at each point. Source: Harvard, with original publication from Nature, 1995, Vol 273, pp. 355. 

At the University of British Columbia, Professor Jaymie Matthews of the Physics and Astronomy department is seeking to improve exoplanet detection by increasing the accuracy of gravitational field measurements. In a paper published by Matthews in 2016, a new way to measure the surface gravity of stars with accuracies of 4% is presented. Matthews said: “If you don’t know the star, you don’t know the planet.” Another group of Scientist at the University of Washington as of 2014 measured the diameter of a “super-earth” with an accuracy of 1%, or about 148 miles at 300 light years away.

https://www.youtube.com/watch?v=9vNcWCwwSbs&frags=pl%2Cwn

– Dr. Jaymie Matthews on The Rush on Shaw TV discussing the birthday of the Hubble Space Telescope. Source: The Rush on Shaw TV, Youtube 2012

While stars like Pegasi 51 and it’s exoplanet might be 50.45±0.10 light years away and far from reachable, the star and planet are an endless source of curiosity for astronomers. With exoplanet detection growing as a field, the discovery of more nearby Earth-like planets might be worth watching out for.

—- Jonah A

References:

  1. NASA Exoplanet Science Institute: NASA Exoplanet Archive.  https://exoplanetarchive.ipac.caltech.edu/docs/counts_detail.html

Blood test: the future diagnostic method for Alzheimer’s Disease

Alzheimer’s disease (AD) is a type of brain disease that causes problems with thinking, memory, and behavior and leads to dementia. AD is frustratingly common among seniors over the age of 65. Approximately there are 5.8 million people in the United States are suffering; by 2050, this number will probably increase to 14 million.

How Alzheimer’s Changes the Brain. Source: https://www.youtube.com/watch?v=0GXv3mHs9AU

Although there is no current cure, an early and accurate diagnosis can help patients to access proper treatments which can slow the worsening of symptoms and improve quality of life for those suffering from AD. However, no single and efficient test can provide a reliable diagnosis. After doctors conduct interviews with patients with possible signs of symptoms, several blood tests and brain imaging are needed to rule out the other brain illnesses and confirm the diagnosis. This process may take several months, and the accuracy is only up to 75 to 85%. Researchers have been working on better and more efficient diagnostic methods. One advanced tool is Positron emission tomography (PET) scans which can detect the hallmark of abnormal protein clusters in brains and afford reliable results. However, these tests can cost thousands of dollars, and most people do not have access and never get tested.

PET scan showing glucose metabolism associated with decreased cognitive function.
Source: https://www.sciencedaily.com/releases/2009/07/090714085812.htm

For decades, researchers have been on the quest to develop a blood test for AD for blood testing is the most common and affordable medical diagnostics. The exciting news is that researchers have identified blood-based biomarkers of the disease that can provide fast and accurate measurements. A biomarker is a substance whose detection indicates a particular disease; in the case of AD, the particular substance is a protein called amyloids. One significant pathological signature of AD is the appearance of clumps of abnormal amyloid protein in brains. Those clumps are made of a mixture of peptides which form from the breakdown of the amyloid precursor protein (APP). In 2010, Bateman and his colleagues from Washington University School of Medicine found that the amount of a peptide known as amyloid-b 42 (Ab42) is significantly higher in the in a patient’s blood sample. However, several follow-up studies have suggested that the number of amyloid peptides, including Ab42, increases as people grow old, so the method of detecting Ab42 is proved unhelpful. In recent years, some research shows that the ratio of Ab42 to another peptide Ab40 indicates the significant difference in the diseased brain from a cognitively normal brain. Written in Nature last year, Yanagisawa and his team from the National Center for Geriatrics and Gerontology reported that using the ratio of these two peptides as the biomarker provides highly accurate results.

Figure 1: The clearance rate of amyloid- 40 and 42 peptides of 12 Alzheimer’s disease participants (red triangles) and 12 control (blue circles). The average clearance rate of amyloid-40 and 42 peptides is slower for AD individuals compared with cognitively normal control groups, suggesting the potential usage of these two peptides as biomarkers. Source: https://www.nature.com/articles/nature25456.

Although blood tests are not approved for commercially used yet, most researchers in the field believe that an affordable and accurate blood test for everyone will be commercially available in five years, especially when more proteins, such as neurofilament light polypeptide, are also found to be good candidates for biomarkers.

References:

National Institute on Aging. What Is Alzheimer’s Disease? https://www.nia.nih.gov/health/what-alzheimers-disease (accessed on March 21, 2019)

Alzheimer’s Association. Facts and Figures. https://www.alz.org/alzheimers-dementia/facts-figures

RadiologyInfo.org. Positron Emission Tomography-Computed Tomography. https://www.radiologyinfo.org/en/info.cfm?pg=pet (accessed on March 21, 2019)

Strimubu, K.; Tavel, J. A., Curr. Opin. HIV AIDS., 2010, 5, 463-466

O’Brien., R. J.; Wong, P. C., Annu. Rev. Neurosci. 2011, 34, 185-204

Amyloid precursor protein, Wikipedia.org, https://en.wikipedia.org/wiki/Amyloid_precursor_protein (accessed on March 21, 2019)

Mawuenyega, K. G.; Sigurdson, W.; Ovod, V.; Munsell, L.; Kasten, T.; Morris, J. C.; Yarasheski, K. E.; Bateman, R. J., Science, 2010, 330, 1774

Arnaud, C. H., Study tests plasma biomarkers for Alzheimer’s. https://cen.acs.org/articles/96/i6/Study-tests-plasma-biomarkers-Alzheimers.html (accessed on March 21, 2019)

Nakamura, A.; Kaneko, N.; Villemagne, V.L., Kato, T.; Doecke, J.; Dore, V.; Fowler, C.; Li, Q.; Martins, R.; Rowe, C.; Tomita, T.; Matsuzaki, K.; Ishii, K.; Ishii, K.; Arahata, Y.; Iwamoto, S.; Ito, K.; Tanaka, K.; Masters, C. L.; Yanagisawa, K., Nature, 2018, 554, 249-254

Lewczuk, P.; Ermann, N.; Andreasson, U.; Schultheis, C.; Podhorna, J.; Spitzer, P.; Maler, J. M.; Kornhuber, J.; Blennow, K.; Zetterberg, H., Alzheimer’s Research & Therapy. 2018, 10

Fallible Fingerprints

Before DNA evidence became the golden standard for forensic labs, convicting a criminal often meant dusting the crime scene for prints.

All forensic evidence are liable to error and fingerprints are no exception. In general, there are two types of error: false negative and false positive. A false negative occurs when the two fingerprints are a match but the examiner declares the fingerprints to be different. A false positive is when two fingerprints are not a match but the examiner concluded otherwise. In both cases the consequences are different, while false negatives may not entirely exonerate a criminal, false positives can lead to wrongful convictions where an innocent person can face jail time for something they did not do.

Example of a fingerprint Source: Wikimedia Commons

There are eight common fingerprint patterns: arches, tented arches, right loops, left loops, plain whorls, central pocket loops and double loops. When the lines or ridges on a finger develops and meets other ridges, the two ridges can interact in many ways, resulting in what is called a minutiae. Since fingerprints depend both on genetic and environmental factors, the patterns developed are very unique. Even identical twins can develop different fingerprints. However, theory and practice can be very different. In the modern age, there still is not a definitive certainty in how unique the match between fingerprints are. It was claimed that a false positive was one in 64 million. In one study, researchers found fingerprint exams had a false positive error rate of 0.1% and a false negative rate of 7.5%. These numbers show that human error and the quality of fingerprints can significantly influence how forensic experts perceive the evidence.

In the famous case of the Madrid train bombings, Brandon Mayfield was wrongfully convicted based on fingerprints that were found at the scene due to poor quality of the fingerprints. Later on, when the five fingerprint experts were asked to re-examine these prints, three experts reversed their conclusion and claimed the results were inconclusive. In conclusion, while fingerprints are a useful tool, they are not infallible and prone to human error more than one expects.

(1)
Knapton, S. Why Your Fingerprints May Not Be Unique. The Telegraph. March 14, 2016.
(2)
The “CSI Effect.” The Economist. April 22, 2010.
(3)
Statement on Brandon Mayfield Case https://www.fbi.gov/news/pressrel/press-releases/statement-on-brandon-mayfield-case (accessed Mar 20, 2019).
(4)
Latent Print Examination and Human Factors: Improving the Practice through a Systems Approach. 249.
(5)
Latent Print Examination and Human Factors Improv.Pdf.
(6)
God’s signature: DNA profiling, the new gold standard in forensic science. – PubMed – NCBI https://www.ncbi.nlm.nih.gov/pubmed/12798816 (accessed Mar 20, 2019).
(7)
Stephanie. False Positive and False Negative: Definition and Examples https://www.statisticshowto.datasciencecentral.com/false-positive-definition-and-examples/ (accessed Mar 20, 2019).
(8)
Photographer, T. English: Fingerprint; 2009.
(9)
Spiro, R. Do Identical Twins Have Identical Fingerprints? | Washington State Twin Registry | Washington State University. Washington State Twin Registry, 2015.
(10)
14 Amazing Forensic Science Techniques.
(11)
8 Most Common Fingerprint Patterns. Touch N Go, 2017.

Is it actually 100% oregano?

Have you ever wondered what is in the food you eat? This pizza may contain additional ingredients that you may not be aware of.

According to Canadian Food Inspection Agency (CFIA), food fraud is an emerging global issue. In fact, food fraud “may cost the global food industry $10 to $15 billion per year”. Examples of food fraud may include substitution/addition of ingredients or tampering/mislabeling of food packages, and selling these inferior products at a higher price for profit. Food fraud is problematic; therefore, it is crucial that CFIA and the food industry combat food fraud to protect consumer safety.

However, in 2016, there has been a report of adulterated dried oregano in Australia. Some brands that declare “100% oregano” only have 33% – 50% of actual oregano. The remaining percentage could contain additional olive and myrtle leaves as fillers. The presence of olive and myrtle leaves can pose a health risk, because it can carry a higher amount of pesticides, which can contaminate the dried oregano. Therefore, it is important to find a way to detect these fillers, so that they can be eliminated from the market.


Recently, a paper from the journal of Food Chemistry published in 2019, suggests that GC-MS (a common instrument in a Chemistry lab) can be used to detect and measure the amount of pesticides in adulterated oregano samples. By identifying the most predominant pesticides in adulterated oregano, the pesticides can be used as potential markers for identifying adulterated oregano.

But how does GC-MS work? In the “GC” part of the instrument, the pesticides travel through the column, in different speeds, based on its unique chemical properties. Once all of the pesticides are separated, they go through the “MS” part of the instrument, where they get fragmented by a beam of electrons before it travels through the mass analyzer and reaches to the detector for data collecting (see image below).

A schematic of the GS-MS instrument. Detector is attached to the right side of the mass analyzer (not shown). Cwszot, KkmurrayCreative Commons  Attribution 2.5 Generic (CC BY 2.5), Electron ionization GC-MS.png

As a result, pesticides (cyfluthrin (sum), cyhalothrin lambda, and pyriproxfen) are present in higher quantity in the 34 adulterated oregano samples than in the 42 genuine samples. Therefore, cyfluthrin, cyhalothrin lambda, and pyriproxfen could be used as potential markers for detecting adulterated oregano.

Graph from the research paper. Click on the image for high-definition. Drabova et al., Creative Commons Attribution 4.0 International (CC BY 4.0),  Adapted from Figure 5 in Food fraud in oregano: Pesticide residues as adulteration markers

In conclusion, it is possible to identify the adulterated samples by using a chemical technique to stop food fraud. Although CFIA and food industries work to protect consumers from food fraud, CFIA suggests a few ways for consumers to identify food fraud.

But as for me, I will stick to growing my own oregano in my backyard.

Updated: March 28, 2019 

Reference:

Canadian Food Inspection Agency. The CFIA Chronicle. http://www.inspection.gc.ca/about-the-cfia/the-cfia-chronicle-fall-2017/food-fraud/eng/1508953954414/1508953954796 (accessed Mar 08, 2019).

Canadian Food Inspection Agency. Food fraud. http://www.inspection.gc.ca/food/information-for-consumers/food-safety-system/food-fraud/eng/1548444446366/1548444516192 (accessed Mar 08, 2019).

Canadian Food Inspection Agency. Types of food fraud. http://www.inspection.gc.ca/food/information-for-consumers/food-safety-system/food-fraud/types-of-food-fraud/eng/1548444652094/1548444676109 (accessed Mar 08, 2019).

The Sydney Morning Herald. Food Fraud: Popular oregano brands selling adulterated products. https://www.smh.com.au/business/consumer-affairs/food-fraud-popular-oregano-brands-selling-adulterated-products-20160405-gnygjo.html (accessed Mar 08, 2019).

Drabova, L., Alvarez-Rivera, G., Suchanova, M., Schusterova, D., Pulkrabova, J., Tomaniova, M., . . . Hajslova, J. Food fraud in oregano: Pesticide residues as adulteration markers. Food Chemistry. [Online] 2019, 276, 726-734. doi:10.1016/j.foodchem.2018.09.143 (accessed Mar 08, 2019).

Canadian Food Inspection Agency. How food fraud impacts consumers. http://www.inspection.gc.ca/food/information-for-consumers/food-safety-system/food-fraud/how-food-fraud-impacts-consumers/eng/1548444986322/1548445033398