Rekindling BeLeaf

Standard

In the 2017 cohort of Hatching health, which ODetect was also a part of, I came across BeLeaf. From my perspective, it looked like an idea championed and introduced at the event by Matthew Miller, from Island Health. They won the top prize at the event.

Its core idea was a simple one. People suffering from depression needed a low-barrier way to be connected with their loved-ones. As someone who has ghosted friends when my mental health was in the gutters, this idea made natural sense to me. This low-barrier communication would take the form a physical, electronic “Leaf” that lives on bedside tables. There would also be a mobile app, because apps will eat the world (jk).

Each synthetic plant — one for the individual living with depression, the other for their supporter — would be connected to a series of lights and a mobile app, which would serve as a self-assessment and support tool for users. As new data is entered into the app, the colour of the light emitted from each synthetic plant would automatically change, signalling the individual’s current state of mental health.

“We recognized pretty early on that it was important for us to not only create a mobile app, but to have a physical product that would enable people living with depression to express themselves and communicate with those who are special in their lives. Sometimes the hardest thing is starting the conversation,”

They chose to embody the physical aspect of the connection as a leaf, to draw a parallel to mental health – requiring that they both need care, and constant ongoing work.

They later went in the lean launchpad program at e@UBC, did some rebranding as Cora Luma. The twitter handle isn’t active since July 2018 and their website down. Matthew Miller is still active and Director of innovation at Vancouver Island Health.

I’m really curious to know more about what happened. I guess an email to Matthew is due. (Update: I have sent him an email).

My thought stream regarding this…

Following up from post regarding being a subject expert (related to the ESP32), and looking to see what kind of a solution and product I can build up as a 1-man-band is quite intriguing (after seeing Luke Cyca’s extremely thorough, intentional work with CraftMetrics). Essentially, what can I accomplish if nothing is riding on this. If I’m not looking to financially support myself off this work, if there is no “deadline” that I’m running towards, if I don’t cut corners (no technical, intellectual or financial debt), what is it that I can contribute to this field and myself.

{I will go technical here}

Going towards the solution that brought this idea/project that was floating in the “past” section of my brain to the front –

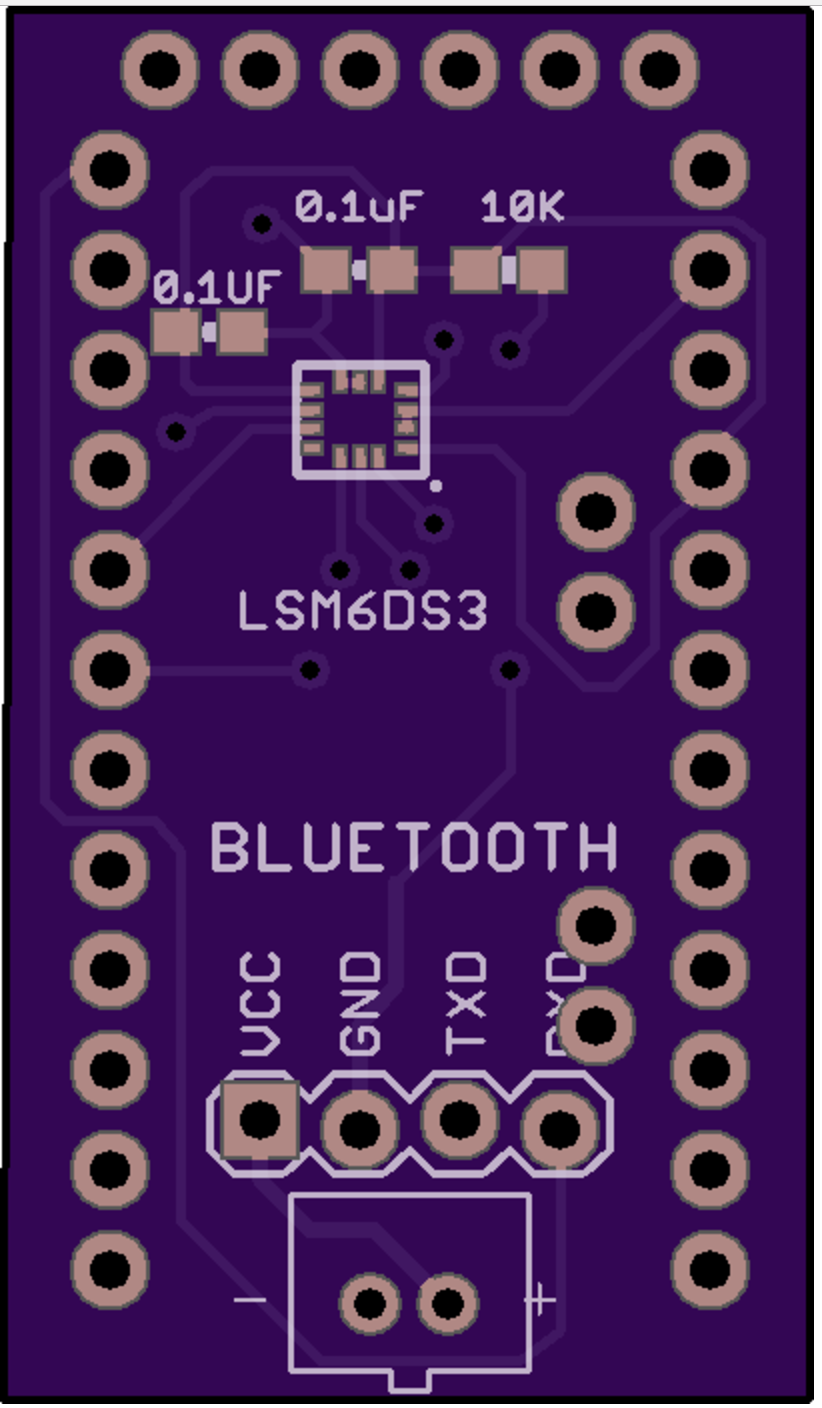
The ESP32 is this open source microcontroller with WiFi and Bluetooth. I feel like it is all that is required to be the brains and the controller for a synthetic leaf. It additionally has capacitance sensing on a couple of its pins so it could be used to sense tactile feedback. It can obviously control various LEDs. In addition, the BLE functionality on the device could be used by the end-user to connect the device to WiFi. Essentially, a simple development board off-the-shelf could entirely be used to build up the proof of concept.

In addition, the amazing folks at espressif have prepared an ESP Jumpstart guide that goes over how we can create a “product” using the microcontroller including OTA features, cloud connectivity (AWS) and some form of app control? Things the particle already provides, but hides them under a layer of convenience which they charge for.

Currently playing around with the Arduino tutorials and planning to move on to the jumpstart tutorials when I set up the IDF (not israeli defense force but the integrated development framework).

Thermistor airflow sensors

Standard

Airflow sensors, especially in the domain of sleep diagnostics, measure respiration rate and flow in general use thermistors as the temperature sensors. Each airflow sensors consist of three thermistors, positioned at each nostril and over the mouth. Thermal airflow sensors work on the principle of the different temperature of the ambient air while breathing in (ambient air temperature) vs. breathing out (37 degrees).

Sensors available on the market are mucha expensive and possibly proprietary connections leading to bulky connections. Might make sensor to build our own.

The base sensor that we are choosing to use is a glass encapsulated DO35 package through hole thermistor from digikey.

Some characteristics

  • DO-35 package (JEDEC Standard)
  • Glass encapsulated
  • Resistance of 50K at 25degrees C
  • Time constant
    • 5 seconds (Still Air)
    • 0.5 seconds (Stirred Liquid)
    • Response time of air with convection should lie between above limits
  • RT curve is shown in the curve below
    • 55K at 23 degrees C
    • 30K at 37 degrees C
  • 20mW maximum power
    • Current through thermistor must be less than 0.8mA (800uA)
    • With a 47K resistor in series, currents are on the order of 60uA (well under 800uA limit for max power)

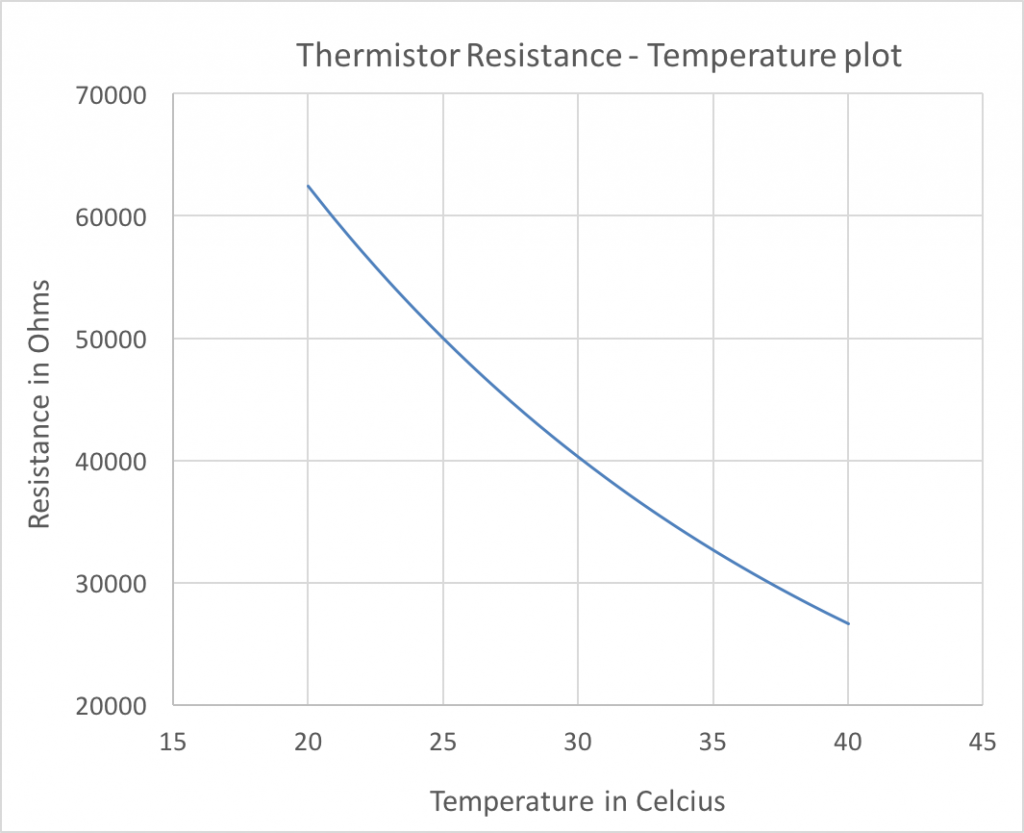
Implications of these characteristics

  • Sensor head is approximately 5mm wide
  • DO35 footprint on PCB is also ~5mm
  • For  5 second response time, sensor can detect 12 temperature changes a minute, or 6 breath cycles (each breath cycle is temperature increase followed by a decrease) – 6bpm limit
  • For a 0.5s response time, RR limit is 60bpm
  • Including the thermistor in a resistance bridge (with 47K ohm resistor) to function as resistance to voltage converter, the output voltage changes from 2.7V@23 degrees to 1.94V@37 degrees
  • Increase in ambient temperature leads to to a decrease in output voltage range
  • It is also important the the current through the thermistor be as low as possible to avoid any resistive heating effects that cause a temperature change

Thermistor circuits
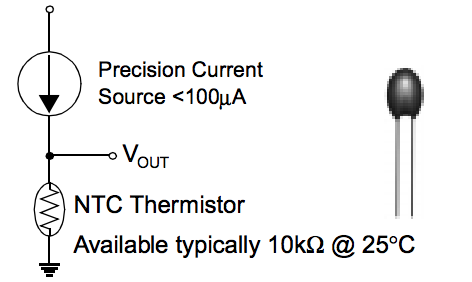
Using a precision current source is the right way to exploit the Resistance-Temperature relationship of a thermistor.

However, we do not require absolute temperature but rather relative temperature changes. As such, simply placing a 47K resistor ensures that the currents are within the max power limit, and that the output voltage has substantial change.

Using an opamp however as a buffer block (negative feedback with gain 1) can prevent any loading/interference on part of the microcontroller circuit

Test circuits

  1. Wearable #1

Features/Specs

  • Designed for wires to be wound around ears. Header/wire connections at either end.
  • 2 separate thermistors for nostrils (15 degree angle, 0.3′ apart)
  • Thermistor for mouth airflow temperature
  • Simple Resistor bridge circuit
  • Thermistor is the GP103J4F
  • 1206 resistors (10K) – Easy manual solderability
  • Ordered on 13 Nov, Oshpark Swift, free shipping

2. Breadboard #1

Features/Specs 

  • Thermistors
  • Through hole resistors
  • DIP opamp


Pulse sensor hardware walkthrough

Standard

This is the current schematic of the hardware used by the open sourced pulse sensor board (credits to Joel Murphy @ www.pulsesensor.com) we are currently using. I will run through it to so as to give a brief idea of what each component does in the scope of the inputs and outputs to the system. Also, I will discuss ways to mitigate risks and problems with the board.

Inputs and Output

The inputs to the system are simply V+ (can be either 3.3V or 5V) and GND. They are used to power up the LED, the photo detector as well as the opamp. The output from the system measures the amount of light received from the photosensor after noise filtration, amplification and modulated about the baseline.

Parts of the circuit

Diode Protection The photodetector and opamp are protected by a schottky diode (D2) in case the V+ and GND are reversed.

LED driver circuit The LED D1 is forward biased and connected between V+ and GND through a 470Ohm resistor. Typical forward voltage of the LED is 3.3V, so when powered with a 5V input, the LED draws 3.6mA.

Photodetector ADPS-9008 is the photodetector model being used. Its spectral sensitivity is similar to the human eye, which means it is sensitive to RGB, but not IR. The photodetector converts the incident light into a current output which is pushed out the chip through the output pin. The light (and current) consists of a DC component (made up of light reflected from tissue and bone) and a pulsatile AC component (light reflected from blood). The output current goes from 40uA at 100lux light signal to 200uA at 500lux (almost linear response). When this current is sunk into the 12k ohm resistor, the voltage at the output pin can go up to 480mV (100lux) to 2.5V (500lux).

Signal conditioning

Concepts helpful for circuit analysis 

Principal of linear superposition An input signal can be broken down into different components that together add up to it. The response of the circuit to each of these components can be analyzed separately and all the responses added up to give the response to the total input.

Impedance of capacitor The impedance(resistance to flow of current) of capacitors to different voltage signals depends on the frequency. Lower the frequency, higher the resistance of capacitance. For truly DC signals, capacitors act as infinitely high impedances similar to open circuits.

DC circuit analysis Capacitors C3 and C4 act to disconnect the circuit into two independent parts. For any constant voltage input, the output is expect to be 0.5*V+ as the capacitors decouple the two parts of the circuit.

AC circuit analysis All supply rails go to AC ground.


As mentioned previously, the resistor R2 is used a current to voltage converter, translating the current output of the photosensor into a voltage.


R5 and R6 act as a inverting gain amplifier with an eye popping gain of 330 (3.3MOhm/10KOhm). By giving the +ve terminal of the opamp a virtual ground voltage of 2.5V, the amplification is centered around 2.5V.


Current to voltage conversion The current output through the photodetector is sunk into the

Package, Fabrication and Assembly considerations

Diode In its current form, the diode is in an 0603 package and hence leading to loss of yield during assembly. To avoid this, this package will have to probably be modified to a SOT or SOD package.

LED The LED is a reverse mount Z bend LED that can be mounted on the component side of the PCB but still emits light towards the other side through a through hole drilled in. Alignment and orientation of the LED light with the through hole is mediated by the surface tension of molten solder pulling it into a symmetrical position. Hence, the tCream layer dimensioning is critical for output signal. The positioning can also be corrected using a smaller drill hole ensuring a snug fit. The current version of the PCB has a higher prescribed tolerance so as to get the LED into the hole in the first place. Now that this has been confirmed, the tolerance can be reduced.

Addnl. notes When the LED is viewed from the back, the smaller metal bit in the die goes to the higher voltage.

Connections between components in the device

Standard

The pulse sensor needs to be connected to the circuit. The circuit playground has 12 ENIG contacts onto which wire from the pulse sensor/other places can be soldered onto. While soldering wires onto a wires we need to keep in mind a few things

  • How strong is the connection – Leads on to reliability considerations
  • What is the mechanical load on the joint? How can it be relieved? (glue gun?)
  • Is there a possibility of interference with other wires/signals? (parasitic capacitance, cross talk and exposed metal
  • Ease of making a connection

After thinking about this, the easiest method I can think of is generous application of the cheap aliexpress solder past on the contact and hot air gun treatment to reflow and bond. This could be followed by application of hot glue for stress relief (can’t be done if the system needs to be reconfigured. Solder can be removed using a wick, but glue is much harder.

A similar method may be used for connecting the pulse board to the wires as well.

DIY Kapton Stencils

Aside

Resources

https://learn.adafruit.com/smt-manufacturing/laser-cut-stencils

How to Laser Cut a PCB Solder Paste Stencil on Kapton

In brief, convert gerber to SVG using gerbv. Transform features in inkscape. Send SVG/PDF file to printer. Laser cut in vector/raster form. Ozbotz seems to have amazing resolution using raster.

Settings on EngPhys laser cutter

Vector Cut – 30% Power, 30% speed, 600ppi works and cuts through 2 mil kapton. Proportional power increase for increased thicknesses? ppi can be increased.

DIY Gel Doc

Standard

The lab was looking for a simple non-UV gel doc system after we got the DNA electrophoresis setup. EmbiTec sells a cheap (~1K USD with camera, 600 without) gel doc system that lets one take images simply with a camera or even a mobile phone. Could I take the major themes from this product, and build one really quickly (and cheaply)?

It simply consists of a black plastic box that provides the necessary focal length for the camera to focus on the gel that is placed on a glass bottom that is illuminated with the necessary LEDs to excite the DNA dye. Optionally, an amber long pass filter can also be used to increase contrast.

I first made a box out of black poster sheets from thorlabs that was lying around in the lab by laser cutting. I definitely need to automate the process of making 3D objects by using slots in 2D sheet material. Maybe solidworks can help with this. Need to learn! Once assembled by aligning the slots with the holes, the edges were simply glue together to produce a reasonably strong and optically non-reflective box.

This box was sized to fit the 385 UV lamp that we currently have in the lab, but it was observed to be too strong when used with the gel. It’s too bad there isn’t any intensity control. Also, we needed a diffuser since the the LED’s in the lamp are large and discrete. When this didn’t work, I started thinking about using a tracing light box/surface as the light source. 

Taking it apart revealed a few interesting things and increased by already high mad respect for chinese engineering. The device simple consists of a row of white LED’s (with 68 ohm resistors) all connected in parallel to voltage rails. The voltage across these rails can be cycled through 2.6V, 3.3V and 4.4V by tapping on a capacitive switch (no BOM, all in PCB design itself!) connected to an 8 pin microcontroller. Would love to reverse engineer this when I have time. But going back to the original task at hand, I needed this box to now generate a diffuse uniform blue back-light.

Doing this called for a couple of modifications, the white LEDs in the PCB had to swapped out for specific LEDs that are capable of exciting gel green (the DNA dye). Gel green has an excitation peak at 500nm, and an emission peak at 530nm. Sadly, 500nm is right between blue and blue-green, so I couldn’t find an LED on digikey that had a coincident emission peak.

Image result for gel green excitation spectrum

I settled for the SMLE13BC8TT86, which is an InGaN LED that emits at 470nm. It is available in an 0603 package, whose footprint is close to the footprint on the PCB of the tracing box. Assuming a forward voltage of 3V. Using the 68Ohm resistor at the high voltage rail setting gives an approximate forward current of 20mA (almost close to the peak applicable current). Increasing intensity would mean a decrease in size of the light box and a density increase.

An image of a gel frame with the dark box and the modified LED array looks like this

Standard of comparision for RR from Pulse Ox

Standard

So, hypothetically when I do extract RR from pulseOx (maybe I need to do that first, before even considering this question), how do I know what I’m measuring is right?

This question led me to ask which other methods of measuring RR could I use to increase confidence in my estimate. The simplest way is to keep count. This quickly gets irritating. The other way is to use capnography (yuuge setup and cost). Impedance capnography needs electrodes. Theoretically, I could look at the phrenic nerve/diaphragm – but there’s no practical way. IMU measurement of chest motion (which the BEST team uses for the respiratory rate). Can be used to get a decent estimate of BPM (breaths per minute).

Ideally, I’d like a way to transmit Acceleration and Gyroscope data to the PC using bluetooth at the same time the pulseox is transmitting data over serial so I could look at both together. So, I’m using the HC-05 bluetooth module to transmit this data. The module connects to VCC, GND, TX and RX of the microcontroller. The HC-05 module itself is 3.3V, but has level conversion circuitry to accept 3.3V to 6V Vcc. As for the IC, I chose the LSM6DS3 because it is cheap, has 6DOF, a huuuge FIFO buffer, good libraries and circuit schematic I can base my design off of (Amazing souls at sparkfun). The LSM6DS3 communicates to the microcontroller through I2C and 3.3V logic. As bluetooth and the main chip were using 3.3V logic, it made sense to go with a 3.3V development board. I chose to use the Arduino Pro Mini (the 0.8mm version Sparkfun makes) with an atmega 328P. The whole thing can be powered by a 3.7V LiPo battery through a JST header. I managed to fit a 4 pin right angled header for the HC-05 module, the IMU and a JST header on the footprint of the pro mini to make a header. The bluetooth module can be connected into the female header. This is my first wholly contained wireless design. Some parts may take time to arrive, so I’m looking to get this board working by the end of this month.

I hope it works : )

Updates on pulseox

Standard

The shitty prototype I cobbled together worked at first go! Never before has something at this level of complexity (not exactly complicated, but with so many variables that could go wrong) all checked out green.

I hand soldered male headers onto the reflow soldered board and connected it to an Arduino Uno. I ran the sample code from Maxim and lo – The chip shone red (and IR on the phone) and the serial monitor was populated with rows of data showing Red, IR, HR, SpO2!

It was another thing that the data was super noisy – A heart rate variability of 30bpm is just not done. It’s super easy to get data from sensors and be ecstatic, but making that data reflect something physical is the tough part.

Now that I can extract data from the IC, after I figure out a reliable method for housing, I need to start working on getting this data to matlab and start over with Rajbabu’s DSP fundae again. Additionally, I probably should start thinking about making it wireless using a bluetooth serial link to not have the finger/wrist always close to the computer. Something like this might work great!

Thinking about housing – Easiest to probably buy a wooden clip, and place the optical part of the PCB into a hole drilled in. Which side of the finger? Nail or flesh? Does the whole thing need to be covered by a black sleeve? Which of the approved FDA pulse oximeters use reflectance PPG?

Now onwards to make as many boards as I can and start thinking about putting this PCB onto a housing that can be put around the wrist or the finger.

Breakpoints in prototyping

Standard

When you’re trying to do something that has a high probability of failure/low probability of success, it probably is so because P(A&B) is P(A)*P(B) when A and B are independent events. Say A succeeds 1 in 10 times, and B is similar, the net probability of success is 1 in 100. The easiest way to improve your odds is to break this large chunk of work into smaller independent blocks, which are then worked upon until they have large probabilities of success. Then these blocks are put back together, which increases their probability of success. One might argue that the process of putting blocks together introduces new complications and handshake errors. With enough attention to detail, these can be avoided.

A system to obtain SpO2, HR and RR comprises of multiple independent (arguably) stages. There’s a data acquisition stage, followed by the data processing and user interface stages. The data acquired by the sensor communicates to the microcontroller through I2C and also operates on 1.8V necessitating external circuitry for interfacing. Once the data is acquired by the microcontroller, multiple DSP algorithms need to work on the photoplethysmograph (PPG) to extract respiration induced variations. The user interface involving light/sound/tactile routes form the final piece of system.

Thinking out loud, there are a few things that could be done to speed up the process of development

  • Get a MAX30102 evaluation board (which comes with I2C code to interface to an Arduino). This eliminates most sources of failure at the data acquisition and communication stages. Some of these could be
    1. Poor contacts during soldering
    2. Mistake in PCB design
    3. Firmware issues (i2c communication protocol)

The code running on the arduino can be modified such that it prints the SpO2 value to the serial port. At this stage, the acquisition circuit and sensor can be simply viewed as a blackbox that takes a finger/earlobe and outputs the SpO2 value. This modularity makes the data processing part easier. (the data processing also needs to be done separately, as the atmega 328 is not powerful enough to implement advanced DSP algorithms). Implementing a blackbox for mobile applications is slightly difficult, involving either datalogging using an SD card, or wireless bluetooth transmission. However, the lack of a gold standard (self measured RR for example) to compare these results against renders any efforts in those directions almost useless.

  • Use MATLAB functions to apply the custom filters required to extract RR in real time. There’s serial data input into MATLAB, so it can accept the data that it receives from the Arduino. Once we achieve a proof of concept that RR can be reliably extracted from PPG, the code for the algorithms can be implemented for embedded systems (I’d love to stick with atmega since its the only thing I know, but maybe I need to push myself out of my comfort zone). PJRC’s teensy 3.2 that has a ARM Cortex M4 (sweet sweet 72Mhz) and 32x more RAM + 8x more flash might be something to tack on the next oshpark order.
  • The user interface can similarly be prototyped separately, to decice how loud the sound/ what colours/frequency/intensity the lights need to be to attract a bystander’s attention. More discussion with stakeholders needs to happen to better understand the environment in which overdoses happen.

That being said, the technical requirements/adventures must not take away from the original goal of this effort – to make an ultra low cost vital signs monitor that can act as an early alert system for fentanyl overdoses. I can’t imagine the BOM of such a device being greater than $10. Additional roadblocks towards making a tangible difference with this device might be a classification of this device as a medical device (which it most likely it is), unless I could paste an analog watch face on the top and label it a wellness device (srs, not srs but hlf srs).